Transcription
dows.com358 US Route One, Falmouth, Maine 04105207.878.3000 800.578.9981 info@dows.comPORTFOLIO TURNOVER AND COMMON STOCK HOLDING PERIODSIn observing the relative performances of common stock portfolios over the years, it has been myimpression that the more successful portfolios have had average turnover rates which, over time,have gravitated to about 25% per year which, in turn, has implied average holding periods for thestocks in the portfolios of about four years. Additionally, it is usually the more recently acquiredcommon stocks in such portfolios that seem more appropriate candidates for sale than stocks thathave been in the portfolios for longer periods of time. The purpose of this paper is to try toincorporate some bases in logic for these two empirically inferred (and perhaps counter-intuitive)findings.TABLE OF CONTENTSPortfolio Turnover Defined.1Calculation of Average Holding Period.2Implied Turnover Rates and Average Holding Periods.2Unacceptable Rates of Portfolio Turnover .3Turnover Rates Among Institutional Investors .4Turnover Rates in Mutual Fund Bond Portfolios .5Is There Probably an Optimum Rate of Portfolio Turnover? .6What Might Be the Length of the "Optimum Period of Prediction"in the Management of a Common Stock Portfolio?.8The Theory of Chaos.8Fractals .12Time Series and the Capital Markets.14Peters' Application of Chaos Theory to Common Stock Cycles .14An Interpretation of Natural Common Stock Cycles as aGuide to Arriving at Optimum Portfolio Turnover Rates .16The LIFO Phenomenon in Portfolio Management.17Buy, Hold, & Sell Categories.18Conclusion.19PORTFOLIO TURNOVER DEFINEDTurnover is defined as the ratio of the total of all purchases in a portfolio over some period oftime to the average value of the portfolio over that period of time. The Looper formula, as it iscommonly known, is expressed as follows:Portfolio Turnover Total PurchasesAverage Portfolio ValueThe period of time used as a reference is usually one year. If the period for which thecomputations are made is not one year, the number is usually annualized to facilitatecomparisons. The Looper formula may, then, be embellished as follows:Average Annual Portfolio Turnover Total Purchases365xAverage Portfolio Value Number of Days in PeriodWith increasing precision, "Average Portfolio Value" may be the beginning or ending value ofthe portfolio for the period, the average of the beginning and ending values, the average monthlyvalues, the average weekly values, or the average daily values.Copyright 2007 Dow Publishing Company, Inc. All Rights Reserved.-1-
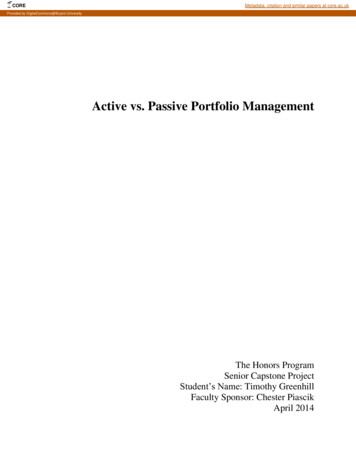
dows.com358 US Route One, Falmouth, Maine 04105207.878.3000 800.578.9981 info@dows.comThe turnover figure calculated is also far more meaningful if the period covered is several years,rather than just several months. In fact, if the period is too short, the turnover figure will bemeaningless. As an example, if somebody creates a common stock portfolio by investing theproceeds of a maturing certificate of deposit in common stocks and decides to measure hisportfolio turnover with the foregoing formula after one week of ownership, he will come up withan Average Portfolio Turnover of 5,214%, indicating that he buys and sells all the stocks in hisportfolio 52 times a year when, in fact, it may be his intention never to sell any of the stocks hehas just purchased.CALCULATION OF AVERAGE HOLDING PERIODThe concept of "average holding period" is perhaps more easily visualized than "averageturnover rate." Average holding period tells us, on average, how long after the portfolio managerpurchases a security, he sells it. Fortunately, given either average turnover rate or averageholding period, one can calculate the other. Given average turnover rate, the formula for averageholding period is as follows:Average Holding Period (in months) 12 monthsAverage Annual Turnover RateVarious turnover rates, then, generate average holding periods as follows:AVERAGE ANNUAL TURNOVER RATE5%10%25%50%75%100%150%200%300%400%600%AVERAGE HOLDING PERIOD20 years10 years4 years2 years16 months12 months8 months6 months4 months3 months2 monthsIMPLIED AVERAGE TURNOVER RATES AND AVERAGE HOLDING PERIODSThere are two major difficulties encountered in trying to calculate turnover rates and holdingperiods from historical purchase and sale and portfolio evaluation data. The first involvesadjustments for major inflows of cash into the portfolio or outflows from the portfolio. If theCopyright 2007 Dow Publishing Company, Inc. All Rights Reserved.-2-
dows.com358 US Route One, Falmouth, Maine 04105207.878.3000 800.578.9981 info@dows.cominflows and/or outflows are of significant size and/or frequency, the mathematics becomeunwieldy. The second difficulty involves the ability to preserve, retrieve, and incorporate intothe calculations all the relevant historical portfolio transactions, even if there have been no majorcash inflows or outflows.Fortunately, there is an alternative for estimating these two portfolio characteristics whichdepends solely upon a static analysis of the portfolio at any given point in time. If one asks thecomputer to provide a weighted average holding period of all the securities in a portfolio, onehas half the battle fought. As long as the portfolio data base includes the date of purchase ofeach security in it, using amounts owned and current prices, an implied average annual holdingperiod is easily computed. Given the average annual holding period, calculation of the averageturnover rate is quite a simple matter, as follows:Average Turnover Rate (in years) 365Weighted Average Holding Period (in days)As alluded to above, using this method, or any other method, a recently created or drasticallymodified portfolio may not begin to reveal its normal average turnover rate and normal averageholding period until the passage of a time interval equal, at least, to whatever that averageholding period happens to be.UNACCEPTABLE RATES OF PORTFOLIO TURNOVERI find the subject of portfolio turnover an interesting one, in part because of the broad spectrumof numbers among stock market strategists as to what "optimum" turnover might be. Let us,however, begin with what it is pretty much universally accepted optimum turnover is not."Churning" is the word used to describe excessive trading, sometimes encouraged by a securitysalesman to generate excessive commissions. Churning, by definition, then, is a level ofportfolio turnover which, at least from the point of view of the portfolio owner, is decidedlygreater than optimal. I find the subject of "churning" particularly amusing because of theextremely high rates frequently practiced and also because of the extremely high rates frequentlyconstrued as acceptable in courts of law and arbitration proceedings.Generally, a turnover rate of six times per year (holding each of the securities in a portfolio, onaverage, for only two months) is regarded as prima facie evidence of churning. A turnover rateof 2½ times per year (an average holding period of 4.8 months) is apt to be the threshold of thedefinition of churning in an arbitration proceeding.Copyright 2007 Dow Publishing Company, Inc. All Rights Reserved.-3-
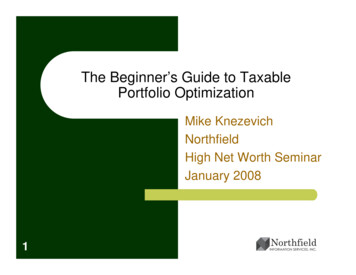
dows.com358 US Route One, Falmouth, Maine 04105207.878.3000 800.578.9981 info@dows.comBack in the 1960s, a writer in the Harvard Law Review ranked turnover rates, based on theLooper calculation, in what has become known as the "2-4-6" formula. This often-used rule-ofthumb is defined as follows:AverageTurnover200%400%600%AverageHolding Period6 months3 months2 monthsDegree of Indication ofExcessive TurnoverInferentialPresumptiveConclusiveA series of classic court cases covering the four decades following World War II has alsoindicated a general acceptance of surprisingly high rates of portfolio turnover. As seen in thetabulation below, in fifteen cases in which the turnover rates were construed as excessive, theaverage holding period ranged from as short a period as four days to as long a period as sixteenmonths, with an average of one month and a median of four months. Similarly, in the sevencases in which the turnover rate was deemed acceptable, the average holding period ranged fromas long as fifteen months to as short as two weeks, with an average of two months and a medianof six E RATES OF PORTFOLIO TURNOVERAvg Holding PeriodYearTurnover8.0 months1980200%7.6 months1982600%4.1 months1984667%3.7 months19842,600%4.1 days1985893%8.4 months19851,202%6.0 monthsAverage 1,106%15.6 monthsMedian293%8.4 monthsAvg Holding Period6.0 months2.0 months1.8 months2.0 weeks1.3 months1.0 month1.1 month4.1 monthsACCEPTABLE RATES OF PORTFOLIO TURNOVERYearTurnover Avg Holding Period19532,500%2.1 weeks1975338%3.6 months197680%15.0 months1977700%1.7 months1978185%6.5 months1984187%6.4 months1987200%6.0 monthsAverage599%2.0 monthsMedian200%6.0 monthsTURNOVER RATES AMONG INSTITUTIONAL INVESTORSThe average turnover rates among the nation's professionally managed pension funds is said tobe about 70%, indicating an average holding period of 17 months. Because mutual funds operatein a fish bowl, because there are so many of them, and because their operations are soexhaustively studied, however, it is probably these institutional investors that provide the bestsampling of the level of trading activity among the nation's professionally managed institutionalportfolios.In this regard, in 1998, the 435 mutual funds categorized by Morningstar as "Large-cap Growth"funds had an average turnover of 93% (a 12.9-month average holding period), the 195 fundsCopyright 2007 Dow Publishing Company, Inc. All Rights Reserved.-4-
dows.com358 US Route One, Falmouth, Maine 04105207.878.3000 800.578.9981 info@dows.comcategorized as "Mid-cap Growth" had an average turnover of 108% (an 11.1-month holdingperiod), and the 183 funds categorized as "Small-cap Growth" had an average turnover of 120%(a 10-month holding period). Over the ten-year period 1989-1998, the "large-cap growth" fundshad average turnover rates of 93% (12.9 months), and both the mid-cap and small-cap growthfunds had average turnover rates of 114% (10.5 months).Of equal fascination is the extraordinary rates of turnover of the more active mutual funds. Thetwenty-five most active growth funds covered by Morningstar in 1998 had portfolio turnoverrates that ranged from 215% to 972% and averaged 320%, which rates translate into averageholding periods of 24 weeks, 5 weeks, and 16 weeks, respectivelyIncidentally, it is, to a large extent, the high turnover rates characteristic of mutual funds that isresponsible for their annual total returns' averaging significantly less than benchmark indicesused to measure the performances of the particular market sectors in which they invest. Highturnover rates exacerbate the problem, unique to large institutional investors such as mutualfunds, known as "market impact costs" the costs, over and above the usual operating expensesand marketing (12b-1) fees, associated with the sacrifices in price that must be incurred whentrading large blocks of stock.TURNOVER RATES IN MUTUAL FUND BOND PORTFOLIOSThough our primary interest here is the management of common stock portfolios, my moststunning discovery in researching for this paper was the extraordinarily high rates of turnoverthat prevail in the portfolios of mutual funds that invest solely in high-quality bonds.Traditional investing assumes that high-quality bonds are purchased to be held to maturity, inwhich case the turnover in such a bond portfolio should be quite minimal. If we buy equalamounts of bonds each year with maturities of five years and hold them to maturity, our averagerate of turnover will be 20%; if we buy ten-year maturities, our turnover rate will be 10%; and, ifwe buy twenty-year maturities, our turnover rate will be 5%.Overwhelmingly, the prime determinants of the value of high-quality bond portfolios arechanges in the level and structure of interest rates. Therefore, in the case of a high-quality bondportfolio, the only justification for active management is the belief that the portfolio manager canforecast changes in interest rates, and buy and sell bonds in accordance with his forecasts, withenough reliability to outperform a "buy-and-hold strategy" and by a margin great enough morethan to cover the cost of retaining his services. (Junk bond portfolios might be expected to bemore actively managed than high-quality bond portfolios, since changes in the fortunes of theunderlying company impact the safety of a junk bond. In such a case a change in the quality ofCopyright 2007 Dow Publishing Company, Inc. All Rights Reserved.-5-
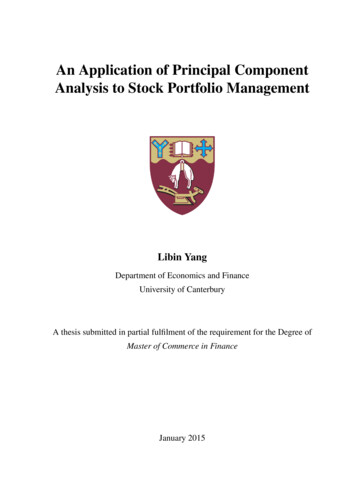
dows.com358 US Route One, Falmouth, Maine 04105207.878.3000 800.578.9981 info@dows.comthe bond, as well as changes in interest rates, may be a major determinant of changes in itsvalue.)The performance data on actively managed high-quality bond portfolios is not encouraging,however. The following tabulation is insightful:1998Number of Funds in CompositeAverage TurnoverAverage Holding PeriodOperating Expenses (Expense Ratio)Total Return Shortfall Relative to Index1989-1998Number of Funds in CompositeAverage TurnoverAverage Holding PeriodAverage Annual Operating ExpensesAverage Total Return Shortfall Relative to IndexLONG-TERMHIGH-QUALITYCORPORATE BONDSLONG-TERMU. S. GOVERNMENT &AGENCY BONDS55163%7.4 months1.06%-5.37%33168%6.1 months1.10%-3.49%18 in 1989 to 55 in 1998139%8.6 months1.00% per year-2.24% per year19 in 1989 to 33 in 1998170%7.0 months0.89% per year-1.78% per yearFor corporate bonds the benchmark index is the Lehman Brothers Corporate Bond Index. For U. S.Government bonds, the benchmark index is the Lehman Brothers Long-Term Government/Corporate BondIndex. The performance of an index is generally accepted as the equivalent of the performance of a randomlyselected and unmanaged portfolio of the securities in the particular market sector being measured. It is,therefore, the equivalent of a "buy-and-hold" investment strategy.Remarkably, mutual funds that invest in high-quality bonds, on average, are actually moreactively traded than are mutual funds that invest in common stocks.As seen in the foregoing data, the significant amounts by which the underperformance of highquality mutual fund bond portfolios exceeds their average annual operating expenses is clearproof that the return on their high rates of activity is negative.IS THERE PROBABLY AN OPTIMUM RATE OF PORTFOLIO TURNOVER?Other than my own, I am aware of no empirical studies designed specifically to determineoptimum rates of portfolio turnover. Furthermore, I would be reluctant to subject my ownstudies to tests of scientific rigor. In fact, based upon my own observations alone, I am morecomfortable calling my conclusion that the magic number is 25% (implying an optimum averageholding period of 4 years), more of a "hunch" than a demonstrable fact.Copyright 2007 Dow Publishing Company, Inc. All Rights Reserved.-6-
dows.com358 US Route One, Falmouth, Maine 04105207.878.3000 800.578.9981 info@dows.comBefore trying to defend these 25% and 4-year figures, however, let us examine the propositionthat there may even be any validity to the concept of an "optimum" rate of portfolio turnover or"optimum" average holding period for a common stock.Let us assume that there is a publicly traded company scheduled to report its earnings tomorrowand that it is generally accepted, as a near certainty, that the company will announce an earningsincrease of 50%. Should we purchase that stock today with the expectation of being able to sellit tomorrow at a profit brought about by the actual announcement of the 50% increase inearnings? Intuitively, we all know that this would not be a good reason for buying the stock.But why would it not be a good reason for buying the stock?The explanation lies in the foregoing phrase "generally accepted." It is "generally accepted" thatearnings will be up 50%. Everybody who has inquired believes earnings are going to be up 50%.Hence, the 50% earnings increase is already factored into the price of the stock. To put it intomore technical jargon, the price of the stock today already "discounts" the earnings increase to beannounced tomorrow. There will be no more profit left to be made in the stock tomorrow as aresult of the earnings announcement. The stock has already risen to reflect tomorrow's inevitableearnings announcement.If we know about the big earnings increase to be announced tomorrow, but nobody else knowsabout it, we have a different situation. We can probably buy the stock (or, still better, buy calloptions on the stock) today and sell tomorrow and make an enormous profit. In such a case,however, we are "insiders" with "nonpublic information" and so, if we do act on suchinformation, we must also consider going to jail as one of the likely outcomes.Let us next consider a company which we have studied with great care and conclude that,because of some unique product or service it provides, it should increase its sales and profits ahundred-fold over the next ten or twenty years, in which case the price of the stock had alsoought to go up a hundred-fold over that period of time. We believe it will be another Microsoftor Wal-Mart. Why should we not sell all of our other financial assets and mortgage our houseand put every last dime we can dig up into this promising company?Again, our intuition, if not our experience, tells us that the time frame is too long to ensureaccuracy in our prediction. We know that we can use Microsoft and Wal-Mart as examples onlywith the benefit of hindsight. When those companies were in their infancies, their prospectslooked no better than did those of hundreds of other companies much like them. To have beenconfident of purchasing a Microsoft or a Wal-Mart in their infancies we would have had topurchase ninety-nine other companies that looked just like them at the same time, but whichsubsequently did not make the grade. With only one one-hundredth of our investment in the bigwinners, our overall results over the ten- or twenty-year period would have only mirrored theCopyright 2007 Dow Publishing Company, Inc. All Rights Reserved.-7-
dows.com358 US Route One, Falmouth, Maine 04105207.878.3000 800.578.9981 info@dows.com"aggressive growth" stock sector of the stock market, even though Microsoft and/or Wal-Martwere included among our holdings.Clearly, if the period of time over which we predict is too short (days), the effects we predict arealready incorporated, or discounted, in the price of the stock, and so we cannot make aboveaverage profits by acting upon those predictions, even though our predictions are quite accurate.Similarly, if the period of time over which we predict is too long (decades), the competitivedynamics and uncertainties of capitalism make such predictions extremely unreliable, and so wecannot make above-average profits by acting upon those predictions either.The implication would seem to be that, if there is some reasonable or optimum average periodover which judgments about individual common stock can be made, it is a period so long as to bemeasured in units longer than days, but also a period not so long as to be measured in decades.To describe this period of time, let us coin the phrase "Optimum Period of Prediction"WHAT MIGHT BE THE LENGTH OF THE "OPTIMUM PERIOD OF PREDICTION"IN THE MANAGEMENT OF A COMMON STOCK PORTFOLIO?In reviewing the literature of common stock, portfolio, and market analyses, one is bound to beimpressed by the frequency with which four-year cycles and four-year time horizons areencountered.Though the divergences have been very wide, the stock market itself is said to have a "natural"cycle of 48 months. The business cycle, too, over very long periods of time, has averaged justabout four years. What the Federal Reserve Bank does in controlling the money supply appearsto have a lag time of four years before its impact is felt on the rate of inflation. These four-yearcycles are frequently regarded as being influenced by the four-year presidential election cycle.Many analysts use three-to-five year periods (the mid-point of which, of course, is four years)over which they attempt to project a company's earnings. Value Line, in particular, uses timeframes of three-to-five years in making its longer term projections. Value Line has furtherdemonstrated that its composites of three-to-five year appreciation potentials for individualstocks has been amazingly reliable in predicting major moves in the stock market as a whole,four years later.THE THEORY OF CHAOSThe most compelling studies that I have encountered in support of 25% turnover rates and 4-yearholding periods have been conducted by a mathematician by the name of Edgar E. Peters. Inaddition to being a student of mathematics, Peters is a classically trained economist who studiedCopyright 2007 Dow Publishing Company, Inc. All Rights Reserved.-8-
dows.com358 US Route One, Falmouth, Maine 04105207.878.3000 800.578.9981 info@dows.comunder Nobel Laureate Harry Markowitz, the father of modern portfolio theory. Peters haspublished two books Chaos and Order in Capital Markets and Fractal Market Analysis:Applying Chaos Theory to Investment & Economics not surprisingly, melding his interests inmathematics with the world of investing.Not only does the word "chaos" appear in the titles of both of Peters' books, but the concept ofchaos underlies his theories of the way the securities markets behave. For this reason, let usgrapple with the term "chaos" herewith. The philosopher George Santayana defines chaos as"any order that produces confusion in our minds." As mathematicians define chaos, mentalconfusion may be an outcome, but it is not its essence. A more technical definition says thatchaos isa deterministic nonlinear dynamic system, with fractal characteristics and a sensitivedependence on initial conditions, that can produce random-looking results.In an effort to impart meaning to such jargon, let us talk about it in terms of the stock market. Infact, let us talk about it in terms of the hypothetical analysis of a single stock.In a "deterministic dynamical system," given perfect knowledge of the initial conditions, thefuture is perfectly predictable. It is the famous mathematician, Pierre Laplace, to whom isgenerally attributed original exposition of the doctrine that, given precise knowledge of the initialconditions, it should be possible to predict the future of the entire universe.Presumably, if we have perfect knowledge about the current status of Company A and itscommon stock which includes perfect knowledge about all the factors that will affect thecompany and its stock, both internally and externally, and the relationships among thosefactors we can know all we need to know to predict the future of Company A, including thefuture price of its common stock. We can create a mathematical model whereby we input theinitial conditions (our company analysis), and our model identifies the state of our company atany future time we specify.The characteristics of a dynamical system that make it "chaotic" are the presence of a "large set"of initial conditions which are highly "unstable" and the system's "sensitive dependence upon"these initial conditions. The terms "large set" and "unstable" would seem to describeappropriately the number and character of the variables we would encounter if we were to try tolist all of the factors, both internal and external, that completely describe Company A, itsoperating environment, and the price of its stock, as we study it today.It has been suggested that the concept of "sensitivity to initial conditions" may be understood byimagining a boulder precariously perched on the top of a hill. The slightest push will cause theboulder to roll down one side of the hill or the other. The subsequent behavior of the boulderCopyright 2007 Dow Publishing Company, Inc. All Rights Reserved.-9-
dows.com358 US Route One, Falmouth, Maine 04105207.878.3000 800.578.9981 info@dows.comdepends upon its sensitivity to the direction of a push the magnitude of which push may bequite small. If we are located at the bottom of one side of the hill, we are keenly interested inwhich direction the boulder will be pushed. In a chaotic deterministic dynamical system, all,most, many, or at least some of the initial conditions are like boulders precariously perched onthe tops of hills.A system of chaos is often described as a non-linear system. The difference between a linearsystem and a non-linear system is that a non-linear system relates the variables on either side ofthe equation with powers other than one. Probably the simplest illustration comes from our highschool algebra and geometry. As seen in the following table, the relationship between thecircumference of a circle and its radius is linear. The relationship between the area of a circleand its radius is non-linear, however, because the radius of the circle must be squared (carried tothe 2nd power) to get the area. Similarly, the relationship between the volume of a sphere and itsradius is non-linear because the radius of the sphere must be cubed (carried to the 3rd power) toget its volume.UnderestimateVariableRadiusCircumference of CircleArea of CircleVolume of SphereFormulaOverestimateActualEstimated% ErrorEstimated% Errorr 2!r 10.00 inches9.00 inches-10%11.00 inches 10%62.83 inches56.55 inches-10%69.12 inches 10%!r 2 314.16 sq. in.254.47 sq. in.-19%380.13 sq. in. 21%"r 3 4,188.79 cu. in.3,053.64 cu. in.-27%5,575.29 cu. in. 33%43Notice, also, in the foregoing table that, if we make a 10% error in measuring the radius of acircle, we shall! have a 10% error when we calculate its circumference. This is a linearrelationship. If we try to measure the area of a circle with a 10% error in our measurement of itsradius, however, we end up with an error of 19% to 21% in the area. And, if we try to measurethe volume of a cube with a 10% error in our measurement of its radius, we come up with anerror of 27% to 33% in our volume.It is, then, this non-linearity of so much of the real world that makes it so hard to constructmathematical models with which to predict with a very high degree of accuracy. Imagine theprice of the stock of our Company A related to hundreds or thousands of variables by powers farin excess of one, two, or three.The way mathematical chaos manifests itself is by the observation that, no matter how preciselywe measure the initial conditions in a system (study the company), our prediction of itssubsequent behavior can go radically wrong after a short period of time. Errors in our initialmeasurements compound themselves over time at an "exponential" rate; or, put another way, theCopyright 2007 Dow Publishing Company, Inc. All Rights Reserved.-10-
dows.com358 US Route One, Falmouth, Maine 04105207.878.3000 800.578.9981 info@dows.comhorizon of predictability of such a system grows "logarithmically" with the precision ofmeasurement. What the latter means is that, while we may increase the precision of our initialmeasurements (our company analysis) by ten-fold, the reliability of our predictions may increaseat some much lesser rate by only two-fold, for example.In spite of the fact that there appear to be so many complex relationships that determine thenature of the world around us, the predictive sciences are not all lost causes. As we watchweather forecasters try to predict the path of a hurricane through the Caribbean and into the Gulfof Mexico or up the East Coast, we appreciate how much more confident they are about theirpredictions for the coming day than they are about their predictions for the coming week.Depending upon the complexity of what we are trying to predict and the use to which we want toput our predictions, there is probably some time frame over which our predictions can be put togood use, even in chaotic systems.Though our everyday use of the term might suggest otherwise, mathematical chaos is definitelynot complete disorder. It is a level of disorder whereby predictions may be made with somedegree of reliability, though not over the very long-term. This would appear to be theexplanation of the apparent utility of price and earnings "momentum" stock market strategies thatwork over shorter periods of time, but not for the long-term.Chaos theory seems to govern stock market investing somewhat as it governs the growth of anoak tree. We can plant an acorn with a high degree of confidence that an oak tree will grow, butwe still have little idea of exactly what the oak tree ultimately will look like. With respect to thevolatility of the stock market, chaos theory explains why we might be correct about what willhappen in the future, without having the foggiest idea of when it will happen or how severe thehappening will be. Major events, like stock market crashes, can be expected, but they cannot bepredicted.What mathematical chaos, as applied to the analysis of common stocks, seems to do for us isprovide a conceptual framework for accepting the notion that, though we have some chance ofpredicting the behavior of individual common stocks over some limited periods of time, we havevirtuall
portfolio turnover with the foregoing formula after one week of ownership, he will come up with an Average Portfolio Turnover of 5,214%, indicating that he buys and sells all the stocks in his portfolio 52 times a year when, in fact, it may be his intention never to sell any of the stocks he has just purchased. CALCULATION OF AVERAGE HOLDING PERIOD