Transcription
International Journal of Research in Humanities and Social StudiesVolume 5, Issue 8, 2018, PP 49-61ISSN 2394-6288 (Print) & ISSN 2394-6296 (Online)Performance System of Stock Portfolio during InvestmentDecision Making Using Constant Correlation Model in BusinessIndex 27 and Idx30Dr. Mulyanto Nugroho, MM, CMA, CPAIUniversity of 17 Agustus 1945 Surabaya*Corresponding Author: Dr. Mulyanto Nugroho , University of 17 Agustus 1945 Surabaya,nugcak@gmail.comABSTRACTIt is important to know the performance of stock portfolio during investment. Meanwhile knowingperformance of stock, it will lead to make best decision in investment. Investment is an asset used bycompany to growth the wealth through distribution of investment result. In this research two types of stockwill be observed. They are Business Index 27 and IDX30. Constant correlation model is utilized in thisresearch to describe how sensitive the stock through observation index. It also use for seeking optimalportfolio of stock. Some of research methodology and calculation formula was conducted to solve and seeperformance each indexes of stock as information system of decision support system (DSS). DSS isimportant to support decision maker to make their decision with considering lot of information related. Tomake decision in investment, there are have parameters to be considered such as expected return market(ERM), risk free asset (Rf), return and risk of individual stock. Stock which has positive expected return ofvalue will have good feasibility as investment. Stock which has positive value of return is feasible stock asinvestment. Stock with maximum return and minimum risk is an ideal condition. In Business Index 27, thehighest ERS is TLKM about 0.213740598, and the lowest is BSDE about 0.042412331 while the order ofstock rank is as follow TLKM, BBCA, ADRO, GGRM, BBRI, PTBA, BMRI, ASII, BBNI, and BSDE. Theorder of stock rank according to ERS value through calculation of cut off rate (Ci) and cut off point (C*) forgetting the biggest ERS value in stock selection which is enter optimal stock portfolio. According to the rankfollow the order of ERS ratio value shows in IDX30, the highest ERS is TLKM about 0.213740598 and thelowest is INDF about 0.010961469, meanwhile the order of the stock rank as follow TLKM, BBCA, ADRO,GGRM, BBRI, PTBA, BMRI, ASII, BBNI, and INDF. Stock that has outlier value then it will be out fromoptimal stock portfolio candidate. In Business Index 27, optimal portfolio is formatted from three stocks.They are PT. Telekomunikasi Indonesia (TLKM) with proportion value 51,06%, Bank Central Asia (BBCA)with proportion value 35,7% and PT. Adaro Energy (ADRO) with proportion value 13,24%. In IDX30 listedfor four stocks. They are PT. Telekomunikasi Indonesia (TLKM) with proportion value 49,02%, BankCentral Asia (BBCA) with proportion value 32,53%, PT. Adaro Energy (ADRO) with proportion value11,67% and PT. Gudang Garam (GGRM) with proportion value 6,79%. Performance analysis showsBusiness Index 27 with Sharpe index 0.180353 is higher than IDX30 0.199241. Business Index 27 withTreynor index 0.011559 is lower than IDX30 0.01142. Business Index 27 with Jensen index 0.011254 ishigher than IDX30 0.010999. It shows that Business Index 27 is best choice than IDX30, but portfoliovolatility Business Index 27 is more sensitive than IDX30 through market changes.Keywords: Decision support system, Information system, Stock portfolio performance.INTRODUCTIONRESEARCH BACKGROUNDThe development of investment at the end of2016 shows that the number still continuesincrease until 13.39% compared with last year.Investors expect return of investment, besidesreturn there is risk of investment. Hence, itnecessary to make best decision of investmentthat is considering of maximum return and smallrisk. Return and risk of investment have positivetrend of correlation. The greater risk is borne,the greater return to be compensated [3].Creating optimal stock portfolio is used tomaximize return and minimize risk. Risk can bereduced with combining single securities ontoportfolio [3]. In this research will take case inBusiness Index 27 and IDX30 during threeperiods which is started on January 2014 up toInternational Journal of Research in Humanities and Social Studies V5 I8 201849
Performance System of Stock Portfolio during Investment Decision Making Using Constant CorrelationModel in Business Index 27 and Idx30December 2016 approaching with constantcorrelation model.After optimal portfolio created, then it willcontinue by return of portfolio analysis, risk ofportfolio, and portfolio performance withJensen-Sharpe and Treynor method. Both ofportfolio index is compared whereas has thebiggest number of return, the less of risk, andthe best performance as a recommendation forinvestment option.Previous research, Pratiwi and Yunita (2015)has successfully compared portfolio with singleindex model and constant correlation model inLQ45 Index period 2010-2015. They use riskadjusted method Sharpe, Treynor, and Jensen tomeasure its performance. The result of theirresearch is portfolio with single index modelcreating six stock enter onto optimal portfolio,they are JSMR (32.17%), KLBF ((30,84%),TLKM (18,17%), UNVR (14.30%), ASII(94,26%), and GGRM (0.26%). At the sametime optimal portfolio formation with constantcorrelation model will created eight stock enteroptimal portfolio, they are KLBF (32.24%),JSMR (29.49%), ASII (9.85%), TLKM (7.78%),UNVR (6,49%) BBNI (4.51%), BBCA (5.97%),and BBRI (3.67%). From this fact, performancemeasurement of optimal portfolio which wascreated with single index model has better resultthan optimal portfolio which was conductedwith constant correlation model.Umanto Eko (20018) with title “Analysis andPerformance Assessment of Optimal StockPortfolio LQ45”, has been successfully designeda simulation of optimal stock liquid portfolioLQ45 in 2002-2007 at BEI with single indexmethod and constant correlation. The result ofhis research is showing optimal portfolio whohas created by single index method and constantcorrelation model. It recommend for investor inorder to allocate the biggest fund on TLKMstock. Optimal portfolio which has been createdby constant correlation model has betterperformance.Rifaldy and Sedana (2016) with title OptimalStock Portfolio with Business index 27 in BEIapproaching by Markowitz model. The result is5 of 27 stocks Business Index 27 can enteroptimal portfolio utilizing Markowitz model inperiod May-October 2015. The proportion ofstocks are AKRA (55.1%), ICBP (2.4 %),LPKR (15.06 %), SCMA (21.3%) and MNCN(5.06%). From any various test of formationoptimal portfolio and any difference of index50performance, it make researcher to re-testingformation of optimal portfolio and indexperformance in BEI. A lot of research has beendone whereas stock index between syariah (suchas ISSI, JII) and conventional stock in BEI (suchas IHSG index, LQ45 index, Kompas100 index,and Sri Kehati) as comparison. It is also neededtesting one stock index with two method ofportfolio formation.Nugroho et al (2017) with title the system ofinvestment decision making through analysis ofstock portfolio performance based single indexmodel (comparison study of Syariah stock andconventionalstock).Theperformancecomparison of stock portfolio shows that JIISyariah stock has rate of return portfolio on0.01831 (or 1.831%) higher than IDX30conventional stock of 0.01594 (or 1.594%).Meanwhile the rate of risk portfolio JII Syariahstocks is 0.00599 (or 0.599%) lower than theconventional stock IDX30 on 0.00849 (or0.849%). The performance of the stock portfoliobased on Sharpe index values for JII Syariahinto 0.17407 higher than IDX30 conventionalstock at 0.12054. Treynor index value in JIISyariah is 0.00753 higher than IDX30conventional stock at 0.00719. In addition to,Jensen index value of JII Syariah stocks is0.01909 higher than IDX30 conventional stockat 0.01595. The result of this analysis indicatesthat portfolio performance of JII Syariah stocksis better than the IDX30 conventional stocks.Novelty of research is important. In thisresearch, has novelty which is comparing twostock index in BEI namely by Business Index 27and IDX30 during three years (2014-2016) withconstant correlation model for optimal portfolioformation and performance optimal stockmeasurement. This research also utilizes Sharpe,Treynor, and Jensen for each index.LITERATURE REVIEWFinancial ManagementThe main objective of financial management isto maximize value of wealth which means toenhance company value that is objectivemeasured by public and sustainability oriented.Value of wealth can be seen with developmentof common stock at market (Harmono, 2011).Capital Market and StockCapital market is a market of various long termfinancial instruments that can be traded, eitherin the form of debt, stock, or derivativeInternational Journal of Research in Humanities and Social Studies V5 I8 2018
Performance System of Stock Portfolio during Investment Decision Making Using Constant CorrelationModel in Business Index 27 and Idx30instrument, et cetera. Capital market is source offunding for company or others institution (suchas government) and as facilities for investmentactivities. So that, capital market is facilitiesvarious infrastructure of buying and selling andother activities related (Dermadji andFakhruddin, 2006).In capital market, in order to investor get rightinformation then it is needed an accurateinformation system. System can giveinformation with considering the user need.According to quality of financial informationmeasurement must meet following requirementssort of accurate, relevant, and timely (Nugrohoet al, 2015). Stock is legal document whichshows stock ownership and has claim rights fordividend or other distribution which has beendone by company through other stockownership. Stock is paper that indicates rights ofinvestor (party who owns the paper) foracquiring a portion of the prospect ororganization wealth that issuing securities andcondition who is giving chance for capital useruse its rights. Stock is one of alternative that canbe chosen for investment (Husnan, 2015).The stock price index is a number that used tocompare stock price changes occasionally.Whether a stock price has decreased orincreased compared to a certain time. The stockindex is used for analytical purposes and avoidsthe negative impact of the use of stock prices inrupiah (Mohamad Samsul, 2006: 179).IDX30 IndexIDX30 index is an index that consist of 30stocks which is constituent chosen from LQ45constituent index. LQ45 constituent index waschosen due to LQ45 has described stockperformance with higher liquidity and bigmarket capitalism. Though, some fund managerfeels that 45 of stock is too huge number. Thenumber of IDX30 constituent index that consistof 30 stocks have advantage is more easilyreplicated as a portfolio reference.Business Index 27PT. Bursa Efek Indonesia has cooperation withHarian Bisnis Indonesia launched stock priceindex called it by Business Index 27. Asindependent party, Harian Bisnis Indonesia beable to maintain index independently andflexible whereas constituent index was chosenbased on emiten performance with basic criteriaselection, transaction historical data (technical),and accountability. This index is expected to beone indicator market trend which is able to helpinvestor to make buying decision, hold, orselling some stock in the field of investment onIndonesia capital market (www.viva.com, 29Januari 2009).make decision on their own. There are two typesof DSS, first is programmed, second is notprogrammed. Some attribute DSS are mentionas following: adaptable and flexible, highinteraction, easy to use, efficient and effective,high monitor for making decision, easy todevelop, support for modeling and analysisconcept, support data access, and integratedwith websiteRESEARCH METHODOLOGYExperimental ResearchThe research has been done with some steps.They are stock selection consistent from January2nd 2014 to December 30th 2016, it will becontinuing become constituent from BusinessIndex 27 and IDX30. According to that the bestdata of stock was chosen.After that, collecting data whatever it’s needed.It is about data of stock price that enter leadingstock selection, data combining of stock priceindex (IHSG), data rate of Bank Indonesiacertificate (SBI) from January 2nd 2014 toDecember 30th 2016.If some data achieved then analysis the datawith each index in order to create optimalportfolio. Formation of optimal portfolio isutilized by constant correlation model (CCM).In CCM there are three procedures must be doneto create optimal portfolio. They are namely bycalculate of Excess Return to StandardDeviation (ERS), calculate of stock rank,determine constant correlation among stockswith determining cut off rate (C*), thencalculate optimal weight through stock.ERS is advantage of relative return into one unitrisk which is can’t be diversification measuredwith deviation standard. ERS ratio showsrelationship among two factors who defineinvestment (they are return and risk). Stockswill be ranked from higher value to lower. Stockwhich has ERS value negative will be out fromcandidate.Optimal portfolio will be filled by stock whichhas ERS value is good. Stock that has ERS ratiosmall then it will become optimal portfolio. Cutoff rate was needed to determine limit of ERShigh value. For determining cut off rate, it willInternational Journal of Research in Humanities and Social Studies V5 I8 201851
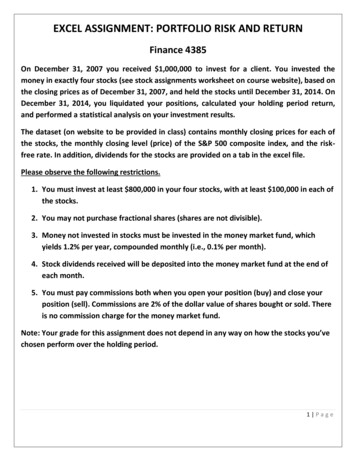
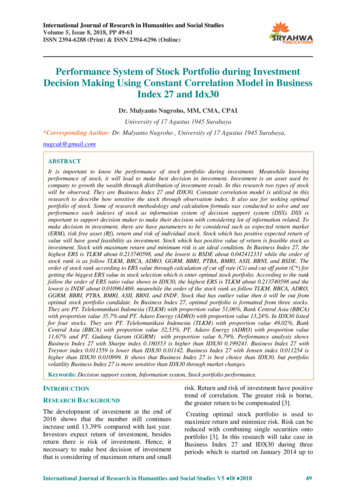
Performance System of Stock Portfolio during Investment Decision Making Using Constant CorrelationModel in Business Index 27 and Idx30be calculating with Ci. Cut off rate (C*) is Ciwhich is the last ERS value more bigger than Ci.If ERS C* then stock will be defined asoptimal portfolio Another next step is analysisperformance from each portfolio index that hadbeen created with Sharpe, Treynor, and Jensenmethod. After we know each performance thenit was needed to do comparison of portfolioperformance in Business Index 27 and IDX30.Conclusion will be made after found optimalportolio.Figure1. Conceptual FrameworkPopulation and SamplePopulation is a collection of individual that hasquality and character which has been set.According to quality and character (parameter),it is able to understand as individual orobservation’s object at least has one the sameparameter. In this research, population wasdefined as the whole stock which listed in BEIand had been classified into two groups. Theyare Business Index 27 that consists of 27eminent, and IDX30 that consists of 30 eminent,for three years during 2014-2016. Every yeareach group will be changed suddenly. In thisresearch, sample is total population that hadbeen selected based on chosen sample criteriacontinuously enter Business Index 27 andIDX30 over observation period for three years(2014-2016). From that selection of stock, theresult is 21 eminent from Business Index 27 and18 eminent from IDX30 index continuouslybecome member of each stock index. They arebecome researched into sample and qualified asleading stock.Table1.Population and BFLPKRMNCNName of IssuersAstra Agro LestariAdaro EnergyAstra InternationalBank Central AsiaBank Negara IndonesiaBank Rakyat IndonesiaBank MandiriBumi Serpong DamaiGlobal MediacomCharoen Phokphand Ind.Gudang GaramIndocement Tunggal PKalbe FarmaLippo KarawaciMedia Nusantara CitraKind of harmacyPropertyMediaBusiness 27vvvvvvvvvvvvvvvIDX 30vvvvvvvvvvvvInternational Journal of Research in Humanities and Social Studies V5 I8 2018
Performance System of Stock Portfolio during Investment Decision Making Using Constant CorrelationModel in Business Index 27 and Idx3016.17.18.PGASPTBASCMAPerusahaan Gas NegaraTambang Batubara Bukit AsamSurya Citra MediaEnergyMiningMediavvvSubject and Period of ResearchCalculate expected return each stockResearch’s subject including stock that had beenlisted on BEI. Subject also listed as stockBusiness Index 27 and iDX30 for three yearsfrom January 2014 to December 2016.E(𝑅𝑖 ) Data Analysis for Creating Optimal StockPortfolioData analysis for determining optimal stockportfolio has been done by using constantcorrelation model. Meanwhile the calculationwas done by program Excel. Here, data analysisexplained as below: Chose stock that will be filled on portfoliolisted. In this step, some samples has chosenthrough some stock samples based onBusiness index 27 and IDX30 to be includedfor conducting optimal stock portfolio. Thesteps are following below: list of stock to be included in IDX30index for 2014-2016 period Listed stocks to be included in Businessindex 27 for 2014-2016 From all stock that included on Businessindex 27 and IDX 30, stock will beselected. The criteria for selection are allstock enter both indexes in series. Conduct optimal portfolio with constantcorrelation model. Steps follow as below: Determine price stock and description ofIHSG and SBI Calculate expected return, variance,deviation standard from individualstandard of IHSG and SBI.𝑅𝑖 𝑃𝑡 𝑃𝑡 1𝑃𝑡 1 . (1)Calculate realization of return each stockNotation: R i stock return-iP t price stock period-tP (t-1) price stock period t-1Return calculation each stocks above use datastock price monthly, closing price at the end ofmonth for research period. Stock return above istotal return because calculating the differencesbetween stock price and dividend.𝑅𝑖 .(2)𝑁Notation: E(Ri) expected stock return-iN total analysis unitExpected return commonly using based onhistorical data with arithmetic mean, that is sumof Ri during analysis period divided into sum ofperiod. Optimal portfolio was created wheneverE(Ri) 0 It will be used for next step. ThoughE(Ri) 0 it will be ignored because theassumption is investor will be take rationalaction without chose disadvantage stock.Calculate market return and expected marketreturn𝐼𝐻𝑆𝐺𝑡 𝐼𝐻𝑆𝐺 𝑡 1𝐼𝐻𝑆𝐺 𝑡 1𝑅𝑚 . .(3)Expected market return calculated with IHSGfrom BEI which is taken with close price inevery the end of month during research period(January 2014 to December 2016). It commonlyuse arithmetic mean which refers to total marketreturn during analysis year divided into sum ofN analysis unit (monthly).E(𝑅𝑚 𝑅𝑚𝑁 . (4)Notation: Rm rate of market return monthlyIHSG IHSG period-tIHSGt-1 IHSG period t-1E(Rm) expected market returnN total of analysis unitCalculate risk free return (𝑅𝑓 )Risk free return usually tends to interest rateBank Indonesia certificate (SBI) monthly duringanalysis period. SBI is considered as assetsreturn with free risk because it is an investmentinstrument short term and has guarantee forbuying price on it (Bank Indonesia). Rf valuewill be conducted from average of interest rateof SBI in analysis period.1. Calculate correlation coefficient, deviationstandard, and error standard, individualstock.2. Calculate excess to return standard (ERS)individual stock.International Journal of Research in Humanities and Social Studies V5 I8 201853
Performance System of Stock Portfolio during Investment Decision Making Using Constant CorrelationModel in Business Index 27 and Idx30 .(8) (5) (9)Notation:ERS excess return to deviationstandardNotation:Xi proportion each stock-i who was chosenRi expected return stock-iZi relative investment each stockRf risk free return i deviation standard for stock-iData Analysis of Stock Portfolio Return andRisk3. ERS value will be calculated from sortingmaximum to minimum value.4. Calculate cut off rate (Ci) .(6)Data analysis for calculating level of return andrisk optimal stock portfolio which has beenformatted as below.Calculate return rate optimal stock portfolioBusiness Index 27 and IDX30. Expected returnportfolio was calculated with equation as below.Whereas: .(10) (7)Notation: correlation coefficient (constant)Ci Covarian stock-1Rf risk freeRj return stock-j j deviation standard of stock-jValue of Xi is proportion of fund which hasinvested in portfolio was calculated duringoptimal portfolio formation. Even though, ERias expected return individual stock wascalculated during optimal portfolio formation.Calculate risk optimal stock portfolio BusinessIndex 27 and IDX30. Risk of portfolio wascalculated with equation below.Determine C*C* means that the last ERS value still is greateror equal than Ci. The purpose of calculating C*is in order to make difference stock which willin and out from optimal portfolio. This actionwill take place from observation all value of Ciand ERS value each stock. If ERS value isgreater and equal than Ci, then stock will enteroptimal portfolio area, and vice versa (EltonGruber, 2003). Cut off point (C*) is the lastvalue of ERS that is greater than Ci.Determining candidate of optimal stockE(Ri) - Rf/σiportfolio area C*: inside optimal stockE(Ri) - Rf/σi C*portfolio area: outside optimal stockCandidate stock was conducted from ERSwhich is has great value or equal with ERS inC8 point.Calculate proportion of fund which is investedin optimal portfolio54 .(11)Notation:σP2 portfolio varianceσij covariance between i and jσi stock covariance i (i 1,2.i j)Xi proportion of fund securietas iXj proportion of fund securietas jPerformance Analysis of Optimal StockPortfolio InvestmentFor knowing performance of optimal stockportfolio, then it was done by optimal stockportfolio performance analysis with steps below.Investment performance measurement ofoptimal portfolio with Sharpe (Reward tovariability/RVAR) is like equation below.𝑆𝑝𝑖 𝐸𝑅𝑝𝑖 𝐸𝑅𝑓𝑆𝐷𝑝𝑖 .(12)Notation: Spi sharpe portfolio indexInternational Journal of Research in Humanities and Social Studies V5 I8 2018
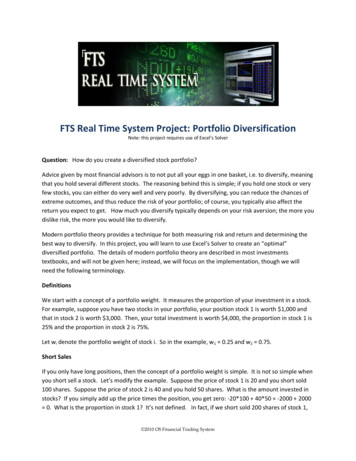
Performance System of Stock Portfolio during Investment Decision Making Using Constant CorrelationModel in Business Index 27 and Idx30ERpi average return portfolioERf average return free riskSDpi deviation standard portfolioBasically index formula was utilized tocalculate trend of slope that connectedportfolio with risk. This is stated as (ERpi –ERf) / SDpi. Hence, the biggest slope, thegreater Sharpe index. This is able to concludethat portfolio performance is good (Halim,2015).Calculate optimal stock portfolio investmentperformance in Business Index 27 and IDX30with Jensen index. Calculate Jensen index asbelow.Return market (Rm) and expected return market(ERm) was needed for raw material to formatoptimal portfolio with constant correlationmodel and assess stock performance. Then, weresume it on recapitulation stock pricecombining index (IHSG) as closing at January2014 to December 2016. From data calculatingduring research, it got result expected return ofmarket (ERm) about 0.005746 with deviationstandard (σ) is 0.033507 and variance (σ2) about0.001123.Risk Free Asset (Rf)ERpi return rate portfolioRisk free asset is an assumption from interestrate Bank Indonesia Certificate (SBI), forknowing the value of risk free asset (Rf). It canbe gotten from interest rate of SBI. In thisresearch, it can be calculated. The average ofrisk free asset (Rf) is about 0.00573 or 0.573 per month.ERm return rate marketReturn and Risk of Individual StockERf return free riskLevel of individual stock return is determinedby the changes of closing each stock everymonth. After that, stock return value will beused for calculate expected return and individualstock of risk. From table above shows BusinessIndex 27 has positive return. Here are the resultADRO, TLKM, PTBA, GGRM, BBCA, BBRI,BMRI, BBNI, ASII, BSDE,SCMA, KLBF,MNCN. Meanwhile Business Index 27 hasnegative return value are CPIN, AALI, LPKR,INTP, PGAS, SMGR, UNTR, BMTR. Stock whichJpi (ERpi–ERf) – (ERm–ERf)βpiNotation:Jpiβpi .(13) Jensen index portfolio coefficient Beta portfolioRESULT AND DISCUSSIONSample was chosen from stock which has goodand stable performance. Indicator was used toselect this stock and noted continuously inBusiness Index 27 and IDX30 during threeperiods for 2014-2016. 21 Stocks were chosenfrom Business Index 27, they are AALI, ADRO,ASSI, BBCA, BBNI, BBRI, BMRI, BSDE,BMTR, CPIN, GGRM, INTP, KLBF, LPKR,MNCN, PGAS, PTBA, SCMA, SMGR, TLKM,and UNTR. 18 stocks were selected fromIDX30 consistently had noted in both index.They are ADRO, ASSI, BBCA, BBNI, BBRI,BMRI, CPIN, GGRM, ICBP, INDFINTP,KLBF, LPKR, MNCN, SMGR, TLKM, UNTR,and UNVR.Expected Return Market(ERM)Creating Optimal Stock Portfoliohas positive expected return of value will have goodfeasibility as investment.IDX30 stocks have positive return of value. Here arebased on return ranking, ADRO, TLKM, GGRM,BBCA, BBRI, BMRI, UNVR, BBNI, ASII, INDF,KLBF, MNCN, ICBP. Meanwhile IDX30 hasnegative value are CPIN, LPKR, INTP, SMGR,UNTR. Stock which has positive value of return isfeasible stock as investment. Rank of stock accordingto ERS ratio in Business Index 27 shows at tablebelow.Excess Return to Deviation Standard (ERS) Stock Index IDX30Table2. Rank of Business Index 27 according to ERS ValueNoEmitenE(Ri)E(Ri) - 111960,0670530,0757480,136268E(Ri) - Rf/σi( ,0914847420,088141746International Journal of Research in Humanities and Social Studies V5 I8 2018Rank12345655
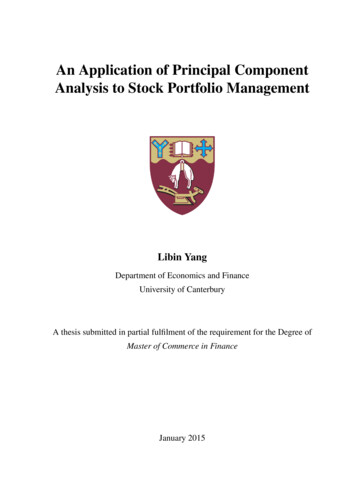
Performance System of Stock Portfolio during Investment Decision Making Using Constant CorrelationModel in Business Index 27 and 76-0,0135-0,01587-0,02283From table of ranking above shows the rank ofERS ratio value. In that table the highest ERS isTLKM about 0.213740598, and the lowest isBSDE about 0.042412331 while the order ofstock rank is as follow TLKM, BBCA, ADRO,GGRM, BBRI, PTBA, BMRI, ASII, BBNI, andBSDE. The order of stock rank according toERS value through calculation of cut off rate(Ci) and cut off point (C*) for getting thebiggest ERS value in stock selection which isenter optimal stock portfolio. The rank ofIDX30 according to ERS value shows as 130031789101112131415161718192021The next step is calculate cut off rate (Ci) thatwill be calculated with constant correlationvalue whereas before calculating Ci at first, itmust be figure out constant correlationcoefficient ( 𝜌 ). After constant correlationcoefficient was found then calculating Ci. Thiscalculation is needed as basic fundamental ofdetermining cut off point (C*) which will beconstraint of stock that will enter optimal stockportfolio. By entering data that has beencompleted in previous step, then it will get resultfor calculating Ci value from each index asfollow.Calculate Cut off Rate (Ci) and DetermineCut off Point (C*)Table3.Rank of IDX30 Based on ERSNo.EmitenE(Ri)E(Ri) - 0750540,0655150,082664According to the rank follow the order of ERSratio value shows the highest ERS is TLKM56E(Ri) - Rf/σi( 276130031Rank123456789101112131415161718about 0.213740598 and the lowest is INDFabout 0.010961469, meanwhile the order of theInternational Journal of Research in Humanities and Social Studies V5 I8 2018
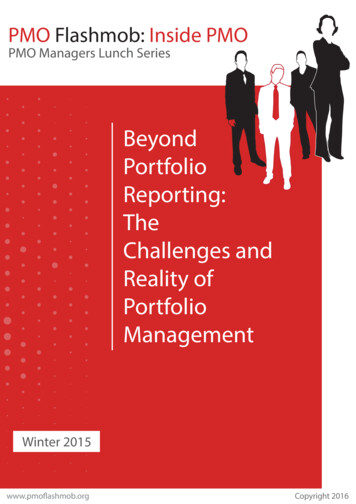
Performance System of Stock Portfolio during Investment Decision Making Using Constant CorrelationModel in Business Index 27 and Idx30stock rank as follow TLKM, BBCA, ADRO,GGRM, BBRI, PTBA, BMRI, ASII, BBNI, andINDF. Stock that has outlier value then it will beout from optimal stock portfolio candidate. Thisis able to cause Business Index 27 is just 10stocks number who has positive ERS ratio, assame as IDX30. This rank is needed forcalculate cut off rate (Ci).Table 4.Table of Ci value in Business Index 740,0560044910,042452435ρ/(1 - ρ 1689 E(Rj)- Rf/ erOutOutOutOutOutOutOutTable 5.Table of Ci in IDX30 42740,0560044910,011005042ρ/(1 - ρ 460,083185971The next step is determining value of cut offpoint (C*) whereas cut of point is defined a
comparison of stock portfolio shows that JII Syariah stock has rate of return portfolio on 0.01831 (or 1.831%) higher than IDX30 conventional stock of 0.01594 (or 1.594%). Meanwhile the rate of risk portfolio JII Syariah stocks is 0.00599 (or 0.599%) lower than the conventional stock IDX30 on 0.00849 (or 0.849%). The performance of the stock .