Transcription
FTS Real Time System Project: Portfolio DiversificationNote: this project requires use of Excel’s SolverQuestion: How do you create a diversified stock portfolio?Advice given by most financial advisors is to not put all your eggs in one basket, i.e. to diversify, meaningthat you hold several different stocks. The reasoning behind this is simple; if you hold one stock or veryfew stocks, you can either do very well and very poorly. By diversifying, you can reduce the chances ofextreme outcomes, and thus reduce the risk of your portfolio; of course, you typically also affect thereturn you expect to get. How much you diversify typically depends on your risk aversion; the more youdislike risk, the more you would like to diversify.Modern portfolio theory provides a technique for both measuring risk and return and determining thebest way to diversify. In this project, you will learn to use Excel’s Solver to create an “optimal”diversified portfolio. The details of modern portfolio theory are described in most investmentstextbooks, and will not be given here; instead, we will focus on the implementation, though we willneed the following terminology.DefinitionsWe start with a concept of a portfolio weight. It measures the proportion of your investment in a stock.For example, suppose you have two stocks in your portfolio, your position stock 1 is worth 1,000 andthat in stock 2 is worth 3,000. Then, your total investment is worth 4,000, the proportion in stock 1 is25% and the proportion in stock 2 is 75%.Let wi denote the portfolio weight of stock i. So in the example, w1 0.25 and w2 0.75.Short SalesIf you only have long positions, then the concept of a portfolio weight is simple. It is not so simple whenyou short sell a stock. Let’s modify the example. Suppose the price of stock 1 is 20 and you short sold100 shares. Suppose the price of stock 2 is 40 and you hold 50 shares. What is the amount invested instocks? If you simply add up the price times the position, you get zero: -20*100 40*50 -2000 2000 0. What is the proportion in stock 1? It’s not defined. In fact, if we short sold 200 shares of stock 1, 2010 OS Financial Trading System
the value calculated in this way would be -20*200 40*50 -2000. If we simply divided, we would get anegative weight on stock 2 and a positive weight on stock 1.The margin requirements for short sales complicate the picture a little bit more. When you short sellstock 1, the proceeds from the sale, 2000 in our example, are held in an account and you have to putup 50% of that as a deposit. So in this case, your position is:Stock 1: -100 shares, each share worth 20, and 2000 1000 held in your account.Stock 2: 50 shares, each worth 40If you closed out your positions (so covered the short sale of stock 1 and sold stock 2), you would get 3000 back as follows: when you cover the short sale of stock 1, it costs 2,000 to buy back the shares.You had 3,000 in your account, so you get back 1,000. And you get 2,000 from the sale of stock 2.Looking at it from the point of view, the dollar amount in your stock portfolio is 3,000, made up of 1,000 being the value of the position in stock 1 and 2,000 being the value of the position in stock 2.On this basis, the portfolio weights are 33% and 67%. These weights are sometimes called “adjustedweights.”Practical note: The dollar amount you would get if you closed out your position is sometimes called the“Net Liquidation Value” in brokerage accounts.Note that when we take the short sale deposits etc. into account, the position value will always bepositive and so the weight calculated on this basis will always be well defined. But the weight isunintuitive: we have short sold stock 1 but its weight is a positive number!So we have a dilemma: if we report weights in a “natural” way, they may be undefined and unintuitive;if we define them taking after properly taking into account the short sale account, they are well definedbut are unintuitive for short positions.To resolve this, the FTS Real Time Client reports two weights: the weight is what takes into account theshort sale (and margin) accounts properly; the value is calculated on the basis of what you would getback if you covered your position. The raw weight is calculated without taking this into account; thismay not always be defined as we saw, but when the raw market value (summing up the prices times thepositions) is positive, it is much more intuitive.In the Index model analytics, you will see both the weights and raw weights, and performance measurescalculated with both the (adjusted) weights and raw weights. Others, like the Long-Short Analysis, onlyreport the raw weights because in that context, the long and short positions are separated out and theraw weights are more natural.Constructing a diversified portfolioLet E(ri) denote the expected return from stock i. This is usually measured annually, so E(r i) 10% meansyou expect the stock to return 10% over the year. There are many ways to estimate the expected return; 2010 OS Financial Trading System
stock analysts use techniques involving historical data, fundamental analysis, and scenario analysis.Values based on the CAPM are provided by the FTS Real Time Client, though you can override them viathe “Parameters” menu item. Given the portfolio weights, the expected return of the portfolio is:Finally, we need to describe risk. Modern portfolio theory uses the standard deviation of returns (alsocalled volatility) as a measure of risk (or equivalently, the variance). To calculate the risk of a portfolio,you also need the covariances between stock returns. In notation, let ij denote the covariancebetween the returns of stocks i and j, so ii is the variance of the return of stock i. Then, given theportfolio weights, the variance of the portfolio return is:The volatility is the square root of this number.The FTS Real Time Client calculates all the covariances for you. The portfolio selection problem is to findweights that minimize the variance subject to some constraints. The first is that the sum of the weightsequals 1; this simply means that you invest all the money you have allocated to stocks. The second isthat the expected return from the portfolio equals your desired return. Beyond that, you can imposemore conditions. For example, you may restrict short selling, either completely, which says wi 0. Oryou may require that you will not invest more some amount in any one stock; this says wi 0.1.Common constraints for this case, which has 30 stocks, would be that you do not invest more than 15%in any one stock, and if there is no short selling, that you invest at least 2% in every stock. ProjectThe objective of this project is to learn to apply modern portfolio theory by constructing portfolios,implementing the recommended portfolio, and tracking its performance over time. This is done bycompleting the following steps, and includes learning how to use Solver to calculate the portfolioweights.1.From the RT Client, select “Covariances and Returns” in the Analytics area (at the bottom right);you will see your (raw) portfolio weights and the expected returns and covariances of all thestocks. In the Edit menu of the Analytics area, select “Export to Excel.” This will transfer thedata into an Excel spreadsheet. You have two choices with the covariances and returns. If you select “Covariances andReturns,” it shows you either the default expected return or the value you enteredunder Parameters. If you select “Covariances and Returns (CAPM)” it shows you theexpected return based on CAPM.2. Decide on a target expected return. This could be a number you pick, e.g. 7%, or you could beguided by the past return of an index such as the S&P500, or the yield on Treasury bonds. 2010 OS Financial Trading System
3. Choose what constraints you want to impose. You may want to consult your investments text(e.g. the chapter on Optimal Risk Portfolios in the text by Bodie, Kane, and Marcus) forsuggestions. One constraint you could impose is a limit on the maximum amount in any one stock,for example, that -0.2 wi 0.2 which says that you will not invest more than 20% inany one stock and that any short position will not be more than 20% of the amountinvested.4. In your spreadsheet, implement the formulas for calculating the portfolio’s expected return andvariance. You may want to use the SUMPRODUCT function in Excel as well as its matrixmultiplication functions.5. Run Solver, define the objective (which is to minimize the variance) and the constraints (the twobasic constraints plus additional constraints you chose), and calculate the portfolio weights.Note that if your constraints are unreasonable, there may not be a solution. Note: you may want to conduct this exercise with 5 or 10 stocks only6. Implement your trading strategy using the Real Time FTS Client. This means that you have totake the weights and using current prices, calculate the number of shares of each stock to buy(or sell). Caution: if you allow short sales, be careful about the total amount of money you willneed to finance the short sale. If you solve for raw weights in the spreadsheet, then youare implicitly assuming that the proceeds of the short sale can be used to buy otherstocks. When you implement the trade, you will not get the proceeds; in fact you willhave to put up a 50% as well. So the amount you have to buy stocks will be less thanyou think, and you will run out of money! The Equity Portfolio Rebalancer built in to the Windows version of the FTS Real TimeClient calculates the costs of rebalancing, the cash required to implement the trades,and can also execute the trades for you.7. Wait a week. At that point, your actual portfolio weights will have changed because stock priceswill have changed. You now have to decide whether you want to “rebalance” your position.This means buying or selling to get back to the weights you had originally calculated. Or youmay want to repeat steps 1-6 again since some of the return and covariance estimates may havechanged. Note that the decision to rebalance is not that simple, since buying and selling stockswill incur a transaction cost; so if your weights are not too far from where they should be, youmay want to wait to rebalance. The Equity Portfolio Rebalancer lets you determine the costs of rebalancing.8. After a few weeks, answer the following questions: What was the risk and return of yourportfolio over the time horizon? Did it conform to what was expected? Did you have torebalance frequently? You should calculate the realized return, the volatility of your returns,and the Sharpe ratio for your portfolio, and compare these to the S&P 500. 2010 OS Financial Trading System
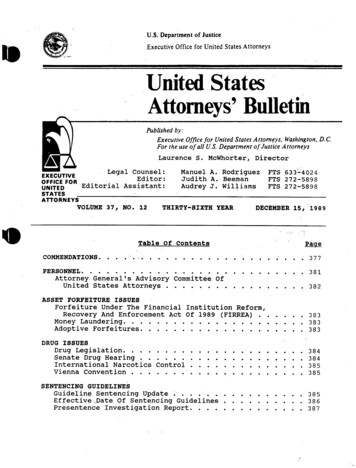
Example with the FTS 30 Stock CaseWe show you here a detailed example with the FTS 30 Stock case. We will allow short sales toshow you how to adjust your spreadsheet appropriately.First, select “Covariances and Returns” from the analytics area:From the Edit menu circled above, select “Export to Excel” to get the data in a spreadsheet: 2010 OS Financial Trading System
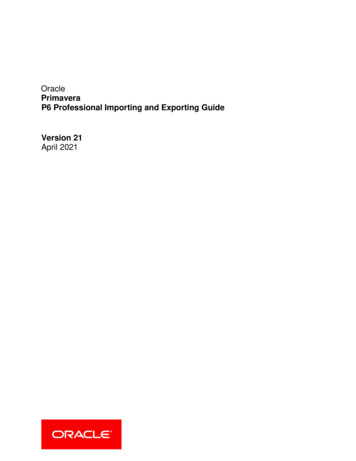
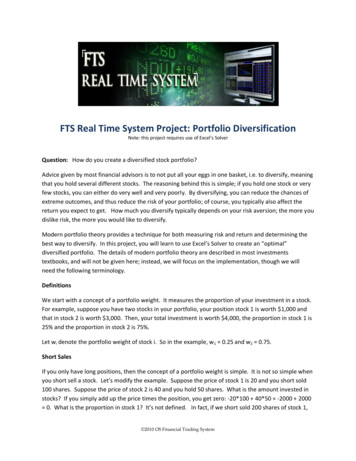
The stocks are in rows 7 to 36, the expected returns are in column C and the covariance matrix isin D7:AG36. The weights shown don’t matter; we will be calculating new weights.The first thing we have to do is replace cells B2, B3 and B5 with formulas.B5 is the sum of the weights; this has to be 1, so enter the formula: SUM(B7:B36) 2010 OS Financial Trading System
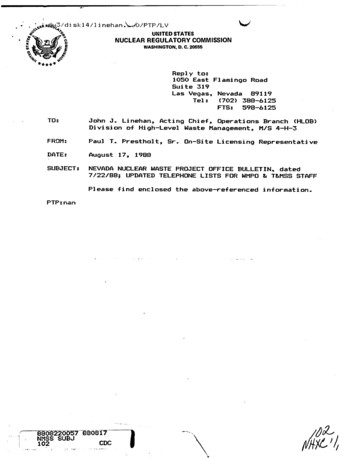
B2 is the portfolio expected return;, so enter the formula SUMPRODUCT(B7:B36,C7:C36)B3 is the portfolio variance; this formula is SUMPRODUCT(B7:B36,MMULT(D7:AG36,B7:B36)) ,which is the Excel implementation of the double-summation formula for the portfolio variance.Finally, replace D3 with the formula SQRT(B3) so the portfolio volatility is calculated correctly.What we have done so far is replace the values copied from the FTS Real Time Client intoformulas where the values are calculated as a function of the portfolio weights.When we use Solver to find the portfolio weights, we will be asking it to find the lowest varianceportfolio that matches our target return. The target return is in cell B4; initially, it is simply theexpected benchmark return, which in the FTS 30 Stock Case is the S&P500 index. You canchange that to a higher number if you want to try and beat the benchmark; we changed it to0.09 for this example.Now, we have to think about constraints on the problem. The first constraint is that the sum ofthe weights is 1: B5 1. The second constraint is that the portfolio expected return equals ourtarget return: B2 B4We could also decide to disallow short sales; that would be the constraint B7:B36 0 but wewill not impose that. Other constraints you could impose could be limits on allocations, e.g. nomore than 10% in any one stock, or no more than 20% in any sector, and so on.Enter these into Solver and click Solve’ 2010 OS Financial Trading System
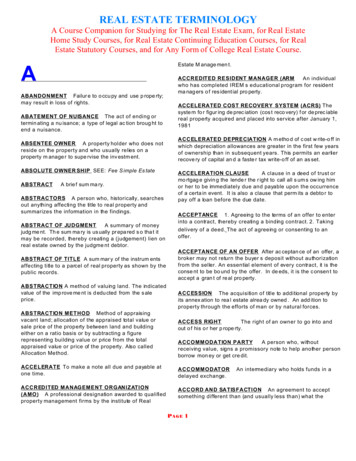
A 20% maximum and minimum on any stock would require adding the constraints B 7: B 36 0.2 and B 7: B 36 -0.2.For the base case, we obtained a solution: 2010 OS Financial Trading System
Notes: One technical problem you may face is that the covariance matrix is close to beingsingular. In this case, Solver may not be able to find a solution without One way youwill know that there is a problem is if Solver tells you that the “cell values fail toconverge.” This is more likely to happen with a large number of stocks. In that case,you will have to modify the covariance matrix in the spreadsheet to make it non-singular. The FTS Real Time Client overrides the inputs of a stock’s volatility if it is inconsistent.Technically, it increases the volatility internally to make sure that all correlations acrossstock returns are between -1 and 1. The covariance matrix that is exported to Excelcontains this adjustment. If you want to use your own numbers, you can modify themdirectly in the spreadsheet. If you want to use fewer stocks, set the weights of the other stocks to zero, and in Solver,just below it says “By Changing Cells,” enter the cells with the weights you want to useseparated by commas, e.g., B 7, B 9, B 15o Solver is more likely to find a solution with fewer stocksNow that we have the weights, we can calculate what we have to buy or sell. Suppose that youstarted off with 1m in cash. Theoretically, if you are supposed to hold wi of stock i and theprice of stock i is Pi, you would buy ni shares where ni solves: wi Pini/ 1m, so ni 1m*wi/Pi . Butwill not work in practice, for two reasons. First, you will have to pay a transactions cost for eachtrade; usually, this is fixed at 9.95 a trade; there are also limits on how many stocks you canbuy or sell at one time, so you may to make multiple transactions. Second, if you short sell, youwill have to put up money and will not be able to use the proceeds of the short sale to buy otherstocks.Note: The Equity Portfolio Rebalancer built in to the Windows version of the FTS RealTime Client lets you determine the costs of rebalancing and also can execute the tradesfor you.For example, in our solution, the recommended raw weight for Exxon Mobil is -0.0258. At thetime we did this, Exxon Mobil was trading at 61.33. So if we had 1m to start, then we want toshort 421 shares of Exxon. But this will use up 38,787 of cash.So you have to first calculate how much of your money would be used up by the short sales andkeep some aside for transactions costs. So even though you started with 1m, if the shortpositions are small, you should think about maybe investing about 900000. With large shortpositions, you will have to be more careful. 2010 OS Financial Trading System
We conclude with some comments: You will have to rebalance your portfolio periodically as prices change. You may decide to run Solver periodically and recalculate the weights; again, this can becostly so if you plan to do this, make sure you have enough resources available. To calculate the results required in Step 5 above, you will need to download yourtrading history from the Reports menu at the top: From the history window, generate the report “End of Day Market Values” and copy theselected information as shown and paste it into Excel: 2010 OS Financial Trading System
Now, you can calculate what is needed; there is also a performance report that you cangenerate automatically. 2010 OS Financial Trading System
For example, suppose you have two stocks in your portfolio, your position stock 1 is worth 1,000 and that in stock 2 is worth 3,000. Then, your total investment is worth 4,000, the proportion in stock 1 is 25% and the proportion in stock 2 is 75%. Let w i denote the portfolio weight of stock i. So in the example, w 1 0.25 and w 2 0.75 .