Transcription
User Bulletin #2ABI PRISM 7700 Sequence Detection SystemDecember 11, 1997 (updated 10/2001)SUBJECT:Relative Quantitation of Gene ExpressionIntroduction Amplification of an endogenous control may be performed to standardize the amountof sample RNA or DNA added to a reaction. For the quantitation of gene expression,researchers have used ß-actin, glyceraldehyde-3-phosphate dehydrogenase(GAPDH), ribosomal RNA (rRNA), or other RNAs as this endogenous control.Relative quantitation with data from the ABI PRISM 7700 Sequence Detection System(using version 1.6 software) can be performed using the standard curve method or thecomparative method.The availability of distinguishable reporter dyes for the ABI PRISM 7700 SequenceDetection System makes it possible to amplify and detect the target amplicon and theendogenous control amplicon in the same tube (multiplex polymerase chain reaction[PCR]).Contents This user bulletin describes the following: How to use data from amplifications run in separate tubes to illustrate relativequantitation of a target message normalized with an endogenous control. Thebasic mechanics and mathematics of relative quantitation are presented. How the target and endogenous controls can be amplified in the same tube andcompared with results of the separate-tube method.TopicSee pageRelative Quantitation of Gene Expression1Standard Curve Method (Separate Tubes)3Comparative CT Method (Separate Tubes)11Multiplex PCR (Same Tube)16Summary24Methods25cDNA Synthesis25c-myc and GAPDH Amplified in Separate Tubes27Limiting Primer Determination30c-myc and GAPDH Amplified in the Same Tube32Standard Deviation Calculation Using the Standard Curve Method34Standard Deviation Calculation Using the Comparative Method35
Terms Defined The following definitions are assumed in this description of relative quantitation.Controls/TermsDefinitionsStandardA sample of known concentration used to construct a standard curve.ReferenceA passive or active signal used to normalize experimental results.Endogenous and exogenous controls are examples of active references.Active reference means the signal is generated as the result of PCRamplification. The active reference has its own set of primers and probe. Endogenous control – This is an RNA or DNA that is present ineach experimental sample as isolated. By using an endogenouscontrol as an active reference, you can normalize quantitation of amessenger RNA (mRNA) target for differences in the amount oftotal RNA added to each reaction. Exogenous control – This is a characterized RNA or DNA spikedinto each sample at a known concentration. An exogenous activereference is usually an in vitro construct that can be used as aninternal positive control (IPC) to distinguish true target negativesfrom PCR inhibition. An exogenous reference can also be used tonormalize for differences in efficiency of sample extraction orcomplementary DNA (cDNA) synthesis by reverse transcriptase.Whether or not an active reference is used, it is important to use apassive reference containing the dye ROX in order to normalize fornon-PCR-related fluctuations in fluorescence signal.CalibratorPage 2 of 36A sample used as the basis for comparative results.User Bulletin #2: ABI PRISM 7700 Sequence Detection System
Standard Curve Method (Separate Tubes)Absolute Standard It is possible to use the ABI PRISM 7700 Sequence Detector data to obtain absoluteCurve quantitation, but it requires that the absolute quantities of the standard be known bysome independent means. Plasmid DNA or in vitro transcribed RNA are commonlyused to prepare absolute standards. Concentration is measured by A260 andconverted to the number of copies using the molecular weight of the DNA or RNA.The following critical points must be considered for the proper use of absolutestandard curves: It is important that the DNA or RNA be a single, pure species. For example,plasmid DNA prepared from E. coli often is contaminated with RNA, whichincreases the A260 measurement and inflates the copy number determined for theplasmid. Accurate pipetting is required because the standards must be diluted over severalorders of magnitude. Plasmid DNA or in vitro transcribed RNA must beconcentrated in order to measure an accurate A260 value. This concentrated DNAor RNA must then be diluted 106–1012 -fold to be at a concentration similar to thetarget in biological samples. The stability of the diluted standards must be considered, especially for RNA.Divide diluted standards into small aliquots, store at -80 C, and thaw only oncebefore use. An example of the effort required to generate trustworthy standards isprovided by Collins et al. (Anal. Biochem. 226:120-129, 1995), who report on thesteps they used in developing an absolute RNA standard for viral quantitation. It is generally not possible to use DNA as a standard for absolute quantitation ofRNA because there is no control for the efficiency of the reverse transcriptionstep.Relative Standard It is easy to prepare standard curves for relative quantitation because quantity isCurve expressed relative to some basis sample, such as the calibrator. For all experimentalsamples, target quantity is determined from the standard curve and divided by thetarget quantity of the calibrator. Thus, the calibrator becomes the 1 sample, and allother quantities are expressed as an n-fold difference relative to the calibrator. As anexample, in a study of drug effects on expression, the untreated control would be anappropriate calibrator.Because the sample quantity is divided by the calibrator quantity, the unit from thestandard curve drops out. Thus, all that is required of the standards is that theirrelative dilutions be known. For relative quantitation, this means any stock RNA orDNA containing the appropriate target can be used to prepare standards.The following critical points must be considered for the proper use of relative standardcurves: It is important that stock RNA or DNA be accurately diluted, but the units used toexpress this dilution are irrelevant. If two-fold dilutions of a total RNA preparationfrom a control cell line are used to construct a standard curve, the units could bethe dilution values 1, 0.5, 0.25, 0.125, and so on. By using the same stock RNA orDNA to prepare standard curves for multiple plates, the relative quantitiesdetermined can be compared across the plates. It is possible to use a DNA standard curve for relative quantitation of RNA. Doingthis requires the assumption that the reverse transcription efficiency of the targetUser Bulletin #2: ABI PRISM 7700 Sequence Detection SystemPage 3 of 36
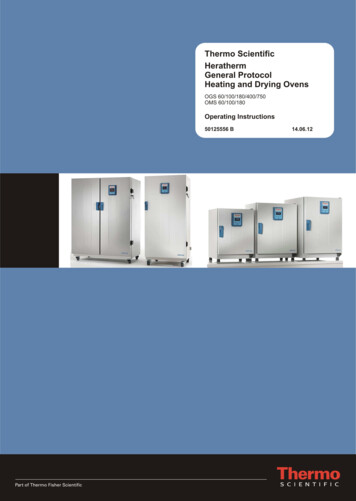
is the same in all samples, but the exact value of this efficiency need not beknown. For quantitation normalized to an endogenous control, standard curves areprepared for both the target and the endogenous reference. For eachexperimental sample, the amount of target and endogenous reference isdetermined from the appropriate standard curve. Then, the target amount isdivided by the endogenous reference amount to obtain a normalized target value.Again, one of the experimental samples is the calibrator, or 1 sample. Each ofthe normalized target values is divided by the calibrator normalized target value togenerate the relative expression levels.Relative Standard To illustrate the use of standard curves for relative quantitation, the following exampleCurve Example is used: the target is human c-myc mRNA and the endogenous control is humanGAPDH mRNA. See the “Methods” section on page 25 for details. Specificinstructions for using the standard curve method are in “Constructing a RelativeStandard Curve” on page 7.Plate SetupFigure 1 shows the plate setup for the relative quantitation of the c-myc mRNA wherethe target and endogenous reference are amplified in separate tubes. Rows A–Dcontain c-myc-specific primers and a FAM-labeled c-myc probe. Figure 2 on page 5shows the plate setup for GAPDH mRNA. Rows E–H contain GAPDH-specific primersand a JOE-labeled probe (TaqMan GAPDH Control Reagents, P/N 402869).Dilutions of a cDNA sample prepared from Raji total RNA are used to constructstandard curves for the c-myc and the GAPDH amplifications. The unknown samplesare cDNA prepared from total RNA isolated from human brain, kidney, liver, and lung.Figure 1. Plate setup for relative quantitation of the c-myc mRNA on FAM layerPage 4 of 36User Bulletin #2: ABI PRISM 7700 Sequence Detection System
Figure 2. Plate setup for GAPDH mRNASetting ThresholdsAfter performing the PCR, choose separate thresholds on the FAM and JOE layers(Figures 3 and 4 on page 6) by performing the following steps.StepAction1Select Analyze from the Analysis menu.2Examine the semi-log view of the amplification plots.3Adjust the default baseline setting to accommodate the earliest amplification plot.4Select a threshold above the noise close to the baseline but still in the linear regionof the semi-log plot. Click and drag the threshold line to set the threshold.User Bulletin #2: ABI PRISM 7700 Sequence Detection SystemPage 5 of 36
Figure 3. Set the threshold on the FAM layer by examining the semi-log view of theamplification plot. Note that the baseline setting has been adjusted to stop at cycle 22.Figure 4. Set the threshold on the JOE layer by examining the semi-log view of theamplification plot. Note that the baseline setting has been adjusted to stop at cycle 16.Page 6 of 36User Bulletin #2: ABI PRISM 7700 Sequence Detection System
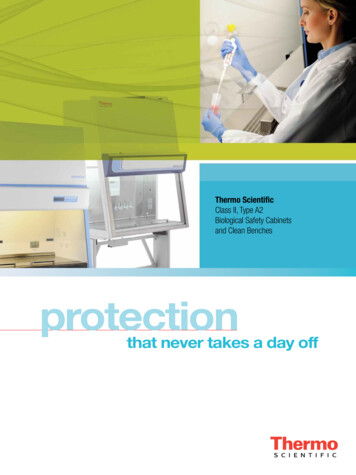
Constructing a Relative Standard CurveThe ABI PRISM 7700 Sequence Detection System (version 1.6 software) is notdesigned to construct two standard curves on the same plate. To analyze thisexperiment, Results are exported to an Excel spreadsheet by choosing the Exportoption in the File menu. The exported file contains columns with the sample wellnumber, sample description, standard deviation of the baseline, Rn, and CT. The FAMinformation is reported first with the JOE information in the rows under the FAM data.The important parameter for quantitation is the CT.Set up three columns as shown below listing the input amount for the standard curvesamples, the log of this input amount, and the CT value.Perform the following steps in Excel to construct a standard curve from your data.StepAction1Select the log input and CT data as shown below.2Using the Excel Chart Wizard, draw an XY (scatter) plot on the work sheet with thelog input amount as the X values and CT as the Y values.NoteThe plotted graph shows the data points in a graphical view.3Click one of the data points that appears in graphical view to select it.4Open the Insert menu and select Trendline to plot a line through the data point.5Go to the Type page and select Linear regression.6Go to the Options page and select the boxes for Display Equation on Chart andDisplay R-squared Value on Chart.7Compare your chart to Figure 5 on page 8.User Bulletin #2: ABI PRISM 7700 Sequence Detection SystemPage 7 of 36
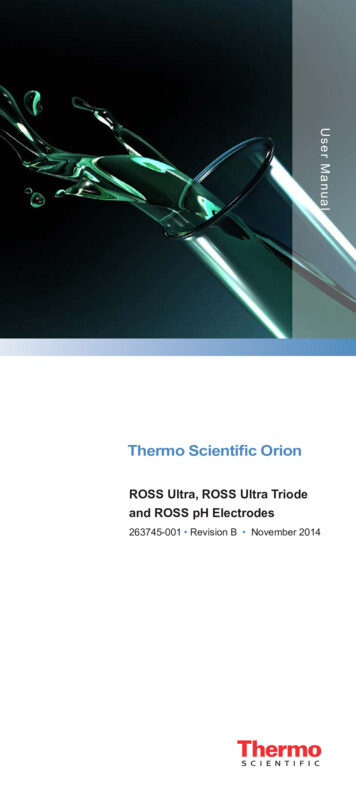
Figure 5. The standard curve for the amplification of the c-myc target detected using aFAM-labeled probe.Calculating the Input AmountPerform the following steps to calculate the input amount for unknown samples.Step1ActionFor the line shown in Figure 5, calculate the log input amount by entering thefollowing formula in one cell of the work sheet: ([cell containing CT value] –b)/mb y-intercept of standard curve linem slope of standard curve lineNote2In Figure 5, b 25.712 and m -3.385 for the equation y mx b.Calculate the input amount by entering the following formula in an adjacent cell: 10 [cell containing log input amount]NoteThe units of the calculated amount are the same as the units used toconstruct the standard curve, which are nanograms of Total Raji RNA. If it iscalculated that an unknown has 0.23 ng of Total Raji RNA, then the samplecontains the same amount of c-myc mRNA found in 0.23 ng of the Raji ControlRNA.Page 8 of 363Repeat the steps to construct a standard curve for the endogenous reference usingthe CT values determined with the JOE-labeled GAPDH probe. Refer to Table 1 onpage 10.4Because c-myc and GAPDH are amplified in separate tubes, average the c-mycand GAPDH values separately.5Divide the amount of c-myc by the amount of GAPDH to determine the normalizedamount of c-myc (c-mycN).User Bulletin #2: ABI PRISM 7700 Sequence Detection System
Comparing Samples with a CalibratorThe normalized amount of target (c-mycN) is a unitless number that can be used tocompare the relative amount of target in different samples. One way to make thiscomparison is to designate one of the samples as a calibrator. In Table 1 on page 10,brain is designated as the calibrator; brain is arbitrarily chosen because it has thelowest expression level of the target.Relative Standard Curve ResultsEach c-mycN value in Table 1 is divided by the brain c-mycN value to give the values inthe final column. These results indicate the kidney sample contains 5.5 as muchc-myc mRNA as the brain sample, liver 34.2 as much, and lung 15.7 as much.Perform the following steps to determine relative values.StepAction1Average the c-myc and GAPDH values from Table 1.2Divide the c-myc average by the GAPDH average.3Designate the calibrator.4Divide the averaged sample value by the averaged calibrator value.User Bulletin #2: ABI PRISM 7700 Sequence Detection SystemPage 9 of 36
Table 1. Amounts of c-myc and GAPDH in Human Brain, Kidney, Liver, and gAveragec-mycng Total Raji RNAGAPDHng Total Raji 0400.520.039 0.0040.54 .960.41 0.0161.02 .270.70 0.0360.28 .800.93 0.0440.81 0.041c-mycNNorm. to GAPDHac-mycNRel. to Brainb0.07 0.0081.0 0.120.40 0.0255.5 0.352.49 0.17334.2 2.371.15 0.07915.7 1.09a. The c-mycN value is determined by dividing the average c-myc value by the average GAPDH value. Thestandard deviation of the quotient is calculated from the standard deviations of the c-myc and GAPDH values.See “Standard Deviation Calculation Using the Standard Curve Method” on page 34.b. The calculation of c-mycN relative to brain involves division by the calibrator value. This is division by anarbitrary constant, so the cv of this result is the same as the cv for c-mycN.Page 10 of 36User Bulletin #2: ABI PRISM 7700 Sequence Detection System
Comparative CT Method (Separate Tubes)Similar to Standard The comparative CT method is similar to the standard curve method, except it usesCurve Method arithmetic formulas to achieve the same result for relative quantitation.NoteIt is possible to eliminate the use of standard curves for relative quantitation as long asa validation experiment is performed. See “Validation Experiment” on page 14.Arithmetic Formulas The amount of target, normalized to an endogenous reference and relative to acalibrator, is given by:2 – CTDerivation of the FormulaThe equation that describes the exponential amplification of PCR is:Xn Xo ( 1 EX ) nwhere:Xn number of target molecules at cycle nXo initial number of target moleculesEX efficiency of target amplificationn number of cyclesThe threshold cycle (CT) indicates the fractional cycle number at which the amount ofamplified target reaches a fixed threshold. Thus,X T X o ( 1 E X ) CT, X K Xwhere:XT threshold number of target moleculesCT,X threshold cycle for target amplificationKX constantUser Bulletin #2: ABI PRISM 7700 Sequence Detection SystemPage 11 of 36
A similar equation for the endogenous reference reaction is:R T R o ( 1 E R ) CT, R K Rwhere:RT threshold number of reference moleculesRo initial number of reference moleculesER efficiency of reference amplificationCT, R threshold cycle for reference amplificationKR constantDividing XT by RT gives the following expression:CX o ( 1 E X ) T, X K XXT- ------- K------- ------------------------------------------CRTR o ( 1 E R ) T, R K RThe exact values of XT and RT depend on a number of factors, including: Reporter dye used in the probe Sequence context effects on the fluorescence properties of the probe Efficiency of probe cleavage Purity of the probe Setting of the fluorescence threshold.Therefore, the constant K does not have to be equal to one.Assuming efficiencies of the target and the reference are the same:EX ER E,XoC T, X – C T, R------ ( 1 E ) KRoorXN ( 1 E ) C T Kwhere:Page 12 of 36XN Xo/Ro, the normalized amount of target CT CT,X - CT,R, the difference in threshold cycles for target and referenceUser Bulletin #2: ABI PRISM 7700 Sequence Detection System
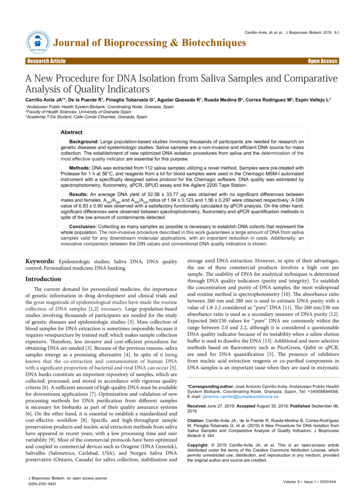
Rearranging gives the following expression:XN K ( 1 E )– C TThe final step is to divide the XN for any sample q by the XN for the calibrator (cb):– CX– C TK ( 1 E ) T, qN, q- ( 1 E )-------------- ------------------------------------------– CX N, cbK ( 1 E ) T, cbwhere: CT CT,q – CT,cbFor amplicons designed and optimized according to Applied Biosystems guidelines(amplicon size 150 bp), the efficiency is close to one. Therefore, the amount oftarget, normalized to an endogenous reference and relative to a calibrator, is given by:2 – CTRelative Efficiency of For the CT calculation to be valid, the efficiency of the target amplification and theTarget and efficiency of the reference amplification must be approximately equal. A sensitiveReference method for assessing if two amplicons have the same efficiency is to look at how CTvaries with template dilution. The standard curves for c-myc and GAPDH used in theprevious section provide the necessary data. Table 2 shows the average CT value forc-myc and GAPDH at different input amounts.Table 2. Average CT Value for c-myc and GAPDH at Different Input AmountsInput Amountng Total RNAc-mycAverage CTGAPDHAverage CT CTc-myc – GAPDH1.025.59 0.0422.64 0.032.95 0.050.526.77 0.0923.73 0.053.04 0.100.228.14 0.0525.12 0.103.02 0.110.129.18 0.1326.16 0.023.01 0.130.0530.14 0.0327.17 0.062.97 0.070.0231.44 0.1628.62 0.102.82 0.190.0132.42 0.1229.45 0.082.97 0.14Figure 6 on page 14 shows a plot of log input amount versus CT. If the efficiencies ofthe two amplicons are approximately equal, the plot of log input amount versus CThas a slope of approximately zero.User Bulletin #2: ABI PRISM 7700 Sequence Detection SystemPage 13 of 36
Validation Before using the CT method for quantitation, perform a validation experiment likeExperiment that in Figure 6 to demonstrate that efficiencies of target and reference areapproximately equal. The absolute value of the slope of log input amount vs. CTshould be 0.1. The slope in Figure 6 is 0.0492, which passes this test. Once this isproven, you can use the CT calculation for the relative quantitation of target withoutrunning standard curves on the same plate.If the efficiencies of the two systems are not equal, perform quantitation using thestandard curve method. Alternatively, new primers can be designed and synthesizedfor the less efficient system to try to boost efficiency.Figure 6. Plot of log input amount versus CTPage 14 of 36User Bulletin #2: ABI PRISM 7700 Sequence Detection System
Comparative CT The CT data used to determine the amounts of c-myc and GAPDH mRNA shown inResults Table 1 on page 10 are used to illustrate the CT calculation. Table 3 shows theaverage CT results for the human brain, kidney, liver, and lung samples and how theseCTs are manipulated to determine CT, CT, and the relative amount of c-mycmRNA. The results are comparable to the relative c-myc levels determined using thestandard curve method.Table 3.Relative Quantitation Using the Comparative CT MethodTissuec-mycAverage CTGAPDHAverage CTBrain30.49 0.1523.63 0.096.86 0.170.00 0.171.0(0.9–1.1)Kidney27.03 0.0622.66 0.084.37 0.10–2.50 0.105.6(5.3–6.0)Liver26.25 0.0724.60 0.071.65 0.10–5.21 0.1037.0(34.5–39.7)Lung25.83 0.0723.01 0.072.81 0.10–4.05 0.1016.5(15.4–17.7) CT CTc-mycN CT, Brainb Rel. to Braincc-myc–GAPDHa CT– a. The CT value is determined by subtracting the average GAPDH CT value from the average c-myc CTvalue. The standard deviation of the difference is calculated from the standard deviations of the c-myc andGAPDH values. See “Standard Deviation Calculation Using the Comparative Method” on page 35.b. The calculation of CT involves subtraction by the CT calibrator value. This is subtraction of an arbitraryconstant, so the standard deviation of CT is the same as the standard deviation of the CT value.c. The range given for c-mycN relative to brain is determined by evaluating the expression: 2 – CTwith CT s and CT – s, where s the standard deviation of the CT value.User Bulletin #2: ABI PRISM 7700 Sequence Detection SystemPage 15 of 36
Multiplex PCR (Same Tube)Overview Multiplex PCR is the use of more than one primer pair in the same tube. You can usethis method in relative quantitation where one primer pair amplifies the target andanother primer pair amplifies the endogenous reference in the same tube. You canperform a multiplex reaction for both the standard curve method and the comparativemethod.Dyes Available for The availability of multiple reporter dyes for TaqMan probes makes it possible toTaqMan Probes detect amplification of more than one target in the same tube. The reporter dyescurrently recommended for probes are 6-FAM, TET, and JOE. These dyes aredistinguishable from one another because they have different emission wavelengthmaxima: 6-FAM, λmax 518 nm TET, λmax 538 nm JOE, λmax 554 nmMulticomponenting The ABI PRISM 7700 Sequence Detection System software uses a process calledmulticomponenting to distinguish reporter dyes, the quencher dye TAMRA (λmax 582nm), and the passive reference dye ROX (λmax 610 nm). Multicomponenting is amathematical algorithm that uses pure dye reference spectra to calculate thecontribution of each dye to a complex experimental spectrum.Accurate Because of experimental variation in measuring both the reference spectra and theQuantitation sample spectra, multicomponenting introduces some error into the determination ofeach dye’s contribution. The degree of error depends on how well the various dyes arespectrally resolved. The greater the spectral overlap between two dyes, the greaterthe error. Thus, for the most accurate quantitation using two probes in one tube, usethe reporter dyes that have the largest difference in emission maximum: 6-FAM andJOE.The TaqMan GAPDH Control Reagents (P/N 402869) provide a JOE-labeled probe forhuman GAPDH mRNA. Therefore, when using GAPDH as an endogenous reference,label the probe for the target mRNA with 6-FAM.Avoiding Reactions to amplify two different segments in the same tube share commonCompetition in reagents. If the two segments have different initial copy numbers, it is possible for theReactions more abundant species to use up these common reagents, impairing amplification ofthe rarer species. For accurate quantitation, it is important that the two reactions donot compete. Competition can be avoided by limiting the concentration of primersused in the amplification reactions.Page 16 of 36User Bulletin #2: ABI PRISM 7700 Sequence Detection System
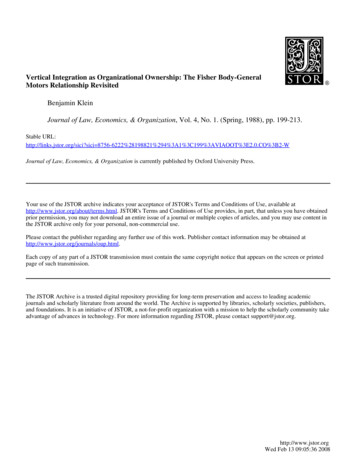
Limiting Primer Figure 7 shows PCR amplifications with decreasing concentrations of primers. AtConcept 120 and 80 nM, the amplification plots are similar, indicating that the reactions are notlimited by the amount of primers. The remaining plots show that the more dilute theprimers, the lower the plateau fluorescence level at the end of the reaction. Thisdemonstrates that a lower primer concentration limits the reaction, forcing it to plateauat a lower level of product.Figure 7. PCR amplifications with decreasing primer concentrationsIn terms of kinetic analysis, however, all the reactions except 4 nM have the same CTvalue. The strategy for performing two independent reactions in the same tube is toadjust the primer concentrations such that accurate CTs are obtained, but soon afterthat, the exhaustion of primers defines the end of the reaction. In this way,amplification of the majority species is stopped before it can limit the commonreactants available for amplification of the minority species.Considering Relative Abundance of the Target and ReferenceIn applying the limiting primer concept to target and endogenous referenceamplification, the relative abundance of the two species must be considered. Forquantitation of gene expression, it is possible to use rRNA as an endogenousreference. The concentration of rRNA in total RNA is always greater than theconcentration of any target mRNA. Therefore, in multiplex reactions amplifying bothtarget and rRNA, only the concentrations of the rRNA primers need to be limited. Forc-myc and GAPDH, it is not known if the abundance of one RNA is always greaterthan the other in the tissues and cell lines that might be examined. For amplifyingc-myc and GAPDH in the same tube, limiting primer concentrations need to bedefined for both amplicons.Defining Limiting Primer ConcentrationsDefine limiting primer concentrations by running a matrix of forward and reverseprimer concentrations. The desired concentrations are those that show a reduction in Rn but little effect on CT. Figure 8 on page 18 and Figure 9 on page 19 show theresults when GAPDH is amplified using all combinations of forward and reverseprimers at 80, 40, 30, and 20 nM.User Bulletin #2: ABI PRISM 7700 Sequence Detection SystemPage 17 of 36
Figure 8. GAPDH amplified using all combinations of forward and reverse primersThe CT results in Figure 8 show that the CT value using 30 nM each primer is thesame as 80 nM each primer. Figure 9 shows that the Rn at 30 nM each primer isreduced relative to more concentrated primers. Thus, by amplifying GAPDH with30 nM each primer, accurate CTs are obtained, but the GAPDH reaction is shut downbefore it affects amplification of a less abundant species. In order to provide a marginfor error, a concentration of 40 nM each GAPDH primer is used in the “Multiplex PCRExample” on page 19.Page 18 of 36User Bulletin #2: ABI PRISM 7700 Sequence Detection System
Figure 9. GAPDH uplifted using all combinations of forward and reverse primersA similar experiment defines 50 nM each primer as limiting primer conditions foramplification of c-myc. In these primer limitation studies, the buffer and thermalcycling conditions are the same for the two systems run in the same tube. Thisprocess is simplified by using a two-step RT-PCR protocol, because the PCR can beoptimized separately from the reverse transcriptase reaction. This allows you to useour Assay Design Guidelines for DNA amplification when they become available(currently in progress). These generate primers and probes that work well using ageneric set of buffer and thermal cycling conditions.NoteIf limiting primer concentrations cannot be found, quantitation can still be obtained byrunning the reactions in separate tubes. Alternatively, the primers can be redesigned andretested to find limiting concentrations. The primers generally need to be altered by increasingtheir length one or two nucleotides in order to increase their TMs.Multiplex PCR The experiment quantitating the target c-myc normalized to the endogenousExample reference GAPDH is repeated running both amplifications in the same tube. SeeFigure 1 on page 4 for the setup on the FAM layer and see Figure 10 on page 20 forthe setup on the JOE layer. Figure 10 is similar to the setup in Figure 2 on page 5,except GAPDH is being amplified in rows A–D (the same tubes where amplification ofc-myc is being performed). This illustrates one advantage of performing target andreference reaction in the same tube—higher throughput.Higher throughput is most evident if you are interested in analyzing a single targetbecause the number of sample tubes is reduced by a factor of two. As the number oftargets analyzed on the same plate increases, the advantage of same tube overseparate tube decreases, because a single set of reference reactions can be used tonormalize all of the different target reactions.User Bulletin #2: ABI PRISM 7700 Sequence Detection SystemPage 19 of 36
Figure 10. Plate setup for relative quantitation of the c-myc mRNA on JOE layerSpectral Compensation FeatureWhen analyzing data that have two reporters in the same tube, use the specialsoftware feature called Spectral Compensation. This is an enhancement of themulticomponenting algorithm because it provides improved well-to-well spectralresolution for multi-reporter applications. However, it can also be a liability because itincreases noise of the fluorescence measurements.With multiple reporter dyes in the same tube, Spectral Compensation should beturned on because accurate separation of dye signals is more important thanincreased precision. When one reporter dye is used in a tube, Spectral Compensationshould be left off in order to benefit from the improved precision.Page 20 of 36User Bulletin #2: ABI PRISM 7700 Sequence Detection System
Perform the following steps to access Spectral Compensation.StepAction1Under Diagnostics in the Instruments menu, select the Advanced Options dialogbox.2To analyze more than one reporter dye in the same tube, check the box markedUse Spectral Compensation for Real Time.3Click OK.NoteIgnore the warning message if the only change made is to turn SpectralCompensation on or off.Data HandlingAfter the analysis is performed, setting the baselines and thresholds, exporting thedata to Excel, and drawing standard curves in Excel are exactly the same as in theseparate tube example. For both the standard curve and CT method, the onlydifference between same-tube and separate-tube analysis is how replicates areaveraged.Multiplex PCR Results (Standard Curve Method)Table 4 on page 22 shows the results of the same-tube experiment using the standardcurve method. Both the c-myc and GAPDH amounts are determined from a sin
User Bulletin #2: ABI P RISM 7700 Sequence Detection System Page 7 of 36 Constructing a Relative Standard Curve The ABI P RISM 7700 Sequence Detection System (version 1.6 software) is not designed to construct two standard curves on the same plate. To analyze this experiment, Results are exported to an Excel spreadsheet by choosing the Export