Transcription
file:///home/nettings/LAD-2004-AE/slides.xmlAudio Engineering in a NutshellAudio Engineering in a Nutshell - Or: The next two hours of yourlifeBasics: the nature of Sound and its representationSound and hearingAnalog signalsDigital signalsBasic digital operationsControlling timing: delaysControlling spectrum: equalizationControlling dynamics: compressors/expandersSpace and spatializationSteve Harris S.W.Harris@ecs.soton.ac.uk Jörn Nettingsmeier nettings@folkwang-hochschule.de 1 of 5706/02/2004 03:42 PM
file:///home/nettings/LAD-2004-AE/slides.xmlA word of warningThis talk is absolutely packed. We will flood you with information.For two hours straight.Except there’s the lunch break. :-DAnd there will even be Maths.Three things will help you survive:We’ll start at the very beginning.You will be able to ask questions after each section, and possibly get answers.We’ll explain everything twice, first from the analog point of view (Jörn), then fromthe digital (Steve).Note: Another general-purpose q & a session is planned at the end, so if your questiondoes not relate to the current topic, please hold it until later.Basics: The nature of sound and itsrepresentation2 of 5706/02/2004 03:42 PM
file:///home/nettings/LAD-2004-AE/slides.xmlSound and hearingSound wavesSound is pressure waves travelling through a medium.Sound waves consist of alternating high and lowpressure zones.These zones oscillate in the direction of travel (alongitudinal wave)Sound waves travel through air at approx. 340m/s (v0, depending on temperature and humidity.The oscillating speed of sound is called thefrequency f, measured in cycles per second orHertz [Hz].The combined length of one high- and onelow-pressure zone is called the wavelength λ .We find:λ v0/fHearingWe detect sound with our ear-drums. Like a microphone diaphragm, they move alongwith the pressure waves.The softest sound humans can hear corresponds to an air pressure change of only0.00002 Pa (Pascal). (The normal air pressure on earth is 102,300 Pa.)The loudest sound we can endure has a pressure change of 200 Pa.Our hearing range covers 10 orders of magnitude of intensity!The audible frequency range reaches from from 20 Hz to 20 kHz. The upper boundmoves down with age.We perceive frequency as pitch, in a logarithmic fashion: pitch intervals areratios of frequencies, not differences.The range from a given frequency to twice that frequency is called an octave.3 of 5706/02/2004 03:42 PM
file:///home/nettings/LAD-2004-AE/slides.xmlSignal levels, or: The dreaded Decibel.To compute a sound pressure level L, a given pressure p is first normalized to areference: our hearing threshold p0 (0,00002 Pa).Because of the huge range of pressures we can perceive, the value is then log’ed tomake it more manageable:Lp 20 log p / p0The unit of Lp is dB SPL, or "Decibel Sound Pressure Level".For signals, we choose a reference voltage u0 of either 1V or 0.775V:Lu 20 log u / u0The unit of Lu is dBV (for 1V) or dBu (for 0.775V).With dB’s, a change of 6dB indicates roughly twice the level, -6dB is about half thelevel.Note that the Decibel is not an absolute measure, but a ratio, and that it ismeaningless without a reference!4 of 5706/02/2004 03:42 PM
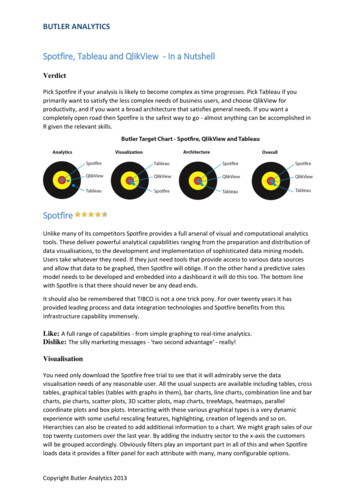
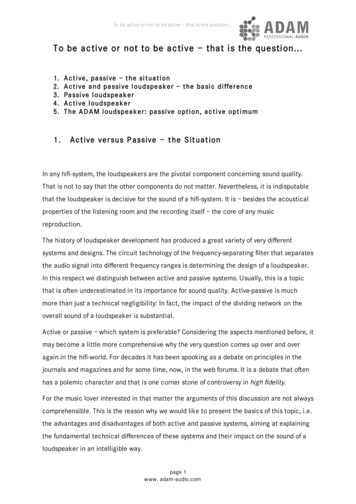
file:///home/nettings/LAD-2004-AE/slides.xmlAnalog SignalsFrom wave to signalA microphone diaphragm is moved back and forth by the pressure changes.Attached to it is a coil within a magnetic field.When it moves, an electric signal is induced in the coil.The voltage changes with the speed and direction of the diaphragm movement.Ideally, the signal is a perfect and complete representation of the sound.Audio SignalsAudio signals can be visualized with anoscilloscope.It displays voltage U vs. time t.This is called the time domain view.The strength of the signal at any one time is calledamplitude and roughly corresponds to loudness.Most audio signals are periodic - they follow arepeating pattern.One period is the section between three adjacentzero crossings.The signal’s frequency f (in Hertz) is the number5 of 5706/02/2004 03:42 PM
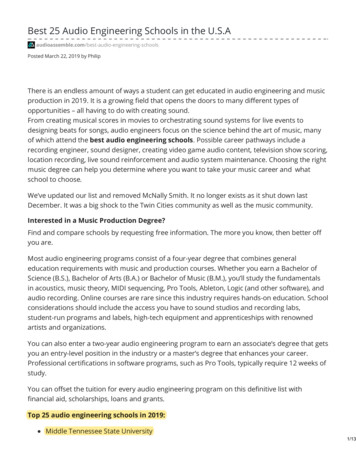
file:///home/nettings/LAD-2004-AE/slides.xmlof such periods per second. It corresponds to pitch.The points of maximum amplitude are called peaks.Sine waves (1)The most fundamental sound phenomenon is theharmonic oscillation.It produces just one single pitch. [sine@440Hz]In the time-domain view, it looks like a sinefunction.Sine waves can be mixed into complex sounds.The amplitudes of the components at any onetime add up to the result.[sine@659.255Hz], [both]Sine waves (2)6 of 5706/02/2004 03:42 PM
cal waves can amplify each other:Or they can cancel each other out, depending ontheir relative position:This relative position is called the phase φ .Detour: balanced connectionsProfessional balanced audio cables have three wires.Pin 1 (screen) is the shieldingfoil or braid and is grounded.Pin 2 (hot) carries the audiosignal.Pin 3 (cold) carries theinverted audio signal (180 outof phase).When electro-magnetic fields interfere with the cable, both hot and cold wires pick themup the same way.At the input stage, the cold signal is inverted again and added to the hot.Since they are back in phase, they amplify each other.7 of 5706/02/2004 03:42 PM
file:///home/nettings/LAD-2004-AE/slides.xmlBut the two halves of the noise are out-of-phase now - when added, they cancel out.Sine waves (3): analysisAny periodic sound is composed of sine waves:The fundamental frequency determines thepitch. The overtones or harmonics affect thetimbre ("sound").The sine components of a complex sound can befound with a spectrum analyser.A spectrogram plots intensity vs. frequency.This is called the frequency domain view, as opposed to the time domain view of theoscilloscope.Sine waves (3): analysis (cont’d)Noise has a non-periodic waveform.It is not composed of a few distinct sine waves, but of aninfinite number of arbitrarily close ones. The noise8 of 5706/02/2004 03:42 PM
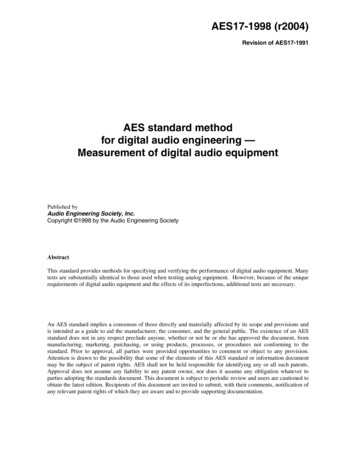
um is continous, without any discernible overtones.[White noise] contains all frequencies with equal loudness,i.e. the octave from 10 kHz to 20kHz contains as muchenergy as all the other octaves below.Since humans perceive pitch logarithmically, white noisesounds very bright with exaggerated treble.To accomodate for this, low-pass-filtered white noise isused for acoustic measurements. It is called [pink noise]and contains a constant amount of energy per octave.Sine waves (3): analysis (cont’d)A sonogram displaysintensity (color) vs. time(y-axis) vs. frequency(x-axis). When running, itscrolls up as time passes.Here are some speechsounds: sung vowels at thesame pitch, sibilants andplosives.Note the identicalfundamental and distinctharmonics of the vowels,and the noisy spectrum ofthe consonants.9 of 5706/02/2004 03:42 PM
file:///home/nettings/LAD-2004-AE/slides.xmlSine waves (4): synthesisNew sounds can be generated by adding sine waves of different frequency, amplitudeand phase. This is called additive synthesis.[square wave], only oddharmonics, slow rolloff[triangular wave], only oddharmonics, fast rolloff[sawtooth wave], allharmonics (bowedinstruments)[Fourier approximation of a square wave], [Fourier approximation of a triangular wave]Problems with analog signals: noise and clippingThere are many sources of noise in analog signal processing:All electronic components produce thermal noise through the jiggling of theiratoms (Brownian motion).Cables pick up noise via electro-magnetic interference (induction or capacitivecoupling).Analog media introduce additional noise (tape hiss or vinyl crackle).Analog signal stages will clip the signal if the amplitude is too high, producing distortion.10 of 5706/02/2004 03:42 PM
file:///home/nettings/LAD-2004-AE/slides.xmlA clipping stage can not follow the input signal, and flattens out the peaks of the wave.The result now resembles a square wave.Clipping generates new harmonics, which produce the typical distorted sound.Both noise and clipping cannot be undone. Noise reduction and peak reconstruction arelossy processes.Problems with analog signals: dynamic rangeAudio systems are bounded between the noise floor and the clipping level.The usable room between those boundaries is the dynamic range or signal-to-noiseratio (S/N) of a system.The human ear has a dynamic range of about 120dB from hearing to pain threshold.Studio-grade analog tape recorders achieve 70dB S/N, consumer machines are a lotworse.Therefore, care must be taken to always fully exploit the available range. Analog signalsshould always be kept as hot as possible without clipping.11 of 5706/02/2004 03:42 PM
ons?Digital SignalsContinous v’s. discrete signals12 of 5706/02/2004 03:42 PM
ng (AD Conversion)Turning the analogue signal representation into digitsMost commonly used encoding in software is Pulse Codule Modulation (PCM)Represented as impulses n times per second - a pulse trainn is the sample rateAmplitude of the impulse is measured by passing the signal through alowpass filter13 of 5706/02/2004 03:42 PM
t criterion and aliasingNyquist criterion states that in order to be correctly sampled, all components of the signalmust at less than half the sample rateAny compenents at a frequency at or over the nyquist frequency will appear as "aliased"components when converted to PCMTrying to PCM endode a signal at 21kHz that contains components obove 10.5kHzWhy does aliasing do that?14 of 5706/02/2004 03:42 PM
ve at about 0.9 x the sampling frequency (1.8 x nyquist frequnecy)Samples shown without waveAliasing results in a sinewave appearing at a lower frequencyAnti-aliasing filtersThe best thing to prevent aliasing would be a bricakwall lowpass filter:15 of 5706/02/2004 03:42 PM
file:///home/nettings/LAD-2004-AE/slides.xmlIn practice you can’t get a response that good, but its the idealReconstrunction (DA Conversion)In theory the PCM data can be turned back into an anlogue signal by passing theimpulse train through a lowpass filterThe ideal filter would be thesame brickwall filter we’dlike for anti aliasing.The reconstruction here wasdone using a filter thats veryclose to that16 of 5706/02/2004 03:42 PM
ms: aliasingEven though the analogue signal will have been antialiased on the way in it is stillpossible for aliasing to be created by processingThis can happen if some processing causes the frequency compenents to be shiftedbelow 0 or obove the Nyquist frequencyOr if the PCM data is treated as if it were continuous in synthesis:If the signal is built up from sinewaves, all below the Nyquist freuency then the signal willlook a bit odd in PCM form, but will reconstruct to something that sounds like a saw waveQuantisationQuatisation is the approxiation of the level of the analogue signal to the most appropraitedigital representation, eg. a 4 bit (16 level) sample of an arbitrary signal is quantised as:17 of 5706/02/2004 03:42 PM
m: quantisation noiseThe quantised signal does not match the originalcurve exactly, some points are over, and someare underThe differenece between the source signal andthe quantised one will be percieved as noise ontop of the wanted signal: [source sine wave], [4 bitsine wave], [quantisation noise]18 of 5706/02/2004 03:42 PM
olationTo reconstruct a discrete signal we can lowpass filter it with a brickwall lowpass filter, soit makes sense we can do the same to interpolateWe can get a brickwall filter by replacing every impulse in the descrete signal with the"sinc" function:The only problem with thisis that the sinc function isinfitinly wide, so we have toapproiximate itInterpolation (2) When do you need sincThe original PCMdata doesnt looklike much, andlinearly interpolatingit just gives rubbish19 of 5706/02/2004 03:42 PM
file:///home/nettings/LAD-2004-AE/slides.xmlBut when sinc interpolated it can clearly be seen as a sinewaveInterpolation (3) Example stages of sinc interpolationSinc waveforms areprogressivly addedinplace of theimpulsesThis process is called convolution20 of 5706/02/2004 03:42 PM
m: intermodulation distortionA 4 bit sample of a generated sine wave appears as:Note that the quantisationnoise from the sinewavecontains regularly repeatingsignals.DitherDither is a way of masking the intermodulation distortion, a small ammount of noise isadded to the signal before its truncated21 of 5706/02/2004 03:42 PM
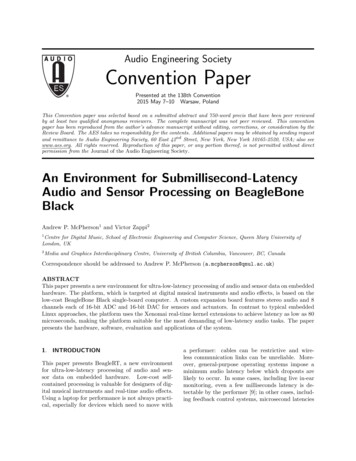
file:///home/nettings/LAD-2004-AE/slides.xmlThis makes the signal noisier (hurts the SNR), but makes the intermodulation distortioneven whitenoise, unrelated to the source signal and so less anoyingDither (2)This is a 1k Hz sine wave at -40dB’s truncated to 8 bits, both undithered and ditheredThe graph on the left shows the intermodulation distortion caused by the truncated,undithered signalThe graph on the right shows the lack of distortion, but reduced signal to noise ratio[undithered sine], [dithered sine]22 of 5706/02/2004 03:42 PM
file:///home/nettings/LAD-2004-AE/slides.xmlAside: equal loudness curvesThese curves show signals of equal "loudness" (i.e. perceived volume)They are known as the Fletcher-Munson curvesThey indicate how loud a sinewave at a particular frequency will sound, compared to asinewave at another frequencyThis is relevant to dithering.Triangular ditheringAs the high frequencies are percieved less strongly by passing the noise through agentle high pass filter and amplifiying it so it has the same ammount of energy we canstill mask the distortion, but make the noise le
ratio (S/N) of a system. The human ear has a dynamic range of about 120dB from hearing to pain threshold. Studio-grade analog tape recorders achieve 70dB S/N, consumer machines are a lot worse. Therefore, care must be taken to always fully exploit the available range. Analog signals should always be kept as hot as possible without clipping.File Size: 1MBPage Count: 57People also search foraudio engineering pdfaudio engineering guide pdfaudio engineering guideaudio engineering educationaudio engineering mastersadsr definition in music