Transcription
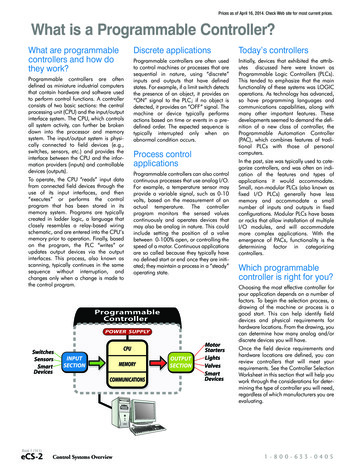
EVER BETTER EVER STRONGERBerenberg ConferenceOctober 2018André LacroixCEO
AGENDA1Intertek 5x5 growth strategy2ATIC Innovations to accelerate growth3Ever Better financial performance4Ever Better execution of our 5x5 growth strategy5Sustainable shareholder value creation2
EVER BETTER EVER STRONGER Leadership position in a growing global 250bn ATIC marketwith presence in 100 countries Scale positions in attractive end-markets with a high marginand strongly cash generative earnings model Differentiated Total Quality Assurance value propositionoffering superior customer service Track record of shareholder value creation in the last 15 yearswith double-digit earnings growth and third highestprogressive dividend in FTSE100 Ever growing corporate complexity is a growth accelerator forIntertek, leveraging our innovative ATIC solutions33
1INTERTEK 5X5 GROWTHSTRATEGY4
A PURPOSE-LED VISIONTO MAKE THE WORLD A BETTER AND SAFER PLACEOUR PURPOSEBringing Quality and Safety to LifeOUR VISIONTo be the world’s most trusted partner forQuality AssuranceOUR VALUES We are a global family that values diversity We always do the right thing. With precision,pace and passion We trust each other and have fun winningtogether We own and shape our future We create sustainable growth. For all5
INTERTEK TQA SERVICES ARE MISSION CRITICALFOR OUR CLIENTS TO OPERATE SAFELYGrowing corporate complexityHigher quality expectationsVocal consumers on social mediaIncreased regulatory demandsGreater focus on sustainabilityTQA ASSURANCE TESTING INSPECTION CERTIFICATION6
EXCITING GLOBAL ATIC GROWTH OPPORTUNITIESGLOBAL ATIC MARKETGROWTH OPPORTUNITY7
A GOOD TO GREAT 5X5 STRATEGY FOR GROWTH5x5 Strategic Goals12Fully engagedemployees working in asafe environmentSuperior customerservice in Assurance,Testing, Inspection andCertification5 Strategic Priorities34Margin accretive revenuegrowth based on GDP organic growthStrong cash conversionfrom operations5Accretive, disciplinedcapital allocationpolicy5 EnablersDifferentiated TQA Brand PropositionLiving Our Customer Centric CultureSuperior Customer ServiceDisciplined Performance ManagementEffective Sales StrategySuperior TechnologyGrowth and Margin Accretive PortfolioEnergising Our PeopleOperational ExcellenceDelivering Sustainable Results8
WE OPERATE A DECENTRALISED CUSTOMER CENTRIC ORGANISATIONINTERTEK ORGANISATIONAL STRUCTUREBUSINESS LINESPRODUCTSSoftlines, Hardlines, Electrical,Connected World, BusinessAssurance, Building &Construction, TransportationTechnologies, Chemicals &Pharma, and FoodCaleb BrettTRADEGEOGRAPHIC AREASGLOBAL FUNCTIONSAmericasATIC Solutions InnovationsChinaSouth andSouth East AsiaHRFinanceGovernment & Trade ServicesAgriWorldITMiddle East and AfricaMarketing and CommunicationsEurope and Central AsiaRESOURCESIndustry ServicesMineralsNorth East Asia and AustralasiaLegal, Risk and ComplianceCorporate Development9
DOING BUSINESS THE RIGHT WAYDELIVERING SUSTAINABLE GROWTH FOR ALL STAKEHOLDERS12UN SustainableDevelopmentGoalsPositive Impacton our people,suppliers ensivenon-financialESG KPIsSupporting ourclients’sustainabilitypriorities4Core toeverything wedo10
2ATIC INNOVATIONS TOACCELERATE GROWTH11
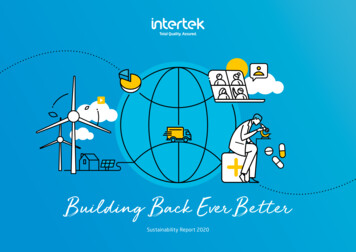
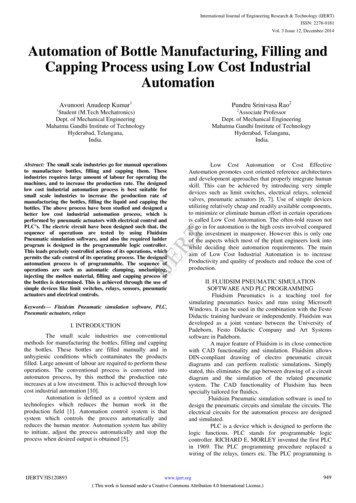
GLOBAL TRADING LANDSCAPE SIGNIFICANTLY DIFFERENT 50 YEARS AGOn/a38%10%27%72%7%20%Companies produced locally and were focussed on their domestic marketsGlobal Trade represented 25% of Global GDP in the 1960sTrade as % of GDPSource: World Bank. Trade is the sum of exports and imports of goods and services measured as a share of gross domestic product.12
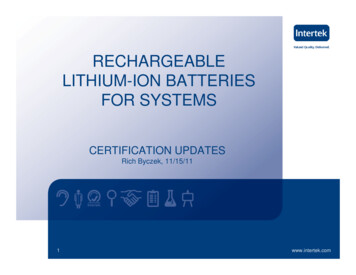
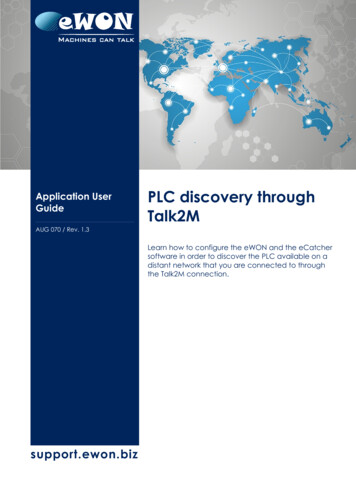
THE 21ST CENTURY HAS CREATED A TRULY GLOBAL %63%Global trade as a % of global 198520002016Demand has become truly global, reflected in global supplyToday Global Trade represents 56% of Global GDPTrade as % of GDPSource: World Bank. Trade is the sum of exports and imports of goods and services measured as a share of gross domestic product.13
CORPORATIONS ARE INCREASING THEIR FOCUS ON SYSTEMIC OPERATIONAL RISKSUPPLYTIER 3TIER 2PRODUCTIONTIER 1Global multi-tier sourcing3RD PARTYOWNEDGlobal IBUTION CENTRESMulti-country distributionIN-STOREONLINECONSUMERMulti-channel routes to marketGROWING COMPLEXITY DRIVING DEMAND FOR END-TO-END SYSTEMIC QUALITY ASSURANCE14
REDEFINING THE INDUSTRY FROM TIC TO ATIC TO HELP OUR CLIENTSMANAGE GREATER COMPLEXITYTIC PROVIDES QUALITY & SAFETY CONTROLS IN HIGH RISK AREASSUPPLYTIER 3TIER 2PRODUCTIONTIER 13RD PARTYOWNEDDISTRIBUTIONTRANSPORTATIONDISTRIBUTION E PROVIDES AN END-TO-END ASSESSMENT OF QUALITY & SAFETY PROCESSES15
OFFERING A SUPERIOR CUSTOMER SERVICE WITH OUR TQADIFFERENTIATED VALUE PROPOSITIONAssuranceAssurance ensures our customers identify andmitigate the intrinsic risk in their operations,supply chain and quality management systemsRESEARCH &DEVELOPMENTTestingCONSUMERMANAGEMENTOur CustomerPromiseRAWMATERIALSSOURCINGIntertek Total Quality Assuranceexpertise delivered consistently withprecision, pace and passion, enablingour customers to power ahead safelyInspectionAssurance Testing Inspection CertificationDISTRIBUTION& RETAILCHANNELSTesting is evaluating how products andservices meet and exceed quality, safety,sustainability and performance standardsCOMPONENTSUPPLIERSInspection is validating the specifications,value and safety of raw materials, productsand ification is certifying that products andservices meet trusted standardsTQA END-TO-END SYSTEMIC APPROACH TO QUALITY ASSURANCE16
INTERTEK PROVIDES A DEPTH AND BREADTH OF ATIC nagement SystemsSoftlinesAgricultureAppliance & ElectronicBenchmarking in Quality& PerformanceHardlinesAsset IntegrityAerospace & AutomotiveAutomotiveBuilding & ConstructionBuilding & ConstructionBiofuelsChemical & PetrochemicalConformity by CountryBuilding & ConstructionElectricalEco-TextileChemicals & PharmaExporter & ImporterFood & Food ServicesElectricalField LabellingHazardous LocationsFoodIndustrialHVACR1Health & BeautyMineralsIndustrial EquipmentMineralsOil & GasIT & TelecomsPackagingSite ConstructionLife Safety & SecurityPharmaceuticalTextile & ApparelLightingSustainability & EnvironmentFacility / Plant & EquipmentLegal & RegulatoryProduct DevelopmentVendor ComplianceCorporate Social ResponsibilityFailure InvestigationLaboratory OutsourcingRisk ManagementSupply Chain AssessmentOil & GasMedical DevicesNetwork Assurance1HeatingVentilation Air Conditioning and Refrigeration17
T-SHIRT GLOBAL OPERATIONS – SYSTEMIC RISK MANAGEMENTSUPPLYTIER 3TIER 2PRODUCTIONTIER 13RD TION CENTRESIN-STOREONLINECONSUMERCommercial &Functional ClaimsGlobal OrganicTextile StandardRetail Store BuildingTesting & InspectionHigh VolumeInstrument TestingRaw Materials &Pre-productionInspectionCotton FieldSpinning MillDamage rogrammeDyeing &Finishing MillEnvironmentalChemicalManagementSolutions ISO 14001Certificate ofConformityProduct Testing forPhysical and ChemicalSafety Properties &QualitiesRandom Inspection& LoadingSupervisionGarmentFactoryWorkplace ConditionsAssessmentISO 9001 eImporterCustoms andTrade PartnershipQuality & tailerRetailerBenchmarking /Due Diligence /Brand ntertek Total Quality Assurance: AA TTT II CC18
LIGHTBULB GLOBAL OPERATIONS – SYSTEMIC RISK MANAGEMENTSUPPLYTIER 3TIER 2PRODUCTIONTIER 13RD TION CENTRESIN-STORECONSUMERCommercial &Functional ClaimsPhysical Testing &Chemical AnalysisMarket SurveillanceInspecting On-SaleProduct QualityHazardousMaterialAssessmentGlobal SafetyCertificationCopper MineDamage vicesQuality/Health &Safety, EnvironmentalAuditsTraining ProgramsTransportationtestingEnergy EfficiencyTestingIoT servicesManufacturingManufacturingFactory WorkingConditionsEvaluationGlobal MarketAccess AssuranceHaulierPackagingEvaluationGreen PackagingClaim CertificationDistributorGlobal ailerBenchmarkingRetailerProduct ReturnsAnalysisIntertek Total Quality Assurance: AA TTT II CC19
CAR GLOBAL OPERATIONS – SYSTEMIC RISK MANAGEMENTSUPPLYTIER 3DesignValidationPlan - TestingTIER 2PRODUCTIONTIER 1OEMRegulatoryComplianceAssessment &Test PlanningTRANSPORTATIONRETAILDISTRIBUTION CENTRESOEMCONSUMERCertificationAftermarket SalesMaterial,Component &SoftwareValidation &TestingRegulatoryComplianceCertificationBill of Materials &Part QualityInspectionResearch ity/Health &Safety, EnvironmentalAudits & TrainingProgramsComponentProductionFunctional Safety &Risk Assessments;Working ConditionsAssessmentErgonomic PanelEvaluationsFleet & TrackTesting,HomologationImport andPre-ShipmentInspectionFull VehicleManufacturingImport/ExportGreenhouseGas Validationand VerificationFailure AnalysisGlobalSupply ChainManagementVehicle andSite InspectionsBenchmark Vehicles,Components andSystems InspectionsDealershipsFull VehicleAssessmentsHarmonisedSystemCustoms CodingStatutory views &Brand AuditsAftermarket GovernmentFieldPerformanceData Collection& AnalysisIntertek Total Quality Assurance: AA TTT II CC20
THE PACE OF CHANGE IS ACCELERATING IN MULTIPLE DIRECTIONS“AI forecasted to increaseUSA economic growth by35% by 2035”“The global blockchainmarket is expected to beworth US 20bn in 2024”“The rise of cyber crimecontinues to accelerate: UKbusiness cyber crime rose 63%in 2017”“By 2050, 70% of the world’spopulation will live in cities”“Sales of Electric Vehicles willincrease 1,000% in the next 8years”“Between 2009 and 2015 thenumber of internationallyrecognised trademarks grew50% to 24m”“Global solar power capacityto increase 590% by 2040”“87% of millennials would bemore loyal to a company thatsupports environmentalissues”“Growth in Emerging Marketsto drive an increase in theworld’s middle class to 5bnpeople by 2030”“By 2025, the car market forpartially autonomous vehiclesis expected to be at US 36bn”“Ecommerce, onlinefood and traceabilityare rewriting theretail rulebook”“22% of American adults havesold in the Sharing Economy”“IoT will change the way welive and work”“By 2050 there will be 2bnpeople aged over 60”A MORE COMPLEX CORPORATE WORLD MEANS MORE GROWTH OPPORTUNITIES FOR INTERTEK21
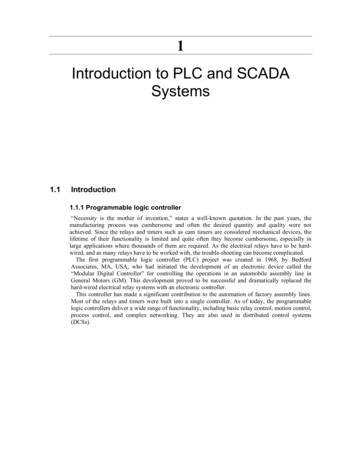
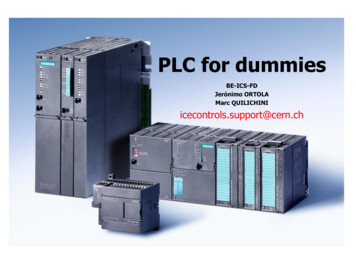
EVER GROWING COMPLEXITY MEANS EVER GREATER LEVELS OF RISKGrowth of New Products Drive Quality RisksHacking is Driving Increases in Data 5Vehicle Recalls20082011Car MakesSource: National Highway Traffic Safety Administration20142017421471201120122013Other Breaches20162017Hacking BreachesSource: Identity Theft Resource Centre, US only22
INCREASED SAFETY CONCERNS IN THE FOOD INDUSTRYFrequent Food and Drink Product Recalls“Chicken salad recalls over fears it mightcause food poisoning”“Canada recalls gin over too strongalcohol content”“Crackers recalled over potentialsalmonella risk”Independent, July 2017ABC News, May 2017Independent, July 2018“Chocolate recalls over salmonella fears”“Macadamia nuts recalls due to listeriacontamination”“Retailers stop selling chicken wings insafety scare”Independent, June 2017ABC News, June 2017Chronical Live, July 2017“Edamame recalled over listeria fears”“Needles in strawberries fear promptsNew Zealand to halt Australian imports”“Belgian White Chocolate Cookies recallsfor containing ‘undeclared hazelnut’”CNN, March 2017Sydney Morning Herald, September 2018The Sun, July 2017GROWING DEMAND FOR A TRUSTED FOOD SAFETY PARTNER2323
INNOVATIVE SOLUTIONS TO ACCELERATE GROWTHBREAKTHROUGHDevelop newbreakthrough productsand servicesCreate new markets,target new customerneedsADJACENTDevelop newnewDevelopproducts andandproductsservicesservicesEnter adjacentadjacentEntermarkets, servingservingmarkets,adjacent customerscustomersadjacentBreakthroughTechnology that enable solutions to create new marketsCOREStrengthenexistingproducts andservicesServe existingmarkets andcustomersBREAKTHROUGH INNOVATIONTechnology that enable solutionsto create new marketsINNOVATION IN ADJACENTSEGMENTSExpanding into fast growing andhigh margin areasINNOVATION FROM THE COREBuilding on the strengths ofexisting products and servicesSUPPORTING OUR CUSTOMERS TO THRIVE IN AN INCREASINGLY COMPLEX WORLD2424
INNOVATION FROM THE CORE TO STRENGTHEN EXISTING SERVICESStrengthened our differentiated oil and gas testing offering byleveraging the heritage of our founder Caleb BrettIntertek’s innovative Mobile Laboratories gives ExxonMobil theflexibility required to test fuel quality across their fast growingMexico retail businessIntertek PipeAware delivers technology enabled transparencyinto the pipeline manufacturing and construction processVoice of the Consumer leverages our customers’ consumerfeedback through holistic product assurance plans, addressingsafety, quality and perception concerns25
INNOVATION IN HIGH GROWTH AND HIGH MARGIN AREASWith our Working Conditions Assessments, wesupport our customers in their goal of providing a safeand ethical working environment for their employeesHardlines and Softlines Chemical Testing, safeguardingconsumers in an environment of rapidly developingchemical regulations and advanced materialstechnologiesIntertek’s Cybersecurity Services are an integral part ofour differentiated TQA service offering, addressinggrowing cyber threats as part of a systemic riskmitigation approachIntertek KJ Tech offers road testing, allowing automanufacturers to understand how their vehiclesperform in real life situationsWith our global network of Sustainability experts andATIC solutions, Intertek is uniquely placed to helpcustomers achieve their existing and emergingsustainability goals26
TECHNOLOGY BASED INNOVATION OFFERING BREAKTHROUGH SERVICESInlight is a SaaS platform delivering the bespokemapping of risks across the supply chainAlchemy offers SaaS solutions delivering training toensure employee consistency and compliance in thefast growing food industryWisetail is a leading e-learning platform that helpsrestaurants and retailers create a brand specificoperating cultureInterpret uses near infrared spectrum analysis topredict the physical properties of crude oil, reducingthe time taken from weeks to minutesOn Track enables restaurant brands to benchmarkoperational performance and efficiently train staffthrough interactive simulations and gamification27
3EVER BETTER FINANCIALPERFORMANCE28
CONSISTENT PROGRESS IN REVENUE, MARGIN AND CASH IN 15, 16 & 17Adjusted Operating Profit ( m)Revenue ( m)2,5672,0932,166FY14FY15FY162,769FY17410324343FY 14FY 15Adjusted EPS (p)FY 16Change in Adjusted Operating Margin@ CCR (bps)468FY 17 110bps 20bps 30bpsFY 15FY 16FY 17Free Cash FlowDividend (p) 318m167.7132.1140.7FY 14FY 15FY 16191.6FY 1749.152.3FY 14FY 1562.4FY 16 342m 235m71.3 185mFY 17FY 14FY 15FY 16FY 1729
CONTINUOUS PROGRESS ON REVENUE, MARGIN AND CASH IN H1 2018Revenue ( m)Adjusted Operating Profit ( m)1,3721,34822422616.3%16.8%H1 17H1 18H1 17H1 18H1 17H1 18 3.9% CCR(1.8%)Adjusted EPS (p)90.491.2H1 17H1 18Rolling 12 months revenue 6.4% CCR 0.8%Working Capital ( m) 6.8% CCR 0.9%1Adjusted Operating margin (%)225 40bps CCR 50bpsInterim Dividend (p)21123.5H1 178.2% of Revenue1H1 187.7% of Revenue1(6.5%)YoYH1 1731.9H1 18 35.7%30
ACCELERATION OF ORGANIC REVENUE GROWTH MOMENTUMOrganic growth at constant currencyH1 organic growth by divisionOrganic revenuegrowth1 (%)10.0%3.4%Products: 5.7%76%ofearnings2.5%1.7%Trade: 0.7%18%ofearnings(10.0%)6%10.0%Revenuegrowth (%)Resources: (0.7%)H1 17H2 17H1 18[]%(10.0%)31Note: (1) At 2018 constant currency rates
GROUP CENTRE OF GRAVITY MOVING TOWARDS HIGH GROWTH AND HIGHMARGIN SECTORSDivisional Revenue Split ( m)ATIC Revenue Split ( m) 2,769m 2,769m14% 2,166m 2,166m10%59%54%51%52%23%25%24%24%8%8%FY 15FY 1718%FY 15Products30%FY ation32
4EVER BETTER EXECUTION OF OUR5X5 GROWTH STRATEGY33
SUPERIOR CUSTOMER SERVICE DELIVERY WITH NPSCustomerCentricNet PromoterScoreEntrepreneurial, puttingthe Customer 1stListening to c.7,000customers per monthTOTAL QUALITYASSURANCEAssurance Testing Inspection CertificationDataIntelligenceTQA ValueDeliveryBenchmarking by site,service, and customerDisciplined operatingprocesses andcontinuous innovation34
GROWTH AND MARGIN ACCRETIVE PORTFOLIO MANAGEMENTInvest in Fast GrowingBusinesses1 Grow Scale Businesses2 Softlines Business and People Assurance Hardlines AgriWorld3 Improve Performance4 Industry Services Growth and margin accretiveportfolio strategy Organic and inorganicinvestments Building & Construction Electrical Transportation Technologies Caleb Brett Food Government & Trade Services Connected World Strategic review ofunderperforming businessunits Sustainability Consolidation of facilitiesGroup Revenue 2,567mGroup Operating Profit 2,769m 410mM&A Focused on attractive growthand margin prospects Businesses with strong IP andmarket leadership positions Highly cash generative businessmodelsGroup Margin 468m 2,166m5Portfolio Strategy15.9%16.0%FY 15FY 1616.9% 343mFY 15FY 16FY 17FY 15FY 16FY 17FY 1735
SYSTEMIC PERFORMANCE MANAGEMENTDisciplined Performance Management CalendarWeeklyMonthlyQuarterlyFinancial Metrics5 Year PlanYearlyOperational MetricsRevenue GrowthPricing PowerMarketing LeadsHealth and SafetyMarginWorking CapitalCustomer RetentionSales FunnelROCECapital AllocationCustomer AcquisitionsBack Log ManagementCash ConversionCostEmployee TurnoverNet Promoter ScoreCustomer ProfitabilityInvestments in GrowthOperational ExcellenceSite Capacity Utilisation36
SELECTIVE M&A IN ATTRACTIVE GROWTH AND MARGIN SECTORS 300m Added in AnnualRevenue from AcquisitionsSince 2015A leading provider of SaaS-basedPeople Assurance solutionsA leading network security andassurance services providerFY18A leading provider of quality andquantity cargo inspection servicesLeading provider of productsecurity certification solutionsMarket leader in food assuranceand inspection in ItalyLeading provider of materialstesting and speciality constructioninspection in New YorkFY15Leading US provider oftesting and assuranceservices to commercial andcivil construction marketsNon-Destructive Testingservices for the energyindustry across AustralasiaFY17FY16Leading provider of cyber securitynetwork assurance servicesLeading provider of on-roadvehicle testing servicesLeading certification body in Market leader in the provision ofenvironmental water testingDenmark with an establishedservices in Mexiconetwork and expertise in auditing,certification and trainingDISCIPLINED CAPITAL ALLOCATION IN ATTRACTIVE GROWTH AND MARGIN SECTORS3737
5SUSTAINABLE SHAREHOLDERVALUE CREATION38
deResourcesGDP GDP growthLong-term growthOur Mid- to Long-TermValue CreationOur SectorsOur ServicesINTERTEK HIGH QUALITY EARNINGS MODELIntertek Virtuous EconomicsGDP Organicrevenue growthMargin accretiverevenue growthInvestments in attractivegrowth and margin sectorswith Capex / M&AStrong freecash flowDisciplinedcapital allocation39
ATTRACTIVE STRUCTURAL GROWTH DRIVERSProducts59% of Revenue75% of ProfitTrade23% of RevenueResources19% of Profit18% of Revenue6% of ProfitIncreased numberof Brands & SKUsFaster innovationcyclePopulation growthGDP growthLong term demandfor energyInvestment ininfrastructureIncreasedregulationIncreased consumerfocus onsustainableproductsDevelopment ofregional tradeGrowth intransportinfrastructureSupply chain riskmanagementGrowth inalternative energyImprovements insafety,performance andqualityIncreasedcorporation focuson riskmanagementIncreased focus ontraceabilityGrowth in portinfrastructureSustainability ofenergy supplyFocus on health &safety75% of Group profit based on GDP agnosticgrowth drivers19% of Group profit based on global, regionaland local trade growth6% of Group profit based on global growthdrivers in the energy sectorGDP GDP growthLong-term growthGROWTH OUTLOOK: GDP ORGANIC REVENUE GROWTH IN REAL TERMS40
CAPITAL LIGHT BUSINESS MODELOperating Margin1Free Cash Flow1 342m16.9%Working Capital % ofRevenueReturn on InvestedCapital126.7%7.1%16.0%5.0% 318m21.7%FY 16Note: (1) AdjustedFY 17FY 16FY 17FY 16FY 17FY 16FY 1741
DISCIPLINED CAPITAL ALLOCATION01Capex and working capital investment to support organic growth (target c.5% of revenue in capex)Sustainable shareholder returns through payment of progressivedividends based on a target payout ratio of c.50%0302M&A focused on strong growth and margin prospects in businesses with leading market positions or innew attractive growth areas, geographies or servicesEfficient balance sheet with flexibility to invest in growth with Net Debt / EBITDA targetof circa 1.5x - 2.0x0442
TRACK RECORD OF SHAREHOLDER VALUE CREATIONAdjusted EPS (p)Revenue ( m)10y CAGR 14.5%10y CAGR 14.5%2016-17 7.9%2,567131.2138.6132.1140.7FY 12FY 13FY 14FY 15Cash Generated from Operations ( m)Dividend (p)10y CAGR 15.9%10y CAGR 15.5%FY 1062.4INTERTEK RANKS 3RD HIGHEST IN THE FTSE100 IN DIVIDEND PROGRESSION SINCE THE IPO IN 200271.3FY 17FY 09FY 15FY 0833.7FY 1428.149.1FY 1325.5FY 1120.8FY 07FY 17FY 1618.046.052.341.0FY 12579442FY 15387FY 14379FY 13333FY 12289FY 11271FY 10FY 08278FY 09149194FY 075432016-17 14.3%FY 162016-17 6.6%FY 17107.2FY 1689.4FY 10FY 07FY 17FY 16FY 15FY 14FY 13FY 12FY 11FY 10FY 0967.181.5FY 091,374FY 081,2372,093191.6167.72,16649.7FY 08FY 077751,0042,0542,769FY 111,7492,1842016-17 14.3%43
CONCLUSION 5x5 Good to Great journey on track High margin, highly cash generative earnings model delivering shareholdervalue Exciting growth, margin and cash opportunities On track to deliver 2018 targets– Good Organic Revenue Growth Momentum*– Moderate Group Margin Expansion*– Strong Cash Conversion Making Intertek Ever Better Ever Stronger(*) atHereConstant CurrencyInsert Footer4444
Intertek, leveraging our innovative ATIC solutions 3. INTERTEK 5X5 GROWTH STRATEGY 1 4. . Disciplined Performance Management Superior Technology Energising Our People Delivering Sustainable Results 5x5 Strategic Goals . Asset Integrity Building & Construction Chemical & Petrochemical Electrical Exporter & Importer Field Labelling