Transcription
ANNUALADMISSIONSSTATISTICALREPORTMay 2021
2021 UNIVERSITY OF OXFORD ANNUAL ADMISSIONS STATISTICAL REPORTForewordFor a university with such a strong sense of place, this past year has been a highly unusualone in Oxford, where streets so often teeming with students have largely been silent for longstretches of time. The students who remained, and those studying from home, have displayedexemplary resilience and commitment to their education. Students and staff alike have takenenormous pride in the work of our academics in developing vaccines and therapeutics aswell as enhancing our understanding of COVID-19. It is no surprise then that our admissionsnumbers continue to rise as prospective students see the many contributions Oxford makes tosociety both nationally and globally.While the pandemic has, in many ways, changed the way we operate, it has not weakenedour commitment to diversifying the make-up of our student body. In this, our fourthannual Admissions Report, we provide details of the success rate of British undergraduateapplications by educational, regional, racial and socio-economic background as well as bysubject and college. The highlights are as follows: over the past five years the proportionof students from state schools rose from 58% to 68.6%. The proportion identifying as Blackand Minority Ethnic rose from 15.82% to 23.6%. The proportion from socio-economicallydisadvantaged areas rose from 8.2% to 15.9%. The proportion from areas of low progressionto higher education rose from 11.4% to 15.6%. The proportion declaring a disability rose from7.2% to 10.4%. The proportion of women rose from 48.6% to 54.2%. This reflects real progressand is a testament to the dedication of our Admissions Teams, the support of school teachersand, of course, the many talents of able and ambitious young people.We welcomed our first cohort of students under the new Opportunity Oxford Programmein the autumn and responded rapidly to the pandemic by putting our access and outreachactivity online, creating Virtual Open Days and developing digital versions of our signatureprogrammes like UNIQ. In December this year we conducted our admissions interviewsremotely for the first time.Notwithstanding all the adjustments and adaptations required by the pandemic we remaincommitted to ensuring that every talented, academically driven pupil in the country, whereverthey come from, sees Oxford as a place for them.Professor Louise RichardsonVice-ChancellorContentspage 4page 7page 10page 16page 19PAGE 2Section 1. Overall numbers, including domicileSection 2. Nation and regionSection 3. DisadvantageSection 4. School typeSection 5. Genderpage 22page 34page 35page 38page 39Section 6. EthnicitySection 7. DisabilityGlossaryGuide to the Oxford admissions processNote on HESA data
UNIVERSITY OF OXFORD ANNUAL ADMISSIONS STATISTICAL REPORT 2021About this reportThis report presents undergraduate admissions statistics for the University of Oxford over fiveadmissions years between 2016 and 2020, broken down into chapters covering the followingareas: overall numbers, domicile, nation and region, disadvantage, school type, gender, ethnicityand disability.The report includes information for Oxford’s colleges and largest courses, aggregated for thethree admissions years 2018 to 2020. Aggregation has been used as small yearly figures arelikely to provide a misleading picture. Nonetheless, some figures remain so small that a handfulof decisions can appear to create large swings which have limited statistical value. This healthwarning applies even more strongly to single-year statistics for colleges and courses. The fulldata are available to view online: ox.ac.uk/adstats.The report also provides some national context for Oxford’s data, primarily based on figuresfrom the Higher Education Statistics Agency (HESA). This includes information on the numbersof students achieving Oxford’s minimum standard offer: three A grades or better at A-level andequivalent Scottish qualifications. It also compares Oxford’s data with the higher educationsector as a whole and with the Russell Group of leading universities.A summary of Oxford’s admissions process can be found on page 38.Key pointsFollowing extended school closures in 2020 because of the COVID-19 pandemic, A-levels andother qualifications around the world were awarded using a range of methods including centreassessed grades in place of the usual examinations. 3,695 students were admitted to Oxford,around 400 more than usual. Almost four fifths of those places (2,950) went to students living inthe UK.Between 2016 and 2020, within the total group of UK-domiciled undergraduates admitted: The proportion from state schools rose from 58.0%1 to 68.6%.The proportion identifying as Black and Minority Ethnic (BME) rose from 15.8%2 to 23.6%.The proportion from socio-economically disadvantaged areas rose from 8.2% to 15.9%.The proportion from areas of low progression to higher education rose from 11.4% to 15.6%.The proportion declaring a disability rose from 7.2% to 10.4%.The proportion of women rose from 48.6% to 54.2%.FOOTNOTE1. Percentages in this report have been rounded to one decimal place.2. Some figures are slightly different from those presented in previous editions of this report following data corrections.PAGE 3
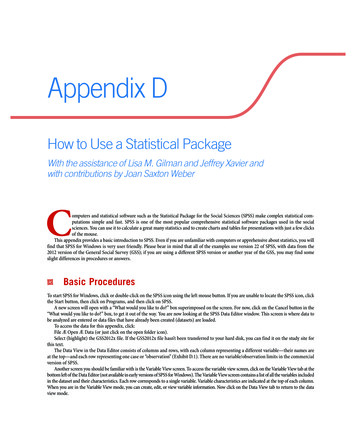
2021 UNIVERSITY OF OXFORD ANNUAL ADMISSIONS STATISTICAL REPORT1. Overall numbers, including domicileThis section presents information on Oxford’s overall numbers, as well as thedomicile of Oxford’s applicants, offer holders and admitted students.OVERALL NUMBERS The number of students admitted in 2020 was higher than usual following the exceptionalarrangements for awarding A-levels and other qualifications during the COVID-19 pandemic. Overall application numbers have risen annually, and by 22.2% since 2016.Table 1.1: Overall applications to Oxford, offers made and studentsadmitted, all domiciles, 2016–2020APPLICATIONSOFFERSSTUDENTS 7713,282Table 1.2: Courses with the highest number of applicants per place(all domiciles, three-year total 2018–2020)3COURSENUMBER OF APPLICANTSPER PLACENUMBER OF APPLICANTSPER PLACECOURSEEconomics & Management16.9PPE*9.2Computer Science16.1History & Politics9.2MedicineMaths & Computer Science11.010.6MathematicsPhysics9.18.0Biomedical Sciences10.1Law**8.0Note: This table contains aggregatedfigures for the period 2018–2020.Aggregated figures for this period willappear throughout the report, mostoften where tables refer to data bycourse or by college.*Philosophy, Politics and Economics **Including Law/Law with Studies in EuropeA-level grade profile of UK-domiciled students applying to, receiving offers fromand being admitted to Oxford (2020 UK intake)s W hile three A grades is Oxford’s minimum standard offer for candidates takingA-levels, many courses – particularly in the sciences – require at least one A* grade. More than 70% of applicants and over 90% of admitted students were awardedA*AA or better at A-level. 58.4% of admitted students achieved three A* grades or better at A-level.OTHERAAAA*AAA*A*AA*A*A* OR udents 8.4%A-level bands are based on results data obtained from UCAS and include results from the 2020 and 2019 examination rounds.Excludes General Studies and Critical Thinking, and candidates with fewer than three A-level results.sPAGE 4FOOTNOTE3. Table based on 25 largest courses.
UNIVERSITY OF OXFORD ANNUAL ADMISSIONS STATISTICAL REPORT 2021BREAKDOWN BY DOMICILE Applications from UK students and non-EU students have risen, and applications fromEU students have fallen. UK-domiciled applicants are substantially more likely to receive an offer of a place tostudy at Oxford than students from outside the UK. The proportion of students admitted who are from the UK has risen to 79.8%. Oxford does not operate quotas or targets around the nationality or domicile ofstudents admitted to the University. The exception is Medicine, which is subject to agovernment restriction on the number of students with international fee status whocan be admitted each year. The highest number of overseas applications and admitted students was from thePeople’s Republic of ChinaTable 1.3: Overall applications to Oxford, offers made and studentsadmitted by area of domicile, 2016–2020APPLICATIONSOFFERSSTUDENTS ADMITTEDPROPORTION OF TOTALAPPLICANTSPROPORTION OF TOTALSTUDENTS .7%80.6%APPLICATIONSOFFERSSTUDENTS ADMITTEDPROPORTION OF TOTALAPPLICANTSPROPORTION OF TOTALSTUDENTS ENTS ADMITTEDPROPORTION OF TOTALAPPLICANTSPROPORTION OF TOTALSTUDENTS .1%13.8%20164,53850340223.7%12.2%UK STUDENTSEU STUDENTSNON-EU STUDENTSPAGE 5
2021 UNIVERSITY OF OXFORD ANNUAL ADMISSIONS STATISTICAL REPORTTable 1.4: Countries/regions with the highest number of applications andstudents admitted to Oxford, three-year total 2018–2020COUNTRY/REGION OF DOMICILEAPPLICATIONSCOUNTRY/REGION OF DOMICILESTUDENTS ADMITTEDUK40,996UK8,110P R China4,900P R China425United States of America2,376Singapore187Singapore1,515United States of America184Hong Kong (SAR)1,345Hong Kong oland1,011Germany102FranceMalaysia815772Korea (South)Australia5449Canada724India47CONTEXTUK universities by domicile of studentsAll UK universities (2018 intake*)Russell Group (2018 intake*)Oxford University (2020 8.8%13.0%*Most recent available national data covers 2018 intake: defined as first-year, first-degree, undergraduate students, academic year 2018/19. Excludes those of unknown domicile.See page 39 for full citation.PAGE 6
UNIVERSITY OF OXFORD ANNUAL ADMISSIONS STATISTICAL REPORT 20212. Nation and regionThis section breaks down Oxford’s UK-domiciled undergraduate student total to show theregional distribution of the University’s applicants, offer holders and admitted students. The regional distribution of admissions to Oxford reflects population size, achievement inschool and application numbers. London and the South East made up 47.2% of UK applications between 2018 and 2020, and48.3% of students admitted; the rest of the UK made up 52.8% of applications and 51.7% ofstudents admitted.Table 2.1: Applications to Oxford, offers made and students admittedby UK nation and region, three-year total 2018–2020North EastNorth WestYorkshire & the HumberEast MidlandsWest MidlandsEasternGreater LondonSouth EastSouth WestWalesNorthern IrelandScotlandTOTALPROPORTION OF TOTAL PROPORTION OF TOTALUK APPLICANTSUK STUDENTS ADMITTEDAPPLICATIONSOFFERSSTUDENTS %0.9%1.6%REGION’S SHARE OFAAA %4.3%5.2%Applications to Oxford by UK nation and region, 2016–2020NATION AND REGIONNorth EastNorth WestYorkshire and the HumberEast MidlandsWest MidlandsEasternGreater LondonSouth EastSouth WestWalesNorthern . See page 8PAGE 7
2021 UNIVERSITY OF OXFORD ANNUAL ADMISSIONS STATISTICAL REPORTCONTEXTStudents admitted to Oxford by UK nation and region, 2016–2020NATION AND REGIONNorth EastNorth WestYorkshire and the HumberEast MidlandsWest MidlandsEasternGreater LondonSouth EastSouth WestWalesNorthern 54026885173167229138148206265790599322903447Number of students achieving AAA or better at A-level, broken down by UK nation and region*NATION AND REGIONNorth EastNorth WestYorkshire and The HumberEast MidlandsWest MidlandsEast of EnglandLondonSouth EastSouth WestWalesNorthern IrelandScotlandNUMBER OF STUDENTS ACHIEVING AAA OR BETTER AT A-LEVEL, BROKENDOWN BY UK NATION AND 1,2401,4651,775*First-year, first-degree, UK-domiciled undergraduate students, academic year 2018/19. Includes equivalent Scottish qualifications. See page 39 for full citation.PAGE 8
UNIVERSITY OF OXFORD ANNUAL ADMISSIONS STATISTICAL REPORT 2021What proportion of students achieves AAA or better at A-level in UK nations and regions?*NATION AND REGIONNorth EastNorth WestYorkshire and The HumberEast MidlandsWest MidlandsEast of EnglandLondonSouth EastSouth WestWalesNorthern IrelandScotlandWHAT PROPORTION OF STUDENTS ACHIEVES AAA OR BETTER AT A-LEVELIN UK NATIONS AND 9.9%4.5%*First-year, first-degree, UK-domiciled undergraduate students, academic year 2018/19. Includes equivalent Scottish qualifications. See page 39 for full citation.PAGE 9
2021 UNIVERSITY OF OXFORD ANNUAL ADMISSIONS STATISTICAL REPORT3. DisadvantageThis section focuses on the backgrounds of UK-domiciled students who apply toOxford, are made offers, and are admitted. The figures relate to differing levels ofsocio-economic advantage and progression to higher education across the UK, andare derived from the ACORN and POLAR5 demographic systems.ACORN is a postcode-based tool that categorises the UK’s population by levelof socio-economic advantage. POLAR is a similar tool that measures how likelyyoung people are to participate in higher education based on where they live. TheACORN and POLAR systems are widely recognised measures used by the regulatorto set admissions targets for universities including Oxford.These systems are explained in more detail in the glossary to this report.UNIVERSITY- LEVEL DATAThe tables below show the number of applications, offers and students admitted from thetwo most socio-economically disadvantaged groups (ACORN categories 4 and 56) and the twogroups of young people least likely to progress to higher education (POLAR quintiles 1 and 2). In 2020, 15.9% of UK students admitted to Oxford came from the two mostsocioeconomically disadvantaged groups (ACORN categories 4 and 56).This is an increase of 7.7 percentage points from 2016.Table 3.1: Socio-economic disadvantage: UK applications to Oxford, offers madeand students admitted from ACORN categories 4 and 56, 2016–2020APPLICATIONSOFFERSSTUDENTS ADMITTEDACORN 4 AND 5PROPORTION OFSTUDENTS 22168.2% In 2020, 15.6% of UK students admitted to Oxford were from the two groups with lowestprogression to higher education (POLAR quintiles 1 and 2). This is an increase of 4.2percentage points from 2016.Table 3.2: Areas of low progression to higher education: UK applications to Oxford, offersmade and students admitted from POLAR quintiles 1 and 2, 2016–2020APPLICATIONSOFFERSSTUDENTS ADMITTEDPOLAR 1 AND 2PROPORTION OFSTUDENTS 229911.4%FOOTNOTES5. POLAR classification is periodically reviewed. See page 37 for classifications used in this report.6. This data includes ACORN Category 4 – Financially Stretched (excluding Type 34 – Student flats and halls of residence) and ACORN Category 5 – Urban Adversity.7. Excluding students whose ACORN/POLAR status is not known.PAGE 10
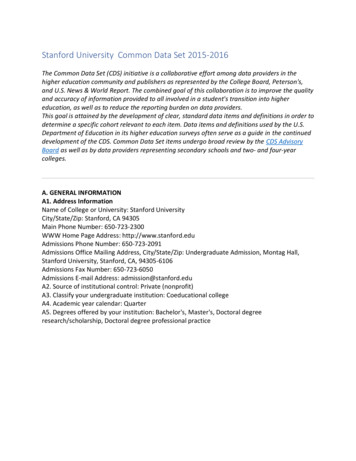
UNIVERSITY OF OXFORD ANNUAL ADMISSIONS STATISTICAL REPORT 2021CONTEXTBreakdown of students who achieve AAA or better at A-level bysocio-economic group (all UK universities, 2018 UK intake)*Oxford University (2020 UK intake)**LIVE IN MORE ADVANTAGED AREAS(OTHER ACORN CATEGORIES)LIVE IN LESS ADVANTAGED AREAS ( ACORNCATEGORIES 4 AND 5)87.5%12.5%84.1%15.9%*Most recent available national data covers 2018 intake: defined as first-year, first-degree, UK-domiciled undergraduate students, academic year 2018/19. AAA poolincludes equivalent Scottish qualifications. Excludes those whose ACORN status is not known. Excludes Type 34 from ACORN category 4 – Type 34 appears in ‘other ACORNcategories’. See page 39 for full citation.Breakdown of students who achieve AAA or better at A-level, byareas with different likelihood of progression to higher education(all UK universities, 2018 UK intake)*Oxford University (2020 UK intake)**FROM AREAS WITH GREATER LIKELIHOOD OF PROGRESSION TO HIGHEREDUCATION (OTHER POLAR QUINTILES)FROM AREAS WITH LOWER LIKELIHOOD OFPROGRESSION TO HIGHER EDUCATION(POLAR QUINTILES 1 AND 2)85.6%14.4%84.4%15.6%*Most recent available national data covers 2017 intake: defined as first-year, first-degree, UK-domiciled undergraduate students, academic year 2017/18. AAA poolincludes equivalent Scottish qualifications. Excludes those whose POLAR status is not known. See page 39 for full citation.**Excluding students whose ACORN/POLAR status is not known.PAGE 11
2021 UNIVERSITY OF OXFORD ANNUAL ADMISSIONS STATISTICAL REPORTDATA BY COURSEThese tables include figures for Oxford’s 25 largest courses by total number of places,aggregated from 2018 to 2020.Socio-economic disadvantage UK-domiciled students from less advantaged areas (ACORN categories 4 and 56) made up between5.3% and 26.5% of UK intakes from 2018 to 2020 for Oxford’s 25 largest courses.Table 3.3: Socio-economic disadvantage: UK applications to Oxford, offers made and studentsadmitted from ACORN categories 4 and 56 by course, three-year total 2018–2020ACORN 4 AND 5BiochemistryBiologyBiomedical SciencesChemistryClassicsComputer ScienceEarth SciencesEconomics & ManagementEngineering ScienceEnglishExperimental PsychologyGeographyHistoryHistory & PoliticsLaw*Materials ScienceMathematicsMathematics & Computer ScienceMedicineModern LanguagesMusicOriental StudiesPPE**PhysicsTheology and Religion*Including Law/Law with Studies in 21119514611APPLICATIONSOFFERSSTUDENTSADMITTEDACORN 4 AND 5 PROPORTION OFTOTAL UK STUDENTS .0%13.4%13.3%**Philosophy, Politics and EconomicsFOOTNOTES6. This data includes ACORN Category 4 – Financially Stretched (excluding Type 34 – Student flats and halls of residence) and ACORN Category 5 – Urban Adversity.7. Excluding students whose ACORN/POLAR status is not known.PAGE 12
UNIVERSITY OF OXFORD ANNUAL ADMISSIONS STATISTICAL REPORT 2021Areas of low progression to higher education UK-domiciled students from areas with low progression to higher education (POLAR quintiles 1 and 2)made up between 7.9% and 24.4% of UK intakes from 2018 to 2020 for Oxford’s 25 largest courses.Table 3.4: Areas of low progression to higher education: UK applications to Oxford, offers made andstudents admitted from POLAR quintiles 1 and 2 by course, three-year total 2018–2020POLAR 1 AND 2BiochemistryBiologyBiomedical SciencesChemistryClassicsComputer ScienceEarth SciencesEconomics & ManagementEngineering ScienceEnglishExperimental PsychologyGeographyHistoryHistory & PoliticsLaw*Materials ScienceMathematicsMathematics & Computer ScienceMedicineModern LanguagesMusicOriental StudiesPPE**PhysicsTheology and Religion*Including Law/Law with Studies in OLAR 1 AND 2 PROPORTION OF7TOTAL UK STUDENTS .1%12.6%24.4%**Philosophy, Politics and EconomicsFOOTNOTE7. Excluding students whose ACORN/POLAR status is not known.PAGE 13
2021 UNIVERSITY OF OXFORD ANNUAL ADMISSIONS STATISTICAL REPORTDATA BY OXFORD COLLEGEThe following tables – and similar tables throughoutthis report – include figures for 29 of Oxford’sundergraduate-admitting colleges, aggregatedfrom 2018 to 2020.Socio-economic disadvantageNote: Oxford’s colleges vary in size and subject provision, admitting between around50 and 120 UK-domiciled students each year. Permanent Private Halls (which havea different status to colleges and generally admit small numbers of students for alimited range of courses) and Harris Manchester College (which admits only maturestudents) have been excluded. Application numbers to individual colleges vary yearon year, as does the prior academic achievement of those applicants, which can leadto fluctuations in admissions figures between colleges and among particular groupsof students. Applicants to a particular college may be reallocated and eventuallyadmitted to another college as part of Oxford’s admissions process. An explanation ofthis system appears on page 38. From 2018 to 2020, the proportion of admitted students from less advantaged areas(ACORN categories 4 and 56) ranged by college from 5.9% to 19.2%Table 3.5: Socio-economic disadvantage: UK applications to Oxford, offers made and studentsadmitted from ACORN categories 4 and 56 by college, three-year total 2018–2020ACORN 4 and 5Balliol CollegeBrasenose CollegeChrist ChurchCorpus Christi CollegeExeter CollegeHertford CollegeJesus CollegeKeble CollegeLady Margaret HallLincoln CollegeMagdalen CollegeMansfield CollegeMerton CollegeNew CollegeOriel CollegePembroke CollegeSomerville CollegeSt Anne's CollegeSt Catherine's CollegeSt Edmund HallSt Hilda's CollegeSt Hugh's CollegeSt John's CollegeSt Peter's CollegeThe Queen's CollegeTrinity CollegeUniversity CollegeWadham CollegeWorcester CollegeUniversity total TIONSOFFERSADMITTEDACORN 4 & 5 PROPORTIONOF TOTAL UK NOTESPAGE 146. This data includes ACORN Category 4 – Financially Stretched (excluding Type 34 – Student flats and halls of residence) and ACORN Category 5 – Urban Adversity.7. Excluding students whose ACORN/POLAR status is not known.8. Total includes Permanent Private Halls and Harris Manchester College.
UNIVERSITY OF OXFORD ANNUAL ADMISSIONS STATISTICAL REPORT 2021Areas of low progression to higher education From 2018 to 2020, the proportion of admitted students from areas with low progression tohigher education (POLAR quintiles 1 and 2) ranged by college from 9.6% to 21.3%Table 3.6: Areas of low progression to higher education: UK applications to Oxford, offers made andstudents admitted from POLAR quintiles 1 and 2 by college, three-year total 2018–2020POLAR 1 AND 2Balliol CollegeBrasenose CollegeChrist ChurchCorpus Christi CollegeExeter CollegeHertford CollegeJesus CollegeKeble CollegeLady Margaret HallLincoln CollegeMagdalen CollegeMansfield CollegeMerton CollegeNew CollegeOriel CollegePembroke CollegeSomerville CollegeSt Anne's CollegeSt Catherine's CollegeSt Edmund HallSt Hilda's CollegeSt Hugh's CollegeSt John's CollegeSt Peter's CollegeThe Queen's CollegeTrinity CollegeUniversity CollegeWadham CollegeWorcester CollegeUniversity total TIONSOFFERSADMITTEDPOLAR 1 AND 2 PROPORTIONOF TOTAL UK ES7. Excluding students whose ACORN/POLAR status is not known.8. Total includes Permanent Private Halls and Harris Manchester College.PAGE 15
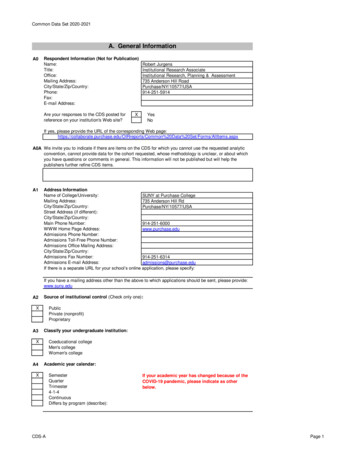
2021 UNIVERSITY OF OXFORD ANNUAL ADMISSIONS STATISTICAL REPORT4. School typeThis section shows the number of UK-domiciled students applying to, receiving offersfrom and admitted to Oxford by the type of school they attended: state or independent.UK-domiciled students applying from other types of school have been excludedfrom the tables below. This is because the group is small, constituting only 4.2% ofapplications (1,736) between 2018 and 2020, and includes students from overseas orunknown schools, making it difficult to draw reliable conclusions from the numbers.UNIVERSITY- LEVEL DATA The proportion of students admitted to Oxford from the UK state sector has risenfor the past four years, reaching 68.6% in 2020. This is the highest figure since theUniversity began recording detailed admissions statistics. The proportion of UK students admitted from the independent sector has decreased ineach of the past four years.Table 4.1: UK applications to Oxford, offers made and students admitted byschool type, TATE PROPORTION OF TOTALUK STUDENTS 568.6%62.3%60.5%58.2%58.0%CONTEXTBreakdown of students achieving AAA or better at A-level byschool type (all UK universities, 2018 UK intake)*Breakdown of students achieving A*A*A or better at A-level byschool type (all UK universities, 2018 UK intake)*Oxford University (2020 UK 1.4%*Most recent available national data covers 2018 intake: defined as first-year, first-degree, UK-domiciled undergraduate students, academic year 2018/19. AAA pool includesequivalent Scottish qualifications. Excludes unknown school type. See page 39 for full citation.FOOTNOTE9. Excluding students whose education cannot be classified as either state or independent.PAGE 16
UNIVERSITY OF OXFORD ANNUAL ADMISSIONS STATISTICAL REPORT 2021DATA BY COURSEThis table includes figures for Oxford’s 25 largest courses by total number of places,aggregated from 2018 to 2020. State-educated UK students represented between 35.6% and 83.9% of UK intakes from2018 to 2020 for Oxford’s 25 largest courses. Some courses attract more applications per available place than others, and UK statestudents apply disproportionately for the most oversubscribed subjects. On average, 37.7% of state applications between 2018 and 2020 were for five of themost oversubscribed subjects at Oxford (Economics & Management, Medicine, PPE**,Law*, and Mathematics), compared with 31.0% of independent applications. In contrast, 18.8% of independent applications were for five of the least oversubscribedsubjects (Classics, Music, Modern Languages, Chemistry, and English), compared with13.0% of state applications.Table 4.2: UK applications to Oxford, offers made and students admitted by schooltype and course, three-year total 2018–2020STATEBiochemistryBiologyBiomedical SciencesChemistryClassicsComputer ScienceEarth SciencesEconomics & ManagementEngineering ScienceEnglishExperimental PsychologyGeographyHistoryHistory & PoliticsLaw*Materials ScienceMathematicsMathematics & Computer ScienceMedicineModern LanguagesMusicOriental StudiesPPE**PhysicsTheology and Religion*Including Law/Law with Studies in TIONSOFFERSADMITTEDSTATE PROPORTION OF TOTALUK STUDENTS 7
subject and college. The highlights are as follows: over the past five years the proportion of students from state schools rose from 58% to 68.6%. The proportion identifying as Black and Minority Ethnic rose from 15.82% to 23.6%. The proportion from socio-economically disadvantaged areas rose from 8.2% to 15.9%.