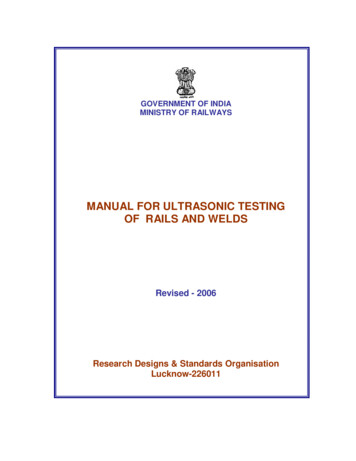
Transcription
Fabrication and Testing of the 1.2m SAO Primary MirrorPrepared byJohnathan Davis, Chang Jin Oh, Mario Rascon, Hubert Martin and Jeffrey KingsleySteward Observatory Mirror Lab and College of Optical Sciences,The University of ArizonaJuly 2, 2013
Contents1. Summary. 32. Coordinate system . 33. Mirror dimensions . 34. Mechanical and cosmetic quality . 45. Surface figure at completion of polishing . 55.1 Interferometric test and data processing . 55.2 CGH wavefront error evaluation . 65.3 Distortion correction and clear aperture verification. 85.4 Optical surface figure . 95.5 Structure function . 105.6 Optical Surface finish . 116. Mirror geometry . 136.1 Radius of curvature . 136.2 Conic constant . 146.3 Centration of optical axis . 147. Compliance Matrix . 15References . 16Appendices . 172
1. SummaryPolishing of the SAO 1.2m primary mirror was completed on June 21st 2013. Final optical testmeasurements conducted June 24th through June 27th, yielded a measured surface figure of 11.3nm RMSafter subtracting piston, tip/tilt, power and spherical aberration. The structure function specification hasbeen met by a significant margin for the lower and mid spatial frequencies while the higher frequenciesare at specification.2. Coordinate systemThe optical measurement coordinate system is defined such that the x-axis (0 ) is aligned betweencores B3 and C6 and the y-axis (90 ) is aligned with core A5 as in Figure 1. (Note that the drawing inFigure 1 is the BOTTOM VIEW.). This coordinate system was used for the definition of optical axiscentration and all optical surface maps in the report.Figure 1. Drawing of SAO 1.2 m primary mirror3. Mirror dimensionsThe mean thickness of the facesheet and backsheet were measured in the surface generating stageusing ultra sonic thickness measurement device. Both mean thickness of facesheet are out of specificationand marked in red.The outer edge thickness appears to be at the edge of its tolerance, but the measured radius ofcurvature shows that the mirror surface has the correct sag.3
Table 1. Measured dimensionsDimensionNominalMeasuredFront facesheetOuter Diameter (mm)1219.2 11219.9Inner Diameter (mm)330.2 2330.728.0 125.8Outer Diameter (mm)1219.2 11219.9Inner Diameter (mm)330.2 2330.425.4 127.1Vertex Thickness (mm)166.4 2166.98Outer Edge Thickness (mm)205.5 2207.50.230.1Mean Thickness (mm)BackplateMean Thickness (mm)Mirror thicknessWedge (TIR at OD; mm)4. Mechanical and cosmetic qualityDocument UASO 30125-TS-1 requires that all scratches that exceed 0.100 mm in width becatalogued. The document also requires that bubbles less than 10 mm in diameter must be treated. Allcatalogued scratches and bubbles that meet this criterion can be found in Table 2 and Table 3. (Full list ofTable 3 is in Appendix B)Table 2. Documented scratches in mirror clear aperture.Location (Core #)Length (mm)Width (mm)CommentB1F65070.10.1From grindingBubble dressingTable 3. Partial list of bubbles in mirror clear 063.1401.76612.5603.1403.1400.785A total of 89 bubbles were catalogued. All bubbles were treated in effort to minimize their effecton the polishing process. The total area encompassed by the bubbles was calculated in an effort todemonstrate the net light loss to the clear aperture. These results can be found in Table 4.4
Table 4. Total area encompassed by bubbles in the clear apertureTotal number of bubblesTotal area from bubbles (mm2)Total area of mirror (mm2)Percent loss from bubbles (%)89319.841019636.500.035. Surface figure at completion of polishing5.1 Interferometric test and data processingThe final SAO mirror figure measurements were made on the polishing support which duplicated theforce set of the telescope cell. The mirror was polished and measured with the telescopes circumferentialload spreaders in place in order to account for their additional mass with respect to the mirror and thepolishing support.The mirror was allowed to thermally equilibrate for a total of 48 hours after the last polishing run.While in polishing, the mirror was given 14 to 16 hours for acclimation and the measurementrepeatability was 5 to 8 nm RMS between measurements.Optical layout of the interferometric testing set up is in Figure 2 and the actual configuration isshown in Figure 3. As shown in the photo the test set up consists of the 4020 Phasecam (4D Technology)and a computer-generated hologhram as a null corrector. The mirror was measured at 8 clockingorientations from 0 to 360 with 100 frames at each orientation. Then the measured data were averagedafter matching the orientation in order to remove the artifacts created from the interferometer, CGH andenvironment.LayoutSAO Primary Mirror Test with a CGH7/5/2013Total Axial Length: 4553.90800 mmFigure 2. Optical layoutM1 surf, CGH designed, dblpass - Final.ZMXConfiguration 1 of 15
Interferometer andstage assemblyCGHSAO mirrorFigure 3. Interferometric testing set up5.2 CGH wavefront error evaluationThe CGH used for the interferometric test of the SAO mirror is patterned in 6” substrate and thesubstrate error was evaluated under the Wyko 6000 interferometer as in the Figure 4.Figure 4. CGH wavefront error evaluation6
-36-36mmmm200Same as the mirror testing, the CGH wavefront map has0 been clocked to 8 different orientationsby 45 and averaged. From the averaged map we observed error of 21.9nm RMS dominated mostlyby power36as in Figure 5. Note that all the artifacts from the fiducials in the CGH36 are masked out. Theamount of power, 21.9 nm RMS, is yet small and it correspondstolessthan1.5 µm spacing change-2between the CGH and the mirror. Spherical aberration in the CGH is 0.26 nm RMS as in Figure 6and it is negligible. After power and spherical aberration were removed, the residual wavefront error,72 be observed in surface figure, is 2.0 nm RMS and statistical evaluation72which willis shown in Figure-3603672-3607.mmmm-3Slope X Map (µm/mm)10Surface xMap(µm)-3Slope Y Map ce Map (µm)-360mm3672x 036036722-36-360-3Slope Magnitude Map (µm/mm)0.05-36-350mmmm-36-360-36-13672Slope Y Map (µm/mm)x 10 00mmmmSlope X Map 360Figure 5. CGH Wavefront asked)mmmm-5Slope X Map (µm/mm)72Slope Magnitude Map (µm/mm)x 10436-5Slope Y Map (µm/mm)x 10Surface Map(µm)36367272Slope Magnitude Map (µm/mm)x 100.010-3636mm72mmmm00mm3600-57272Surface Map (µm)-360mm36720Slope Magnitude Map (µm/mm)36x 672-0.0172-360mm2367272-360mm36Figure 6. Spherical aberration in CGH772
3636-2-472-360mm36Surface Map(µm)x 10-3Slope X Map (µm/mm)-360mm36Slope Magnitude Map (µm/m-3Slope Y Map (µm/mm)x 0-27272Surface Map (µm)-36-360mm3672Slope Magnitude Map (µm/mm)0.010mm0mmmm2-40-3x Figure 7. Residual CGH wavefront error map (Piston, tilt, power and spherical aberrationremoved)5.3 Distortion correction and clear aperture verificationVerification of the clear aperture of the mirror was accomplished through the use of fiducials andproper distortion correction. To correct imaging distortion of the testing, fiducials were layed out on theoptical surface of the mirror as in Figure 8 and the locations of each fiducial were measured using a lasertracker as in the Figure 9.Figure 8. SAO mirror and fiducials836
600400y (mm)2000-200-400-600-600-400-2000x (mm)200400600Figure 9. SAO mirror fiducial layout for distortion correctionTo verify clear aperture three fiducials are placed on the circle of 1200 mm diameter as in Figure 10.Figure 10. Modulation map shows three fiducials to verify clear aperture5.4 Optical surface figureThe figure of the SAO 1.2m mirror is shown in Figure 11. The aperture defined has a 1200mm outerand 356mm inner diameter. The surface map indicated in Figure 11 has Piston, Tip/Tilt, Focus, Sphericaland Coma subtracted. The amount of coma present in the mirror will later be related to the amount ofdecenter between the optical axis and mechanical axis. This value of decenter was found to be withinspecification; therefore Coma does not need to be included in the surface RMS calculation. The map is an9
0mm00300300-5average of 8 angular orientations rotated by 45 . The optical test was conducted after an acclimationperiod of 60048 hours. Air handlers in the vicinity of the mirror were shut off in an effortto reduce air600turbulence in the optical-300path. The 0mirror surfaceis 11.3 nm RMS.300 error 600-3000mmmmSurface Map (µm)-3Slope X Map (µm/mm)Slope Magnitude Map (µmSlope Y Map (µm/mm)x 3000mm300600600Surface Map (µm)-3000mm300600mmmm-3x 1010mm30000-3Slope Magnitude Map (µm/mm)x 000mm0-0.1600 00mm600Figure 11. SAO 1.2 m mirror surface figure5.5 Encircled energy and structure functionFigure 12 shows the surface map, point spread function and encircled energy at 500 nm for the actualmirror in perfect seeing and same quantity in 0.25 arcsec seeing. It is calculated over the clear apertureand 80% of the light is contained in a diameter of 0.32 arcsec.RMS surface: 10.0nmAperture radius: 600mmLog scale of PSFLog scale of PSF with seeing-600-3-3-400-2-2-200-1-1Encircled 220.30.2Without seeingWith 1233-3-2-10arcsec123000.20.40.6arcsec0.81Figure 12. Encircled energyThe specification for the SAO primary mirror corresponds to 0.12 arc second seeing and 2%scattering loss at 500 nm per the document UASO 30125-TS-1. Structure function has been evaluatedusing the final processed map in Figure 11 and the results are in Figure 13.10300
Surface Figure: 11.3nm 0.06-0.08600-3000mm300600-0.1Structure FunctionSAO Spec110-2102-10101021010Structure FunctionSAO SpecStructure FunctionSAO Spec1110-210-11001010-210-110010Figure 13. Structure function analysis of SAO mirror. (Three iterations were conducted todemonstrate repeatability.)5.6 Optical surface finishThe optical surface finish of the SAO 1.2m mirror was measured with the MicroFinish Topographer(MFT) instrument in order to determine the microroughness down to the angstrom level. The MFTinstrument, pictured in Figure 14, is essentially an interferometer with a small FOV of 1.1mm 8mm.This tool is very effective at resolving microscopically small surface structure. Document UASO 30125TS-1 requires that the SAO 1.2m mirror surface finish be 20Å RMS or better.Figure 14. MFT instrument used for measuring surface microroughness11
The SAO mirror’s optical surface finish was measured in 6 locations, each with a different radial orclocking location. The measurement locations are depicted in Figure 15 where the cores A1, A2, A3, E2and rib sections D1-D2, D2-D3 were sampled. The selected radial locations allow for a sample pointevery 75mm radially. Outer most and inner most sample locations were approximately 50mm from theirrespective edge relative to the ID or OD of the mirror. Measurement results indicate that the SAO mirrorcurrently meets the microroughness specification of 20Å with an average microroughness of 17Å.Figure 15. Microroughness measurement locations on SAO mirrorThe surface roughness values for each measurement location are listed in Table 5. The resultswere a random distribution indicating that no particular radial zone on the mirror was more polished thanany other. These results are consistent with the surface microroughness typically expected from a ceriumoxide polishing compound and 64-pitch combination.Table 5. Surface roughness measurementCoreA1A2A3D1/D2D2/D3E2AverageSurface RMS (Å)15.818.518.118.213.815.016.6In Figure 16 a topographical map of the surface microroughness is depicted for the highest andlowest values, which were found in core A2 and rib D2/D3 respectively.12
A2 18.5ÅD2/D3 13.8ÅFigure 16. MFT measurements of surface roughness analyzed in 4Sight 2.46. Mirror geometry6.1 Radius of curvatureThe spacing between the CGH and the mirror was measured using T3 laser tracker with 0.5” spheremounted retroreflector (SMR) as in Figure 17. The measured spacing is 4317.538 mm with 50 µmuncertainty. The spacing between the focus of interferometer and the CGH was not measured butevaluated using power in alignment pattern in the CGH. With the measured value, reoptimization wasperformed with the optical model in Zemax and the Radius of Curvature of 4590.244mm was obtained.CGH40003500Laser 00-500Figure 17. Spacing measurement using a laser tracker13
6.2 Conic constantThe Conic constant was evaluated from the residual 3rd order spherical aberration, -0.0019 µm fromthe measurement, which is expressed as S (6 4 6 2 1) , where r /( D / 2) is the normalized radiusand S is the Zernike coefficient for surface error. The relation between S and conic error k is k 6144 f 3S,Dwhere f 1.91 is the focal ratio and D 1200 mm. The resulting conic error from residual sphericalaberration in measurement, k is -0.000068.An error in radius of curvature also introduces an error in the conic constant determined from thenull test. The relation between radius of curvature error and conic error is k R, kRwhere measured R -0.626 mm and nominal k -1.040231. The resulting conic error from radiuscurvature error, k is -0.00014.Therefore the conic constant error of the SAO mirror is -0.000072 and the estimated conicconstant, k is -1.040303.6.3 Centration of optical axisIn order to evaluate the amount of decenter between the mechanical OD and optical axis of themirror, the Coma coefficients that measured at 0 and 180 were used. The first step of the measurementprocess is to center the mechanical OD of the mirror relative to rotary table axis. This is accomplishedusing conventional dial indicator metrology. We found that the mechanical OD was decentered from theturntable axis by 75 microns toward 329 in the mirror coordinate system. We included this displacementin the calculation of the decenter of the optical axis.The relation between decenter of the optical axis and coma is x 384 f 3C0 y 384 f 3C90where C0 and C90 are the Zernike coefficients for the 2 components of coma in the surface, and the 2polynomials are (3 3 2 2 )cos and (3 3 2 2 )sin for normalized polar coordinates ( , ) on themirror.Figure 18 shows the measurements at 0 and 180 and corresponding Zernike Coma coefficients.14
0 180 4-0.4-0.6-0.6600µm-300600-3000mm300600C0 -0.020C90 0.016-3000mm300600C0 -0.232C90 0.053Figure 18. Measured Coma at 0 and 180 Due to the large 180 rotational change, the tilt fringe density in the optical measurement reacheda level in which phase unwrapping errors. To mitigate this problem, the interferometer was decenteredand the effect of decentering the interferometer led to a 100 nm uncertainty in the coma coefficients. Thisamount of uncertainty in Coma was translated to 0.30 mm in decenter uncertainty.The evaluated optical axis decenter is shown in Table 6.Table 6. Optical axis location reference to the OD of mirrorDecenter in xDecenter in yNet decenterDirection0.37-0.160.40-23.4 0.30 0.30 0.45mmmmmmdegreesThe Coma measurement indicates that the mechanical axis and optical axis are aligned to eachother within the required specification of 1.00mm. These measurements were repeated 3 times andyielded variability in net decenter of less than 50 µm.7. Compliance MatrixThe compliance matrix of the SAO 1.2m mirror is listed in Table 7 in accordance with documentUASO 30125-TS-1 and Drawing 20253 Rev E.15
Table 7. Compliance matrixItemRadius of Curvature, RConic Constant, kClear Aperture (OD/ID)Surface FigureSurface FinishOA CentrationSpecification (Tolerance)4590.870( 1.0mm)-1.040231( 0.0002)1194mm/356mmSee Structure Function Chart20Å RMS1mmAs-Built (Uncertainty)4590.244mm (50μm)-1.040303 (0.00001)1200mm/356mmSee Structure Function Chart17Å RMS0.4mm ( 0.42mm)ComplianceYESYESYESYESYESYESReferences1. Technical Specifications of SAO 1.2m Mirror (UASO 30125-TS-1)2. Drawing of SAO 1.2m Mirror (DWG 20253 Rev E)16
Appendix A: Surface mapSurface Figure: 11.3nm 6-0.08600-3000mm300600-0.117
Appendix B: Table 3. Full list of bubbles in mirror clear .9061.7663.14018
polishing support. The mirror was allowed to thermally equilibrate for a total of 48 hours after the last polishing run. While in polishing, the mirror was given 14 to 16 hours for acclimation and the measurem