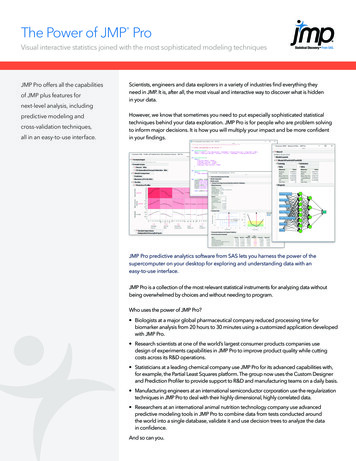
Transcription
PharmaSUG 2014 - Paper PO15Evaluating the benefits of JMP for SAS programmersXiaopeng Li, Celerion, Lincoln, NEChun Feng, Celerion, Lincoln, NENancy Wang, Celerion, Lincoln, NEABSTRACT JMP is a user friendly software for creating figures in clinical research. For SAS programmers, JMP also provides a convenient way to do quality control (QC) of listings, tables, and figures (TFLs). Additionally, using JMP for QC is analternative way to verify statistical analysis results, a quick way to verify SAS code for statistical analysis tables, and a way to do QC documentation. This paper provides details about what supports and benefits JMP can provide for SASprogrammers.INTRODUCTION JMP software is known for generating figures quickly and helping programmers/nonprogrammers to understand the data better. JMP is a user-friendly interface platform. It is a great assistant for scientists and engineers in terms of data visualization. Even without SAS coding knowledge, a figure can be easily generated by pointing-and-clicking, pulling invariables of interests, and choosing available options to customize outputs. In clinical trial research, more and more people start using JMP . It helps not only scientists understand data quickly, but also helps SAS programmers in manyways.BENEFITSQUICK REVIEW AND QC FOR FIGURESIn the early phases of clinical trial research, pharmacokinetics (PK) is one of the main focuses. Figures display datatrends and PK analytical results graphically which provide initial impression on data distribution. Good figures provide good understanding of the data and help guide further analysis. To generate figures by using SAS graphic procedurescan be challenging. Especially, while dealing with multiple treatments or challenging data or highly specialized figures, it can be very time-consuming and error prone to program with SAS codes. It is more efficient for SAS programmer to create a quick figure for review purpose by using JMP .SAS has several ways to import data sets, such as PROC IMPORT, INFILE and other methods. All of these methodsneed to specify the location of input files. Some methods need to define variable names, variable types, or formats. Some methods can only read in certain types of files. Reading data into JMP is convenient comparing to SAS . JMP can read in all the file types that SAS can. In addition, users do not need specify file types and define variable names or format. By dragging a file into JMP home window, JMP automatically reads and opens the file in a JMP window (Figure 1). In Figure 1, JMP provides a clear display of this data. The information of file name, file location, variablenames, variable labels, the types of variables all shows in this window.1
Evaluating the benefits of JMP for SAS programmers, continuedFigure 1. test data read in JMP In JMP , many types of figures can be created. In Graph tab in Figure 1(red circle), JMP provides chart, overlay plot,scatterplot in 3D, contour plot, bubble plot, parellel plot, cell plot, tree plot, scatter matrix, ternary plot, profiler, contour profiler, surface plot, mixture profiler, custom profiler and excel profile. JMP also has graph builder assistant (Figure 2)which can build customized graphes.Figure 2. graph builder2
Evaluating the benefits of JMP for SAS programmers, continued For example, JMP users can choose graph builder to create a mean figure based on the data in Figure 1. By draggingthe concentration variable into y-axis and pulling nomial hour into x-axis, a figure with individual concentrations shownas dots and mean concentrations over hour shown as the blue line across the figure is generated (Figure 3).Figure 3. individual and mean concentrations To read in data and generate a similar draft figure above in SAS can take relatively longer time comparing to JMP . JMP saves time for SAS programmers to generate draft graphs used for scientists’ decision making. JMP also provides an easy way for SAS programmers to QC the graphs created by SAS . As examples shown below,by using graph builder assistant, a mean and an individual by treatment graph can be generated (Figure 4) to QC the graphs which are generated from SAS (Figure 5).Figure 4. mean and individual graphs by treatment by JMP3
Evaluating the benefits of JMP for SAS programmers, continuedFigure 5. mean and individual graphs by treatment from SASQUICK REVIEW AND QC FOR TABLES AND LISTINGS Creating descriptive statistics for tables is an important task for SAS programmers. JMP provides two methods togenerate summary information. The first method is using the tabulate option of tables menu to generate summaryinformation. In the tabulate window (Figure 6), summary statistics can be generated and used for QC. By pulling theinterested variables into the table in tabulate window and selecting the descriptive statistics, the descriptive statisticalsummary is created (Figure 7).Figure 6. tabulate window4
Evaluating the benefits of JMP for SAS programmers, continuedFigure 7. tabulate window resultThe second method is using the summary option of tables tab. Summary information can also be created in thesummary window (Figure 8). By single-click the interested variable from select columns, choosing the statistical summaries from statistics and choosing grouping variables, a summary data will be created (Figure 9). JMP providestwo alternate methods to QC descriptive statistical summary for tables.Figure 8. summary window5
Evaluating the benefits of JMP for SAS programmers, continuedFigure 9. summary data created by summary windowVERIFY STATISTICAL ANALYSIS PROGRAMSStatistical analysis results are one of the most important results for clinical research studies. Biostatisticians and SAS programmers can verify the statistical analysis results based on statistical outputs from SAS . Though doubleprogramming is a preferred method to verify the accuracy of the statistical analysis, it is relatively time-consuming. JMP can be used as a double programming QC on statistical analysis results and verifies SAS statistical model codes. Fit model option in analyze (Figure 10) menu can be used to create alternate SAS outputs and verify the SAS statistical model codes. JMP provides many options to support creating statistical analysis model. By selecting thedependent variable in Y column, specifying the analysis group in by column, defining independent variables and random variables in construct model effects column and choosing other options, JMP will provide statistical analysisoutputs (Figure 11). These statistical outputs provide SAS programmers and biostatisticians another resource to verify the statistical analysis results from SAS .Figure 10. Fit Model window6
Evaluating the benefits of JMP for SAS programmers, continuedFigure 11. statistical output from JMP Fit model option can also be employed to QC the SAS statistical model codes. The SAS codes can be created byselecting the red bottom of model specification (in Figure 10) and then choosing create SAS job (Figure 12).Figure 12. SAS codes created by JMP QC DOCUMENTATION Documentation is important in clinical research industry. When SAS programmers use JMP as a QC tool, JMPprovides required documentation as well. In the tabulate window, created descriptive statistical summary table can be saved by using “Make Into Data Table” option and a new JMP file will be created (Figure 13). Save the new JMP file,then it can be considered as a QC document.7
Evaluating the benefits of JMP for SAS programmers, continuedFigure 13. descriptive statistical summary table by JMP Additionally, all results from JMP can be saved as JMP report file from the tool bar (the red circle in Figure 14). Thesetwo methods support QC documentation.Figure 14. result of statistical analysis outputCONCLUSION In summary, JMP provides programmers an efficient and reliable QC method. First, JMP provides a quick way tocreate figures based on different file types of data sets. It provides a virtual image to review and QC figures. Second, JMP provides alternate ways to check summary statistical results in tables. Instead of double programming in SAS or checking numbers in EXCEL , JMP is a good supplement tool for programmers to perform QC functions. Third, based on the functions from JMP , statistical analysis results can be generated efficiently. JMP provides another way to generate statistical results in using different platform other than SAS . Additionally, JMP can save all the resultsmentioned above as QC documentation.8
Evaluating the benefits of JMP for SAS programmers, continuedREFERENCES JMP website. Available at http://www.jmp.com/Chun Feng, Xiaopeng Li, Nancy Wang and John Brejda, JMP Start Biostatisticians’ Quality Check on AnalyticalResults, American Statistical Association Conference on Statistical Practice, 2014 Feb.CONTACT INFORMATIONYour comments and questions are valued and appreciated. Contact the author at:Xiaopeng LiCelerion Inc.621 Rose Street Lincoln, NE 68502Work Phone: (402)437-6260Email: xiaopeng.li@celerion.comSAS and all other SAS Institute Inc. product or service names are registered trademarks or trademarks of SAS InstituteInc. in the USA and other countries. indicates USA registration.Other brand and product names are trademarks of their respective companies.9
programmers can verify the statistical analysis results based on statistical outputs from SAS . Though double programming is a preferred method to verify the accuracy of the statistical analysis, it is relatively time-consuming. JMP can be used as a double programming QC on statistical analysis results and verifies SAS statistical model codes.