Transcription
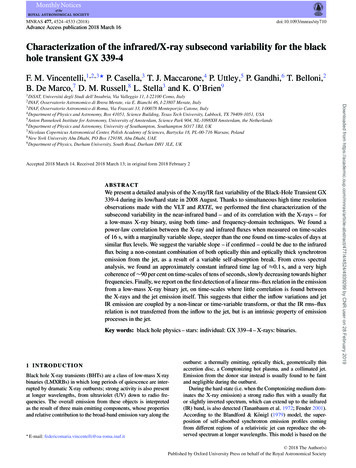
MNRAS 477, 4524–4533 (2018)doi:10.1093/mnras/sty710Advance Access publication 2018 March 16Characterization of the infrared/X-ray subsecond variability for the blackhole transient GX 339-4F. M. Vincentelli,1,2,3‹ P. Casella,3 T. J. Maccarone,4 P. Uttley,5 P. Gandhi,6 T. Belloni,2B. De Marco,7 D. M. Russell,8 L. Stella3 and K. O’Brien91 DiSAT,Accepted 2018 March 14. Received 2018 March 13; in original form 2018 February 2ABSTRACTWe present a detailed analysis of the X-ray/IR fast variability of the Black-Hole Transient GX339-4 during its low/hard state in 2008 August. Thanks to simultaneous high time resolutionobservations made with the VLT and RXTE, we performed the first characterization of thesubsecond variability in the near-infrared band – and of its correlation with the X-rays – fora low-mass X-ray binary, using both time- and frequency-domain techniques. We found apower-law correlation between the X-ray and infrared fluxes when measured on time-scalesof 16 s, with a marginally variable slope, steeper than the one found on time-scales of days atsimilar flux levels. We suggest the variable slope – if confirmed – could be due to the infraredflux being a non-constant combination of both optically thin and optically thick synchrotronemission from the jet, as a result of a variable self-absorption break. From cross spectralanalysis, we found an approximately constant infrared time lag of 0.1 s, and a very highcoherence of 90 per cent on time-scales of tens of seconds, slowly decreasing towards higherfrequencies. Finally, we report on the first detection of a linear rms–flux relation in the emissionfrom a low-mass X-ray binary jet, on time-scales where little correlation is found betweenthe X-rays and the jet emission itself. This suggests that either the inflow variations and jetIR emission are coupled by a non-linear or time-variable transform, or that the IR rms–fluxrelation is not transferred from the inflow to the jet, but is an intrinsic property of emissionprocesses in the jet.Key words: black hole physics – stars: individual: GX 339–4 – X-rays: binaries.1 I N T RO D U C T I O NBlack hole X-ray transients (BHTs) are a class of low-mass X-raybinaries (LMXRBs) in which long periods of quiescence are interrupted by dramatic X-ray outbursts; strong activity is also presentat longer wavelengths, from ultraviolet (UV) down to radio frequencies. The overall emission from these objects is interpretedas the result of three main emitting components, whose propertiesand relative contribution to the broad-band emission vary along the E-mail: federicomaria.vincentelli@oa-roma.inaf.itoutburst: a thermally emitting, optically thick, geometrically thinaccretion disc, a Comptonizing hot plasma, and a collimated jet.Emission from the donor star instead is usually found to be faintand negligible during the outburst.During the hard state (i.e. when the Comptonizing medium dominates the X-ray emission) a strong radio flux with a usually flator slightly inverted spectrum, which can extend up to the infrared(IR) band, is also detected (Tananbaum et al. 1972; Fender 2001).According to the Blandford & Königl (1979) model, the superposition of self-absorbed synchrotron emission profiles comingfrom different regions of a relativistic jet can reproduce the observed spectrum at longer wavelengths. This model is based on the C 2018 The Author(s)Published by Oxford University Press on behalf of the Royal Astronomical SocietyDownloaded from 7/4/4524/4939299 by CNR user on 28 February 2019Universitá degli Studi dell’Insubria, Via Valleggio 11, I-22100 Como, ItalyOsservatorio Astronomico di Brera Merate, via E. Bianchi 46, I-23807 Merate, Italy3 INAF, Osservatorio Astronomico di Roma, Via Frascati 33, I-00078 Monteporzio Catone, Italy4 Department of Physics and Astronomy, Box 41051, Science Building, Texas Tech University, Lubbock, TX 79409-1051, USA5 Anton Pannekoek Institute for Astronomy, University of Amsterdam, Science Park 904, NL-1098XH Amsterdam, the Netherlands6 Department of Physics and Astronomy, University of Southampton, Southampton SO17 1BJ, UK7 Nicolaus Copernicus Astronomical Center, Polish Academy of Sciences, Bartycka 18, PL-00-716 Warsaw, Poland8 New York University Abu Dhabi, PO Box 129188, Abu Dhabi, UAE9 Department of Physics, Durham University, South Road, Durham DH1 3LE, UK2 INAF,
Multiwavelength timing analysis of GX 339-4are several spectral components that can emit in those bands. Thiscomplication is less important at longer wavelengths, where the jetis expected to dominate the emission. It was indeed, thanks to fastphotometry observations performed in the IR band, that the firstunambiguous presence of a rapidly varying jet emission was foundin GX 339-4 (Casella et al. 2010). During the low-hard state of thesource, these authors found intrinsic variability up to 8 Hz, strongenough to be inconsistent – for brightness-temperature reasons –with any kind of thermal emission. Moreover, through simultaneousobservations made with the Rossi X-ray Timing Explorer (RXTE),a strong correlation between the IR and the X-ray light curve wasmeasured with an IR lag of 100 ms. This was interpreted within ascenario in which the variability propagates from an X-ray emittingregion (either the hot inflow or the base of the jet) along the jet andthen re-emitted as synchrotron radiation (it is unclear whether this isoptically thin or thick emission). The recent discovery of an 0.1 soptical/X-ray lag in the BHT V404 Cygni (Gandhi et al. 2017) isa clear confirmation of this scenario, which also allows us to putconstrains on the physical scale over which plasma is acceleratedin the inner jet.In this paper, we present a more detailed characterization ofthe X-ray/IR variability of the same data set used by Casella et al.(2010), in order to better understand the way in which the variabilityis transferred along the jet, and investigate what is the jet emissionmechanism. The paper is organized as follows: after a description ofthe data set, in Section 3.1 we present an X-ray/IR flux–flux diagramcomputed at high time resolution (16 s); in Section 3.2 we show theresults of Fourier analysis (including cross-spectral techniques),while in Section 3.3 we report the first rms–flux relation computedin the IR band. Possible physical implications are discussed inSection 4.2 O B S E RVAT I O N SThe analysis carried out for this work is based on X-ray and IRsimultaneous observations of the BHT GX 339-4 carried out on2008 August 18 (MJD 54696), during the beginning of the decayof a short-lived hard-state-only outburst (Kong 2008; Russell et al.2008). The RXTE satellite performed simultaneous observations inthe X-rays for three consecutive satellite orbits, for a total of 4.6ks. Three intervals (corresponding to the periods in which RXTEcould observe the source) of simultaneous X-ray and IR data wereobtained (Fig. 1).2.1 Infrared dataThe IR data were collected with an 16 ks long fast-photometryobservation, made with the Infrared Spectrometer And Array Camera (ISAAC), mounted on the 8.2-m UT-1/Antu telescope at ESO’sParanal Observatory (Moorwood et al. 1998). The data were collected using the FastPhot mode in KS band (central wavelength: 2.16µm; width: 0.27 µm). The integration time (DIT) of the observationwas 62.5 ms. Each frame was stored and stacked in a ‘data cube’ of2500 slices (corresponding to segment of IR data of 156.25 s). Thelength of the gaps between each cube is 3 s long.The field of view consisted of a 23 arcsec 23 arcsec square,approximately centred on the target GX 339-4, and included a brightreference star (KS 9.5), and a fainter comparison star (KS 12.8),located, respectively, 13.6 arcsec South and 8.9 arcsec North-Eastof the target.The light-curve extraction was done using the ULTRACAM datareduction software tools (Dhillon et al. 2007). Standard apertureMNRAS 477, 4524–4533 (2018)Downloaded from 7/4/4524/4939299 by CNR user on 28 February 2019fundamental assumption that the energy of the electrons is continuously replenished, in order to balance the radiative and adiabatic energy losses. The mechanism providing such energy remains unclear,although a few ideas have been proposed. A possible solution couldcome from the conversion of Poynting flux into internal energythrough magnetic reconnection (Lyubarsky 2010). An alternativesolution involves internal shocks, by analogy with the model originally proposed to explain the variability observed in gamma-raybursts (Kobayashi, Piran & Sari 1997) and in blazars (Spada et al.2001). This idea has been applied recently to the less-energetic caseof jets in BHTs (Jamil, Fender & Kaiser 2010; Malzac 2013), withencouraging results from both the spectral and the timing point ofview. According to these models, shells of plasma are continuouslyejected into the jet with variable velocities. Due to the differenceof velocity, the shells eventually collide and merge: the resultingshocks can convert part of the differential kinetic energy of theshells into internal energy, re-accelerating the electrons so as to– at least partially – balance the energy losses. A key predictionis the presence of strong variability in the optical-infrared (OIR)emission from the jet, also on subsecond time-scales, plausibly correlated with the variability observed in the X-rays from the inflow(Malzac 2014; Drappeau et al. 2015).The connection between the inflow and the jet in BHTs has beeninvestigated by different authors, with a growing number of studiesfocusing on the properties of the OIR variability of XRBs and itscorrelation with the X-rays (Eikenberry et al. 1998; Mirabel et al.1998; Kanbach et al. 2001; Spruit & Kanbach 2002). A turningpoint in this respect was the discovery, in the early 2000s, of theexistence of correlations – on time-scales of hours – betweenthe X-ray and the radio and/or IR luminosity during the hard state(Hannikainen et al. 1998; Corbel et al. 2003; Gallo, Fender & Pooley 2003). In the same years, the first detailed characterization of thefast X-rays/optical-UV variability was obtained for the BHT XTEJ1118 480 [Kanbach et al. (2001) and Malzac et al. (2003) for theoptical, and Hynes et al. (2003) for the UV]. All the measured crosscorrelation functions (CCFs) indicated that the X-ray radiation ledthe O-UV variability, showing, however, also complex trends. Aninteresting feature was measured in the optical/X-ray CCF, wherea small anticorrelation at negative lags was found: this was interpreted in terms of the jet (emitting in the optical) and the accretionflow being powered by the same magnetic energy reservoir (Malzac,Merloni & Fabian 2004). Such a model also reproduces the observations made by Hynes et al. (2003), if a major contribution fromreprocessing is also assumed to be present in the UV.After the identification of an optical/X-ray subsecond lag in GX339-4 during the 2007 outburst (Gandhi et al. 2008), a further, complete characterization of the optical/X-ray variability was then madeby Gandhi et al. (2010). The optical power spectrum showed a complex broad-band noise structure, with a Quasi Periodic Oscillation(QPO) at 0.05 Hz (while, there was no clear evidence of a QPO inthe X-rays). Such complexity was reflected also in the correlationbetween the two bands. The CCF showed a sharp asymmetric peakat small lags, and a broader structure for lags 10 s. In the frequencydomain, the time lags showed that the optical emission lagged theX-rays by 10 s on long time-scales; a constant optical lag of 0.1 swas instead present on shorter time-scales (ν 0.1 Hz). The authors interpreted the optical emission on long time-scales in termsof reprocessing from the outer disc, and claimed the presence of anoptically emitting relativistic jet for the fast variability.Such a complex observational picture makes it very difficult tohave a clear idea of the origin of the emission in the optical/UV.This puzzling phenomenology probably is due to the fact that there4525
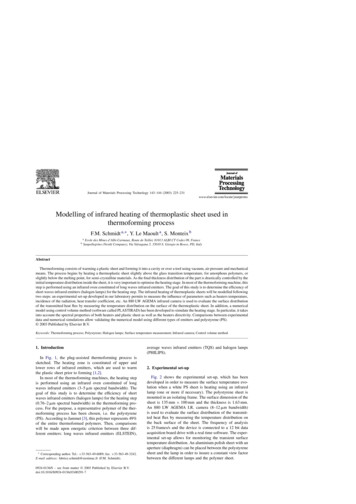
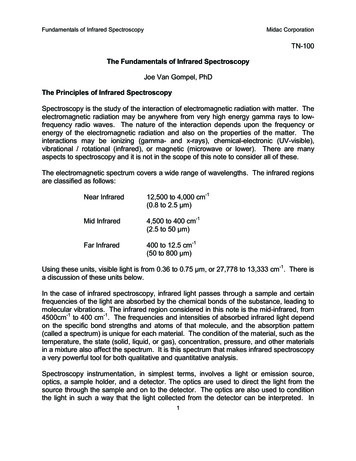
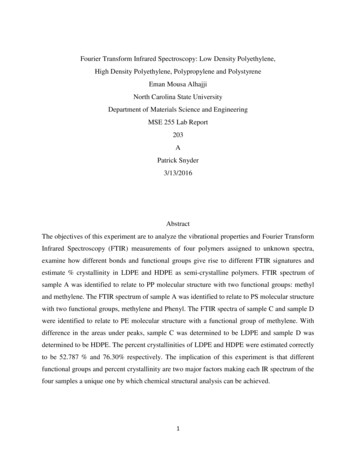
4526F. M. Vincentelli et al.2.2 X-ray data3 DATA A N A LY S I S3.1 Fast flux–flux correlationFigure 2. Section of the Fourier power spectra of the infrared light curveof the target and the comparison star, showing the three instrumental peaksin both signals. The constant noise level was not subtracted.photometry was performed, using the parameters derived from thebright reference star position and profile. To account for seeingeffects, the ratio between the source and the bright reference starcount rate was used. The mean count rate from the reference starlight curve was Fref 376 672 54 counts s 1 , while the meanratio of target to reference star flux was 0.07. Times were then putin Barycentric Dynamical Time system of reference.Casella et al. (2010) noticed that the IR power spectrum presented some instrumental features at ν 6 Hz, which can affectthe high-frequency measurements. To confirm this, we computedthe target’s and the comparison star’s power spectrum at high frequencies (ν 2 Hz). Fig. 2 shows three strong peaks, respectively,at 4.1, 5.9, and 6.1 Hz present in both sources, proving that theorigin of the peaks is instrumental. None the less, their effect on thecorrelation with the X-rays is negligible as such signals are presentonly in the IR band.MNRAS 477, 4524–4533 (2018)The discovery of a strong power-law correlation between the radioand X-ray bands during the low-hard state (Corbel et al. 2003; Galloet al. 2003), as well as between the OIR and X-ray bands (Homanet al. 2005; Russell et al. 2006; Coriat et al. 2011), opened a broaddiscussion on the physical implications of the behaviour shown bydifferent sources on the radio/X-ray and OIR/X-ray planes. However, even though many studies focused on the strict simultaneousX-ray/radio properties (e.g. Mirabel et al. 1998; Klein-Wolt et al.2002; Wilms et al. 2007), most of the past studies on the flux–flux relations were made by using quasi-simultaneous observations, i.e. byaveraging non-simultaneous measurements made (generally) within1 d. Here, we present for the first time the IR/X-ray correlationdiagram studied using high time resolution, strictly simultaneousobservations.The correlation diagram with full time resolution turned out tobe too noisy to display any trend; therefore, we re-binned both lightcurves with a 16-s time resolution. The errors were estimated withthe standard propagation formula.The resulting correlation diagram for the three separate orbits isshown in Fig. 3: a power law-like trend is clearly visible. This is thefirst evidence for an X-ray-IR power-law dependence on such shorttime-scales. To quantify the correlation, we fitted the data – using theOrdinary Least Squares method – assuming that FIR a · Fxb andtherefore log10 (FIR ) b · log10 (Fx ) log10 (a), obtaining an averageslope of 0.55. As the statistical uncertainties are much smaller thanthe observed scatter, χ 2 test cannot be applied to properly quantifythe observed trend. We therefore obtained a more accurate estimateof the slope and its uncertainty applying a bootstrap method to eachorbit separately. Operatively, we extracted N times a subsampleof M different couples of points from the X-ray/IR simultaneous16-s light curve of each orbit, in order to have N slopes. Fromthe distributions obtained assuming M 80 and N 105 , we thenextracted the average values for both slopes and intercepts, theirvariance providing an estimate of their uncertainties. The obtainedvalues are reported in Table 1. As we can see also from Fig. 4, thereDownloaded from 7/4/4524/4939299 by CNR user on 28 February 2019Figure 1. Upper panel: X-ray light curve of GX 339-4, as observed withRXTE. The two long gaps in the data are due to Earth occultation of thesource. Lower panel: Simultaneous infrared light curve, as observed withISAAC@VLT. Both light curves have been rebinned as to obtain a timeresolution of 8 s.We used data from the Proportional Counter Array (PCA) onboardof RXTE, analysing the observations corresponding to the three orbits. We used PCA ‘Binned mode’ observations with a 7.8125 mstime resolution. Only 2 proportional counter units (PCU) were active during the whole observation. Standard HEADAS 6.17 toolswere used for data reduction. The X-ray light curve was extractedin the 2–15 keV (channels 0–35) energy range. A background lightcurve with 16 s of time resolution was estimated using the FTOOLpcabackest (the background for RXTE PCA observations is not directly measured, but it is estimated by a model, with a minimumtime integration of 16 s). The background curve was resampled at7.8125 ms and subtracted from the extracted light curve. As ourobservations had a mean count rate of 23.5 counts s 1 PCU 1 , weused the RXTE PCA faint background model (for net count rates 40 counts s 1 PCU 1 ): the average background value was 19 2counts s 1 . The barycentre correction for the Earth and satellitemotion was applied using the HEASARC FTOOL barycorr whichconverts times into the Barycentric Dynamical Time system of reference. The light curves were then rebinned at 0.0625 s so as tohave the same time-steps as the IR curve.
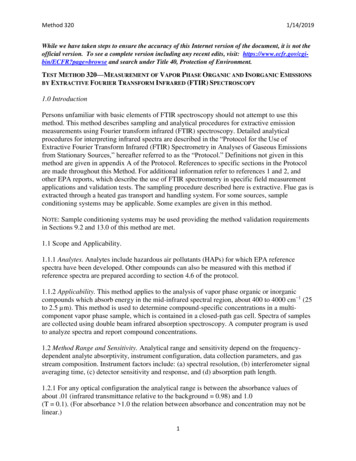
Multiwavelength timing analysis of GX 339-4Table 1. Parameters of the linear fit (log10 (IR) b*log10 (X) c) estimated for the flux–flux diagram foreach of the orbits separately.Orbit1st2nd3rdbc0.61 0.030.52 0.030.66 0.04 1.97 0.05 1.89 0.05 2.11 0.04Figure 4. Distribution of the simulated slopes after N 105 different subsampling. Red, green, and blue histograms are, respectively, the slope distribution for the first, second, and third orbits.is marginal evidence for a different slope between the 2nd and 3rdorbits (2.8σ ) and between the 1st and the 2nd (2.1σ ).3.2 Fourier analysisFourier domain analysis techniques are very useful for characterizing the X-ray variability properties of LMXRBs. In particular,a very powerful frequency-domain tool is cross-spectral analysis,which enables the lag behaviour on distinct time-scales of variabilityto be much more cleanly separated than with time-domain methodssuch as the CCF (Nowak et al. 1999; Uttley et al. 2014). The application of these techniques on fast multiwavelength observationscan help to probe the disc/jet connection down to short time-scales.While all past studies were done using optical data (Malzac et al.2004; Gandhi et al. 2010; Veledina et al. 2015), we present the firstfull cross-spectral characterization using X-ray and IR high timeresolution observations of an XRB.The maximum frequency for the Fourier analysis (ν max 8 Hz) isset by the IR time resolution (0.0625 s). To improve the statistics, theanalysis was carried out by dividing the time series into segmentsof 1024 time bins (i.e. 64 s), averaging them to obtain the finalpower(cross) spectrum1 (Van der Klis 1989). The choice of thesegment length is dictated by the presence of gaps in the IR lightcurve. A further geometric re-binning in frequency was appliedto increase the statistics at high frequencies. The power spectraldensity (PSD) for the X-ray and the IR light curve was calculatedin units of squared fractional rms per Hz (Belloni & Hasinger 1990;Vaughan et al. 2003). It is possible to show that if the effectivesampling time Tsamp is less than the nominal time bin Tbin , thePoissonian noise level changes by a factor Tsamp /Tbin (Vaughan et al.2003; Gandhi et al. 2010). The ISAAC detector, in the configurationused during these observations, had a read out time of 10 ms (Casellaet al. 2010), which means that Tsamp /Tbin 0.84. This correctivefactor was applied to the Poisson noise evaluation.The noise-subtracted PSDs are shown in Fig. 5, no evidence ofQPOs is found. The highest frequency bin of the IR power spectrum has a significant deviation from the general trend due to theinstrumental peaks found at 6 Hz. The X-ray power spectrum canbe reasonably well described with a power law with a slope of1.1 0.1 (giving a reduced χ 2 of 1.5 with 26 degrees of freedom),while a broken power law does not improve the fit significantly.The IR power spectrum requires a more complex model, a brokenpower law (β low 1, ν B 1 Hz, and βhigh 2) giving a reducedχ 2 of 2.4 with 21 degrees of freedom.To characterize better the two PSDs, we fitted them usingLorentzian profiles (Belloni, Psaltis & van der Klis 2002). IR-band,data above 4 Hz were excluded due to the instrumental features(see Fig. 2). Two components were sufficient to describe the X-rayPSD, while a third Lorentzian component was necessary for theIR band (see Table 2). We note that, while the lowest frequencycomponent appears to be the same in both PSDs (i.e. with the samecentroid and width), none of the other two components in the IRPSD seems to match the high-frequency component in the X-rayPSD. We explored this issue further, trying to fit the IR PSD byfixing the parameters of the two X-ray components (but allowingtheir normalization to vary), and adding a third Lorentzian component. However, such a model did not manage to reproduce the data,returning a reduced χ 2 2.From the cross spectrum, two quantities are derived that giveinformation on the causal relation between the two signals: thecoherence and the lags. The former gives a measure of the degree oflinear correlation of two signals (Vaughan & Nowak 1997; Nowaket al. 1999), while the latter measures for each frequency componenttheir relative shift in phase (or in time). Coherence and lags werecomputed following the recipe in Uttley et al. (2014).The intrinsic coherence for the X-ray and IR data is shown inFig. 6. A high level of coherence is present on long time-scales.From a value of almost 0.9 at 0.01 Hz, the degree of coherence1 The CCF measured by Casella et al. (2010) showed a width of 20 s,therefore, a 64-s long segment is sufficient to measure the cross spectrumwithout truncating the CCF and therefore allows lags to be estimated safely,avoiding bias effects (Jenkins & Watts 1969; Alston, Vaughan & Uttley2013).MNRAS 477, 4524–4533 (2018)Downloaded from 7/4/4524/4939299 by CNR user on 28 February 2019Figure 3. Flux–flux diagram with 16 s of time resolution for the three orbits.The Targ./Ref IR light curve is plotted as a function of the X-ray count rate.Red circles, green squares, and blue triangles correspond, respectively, tothe first, second, and third orbits. Continuous, dashed, and fined dashed linescorrespond to the best fit for the first, second, and third orbits, respectively.4527
4528F. M. Vincentelli et al.Table 2. Parameters from the fit with multiple Lorenztian com2ponent. The fitted function is the following: PSD(ν) r π· /[(ν ν0 )2 2 ]. When the error is not present, the parameter has beenfixed.# Comp.ν0 (Hz)000.03 0.010.83 0.01 0.02(χ 2 /dof 30/24)X-rays12r0.29 0.020.24 0.01(χ 2 /dof 22.6/18)IR120030.98 0.33 0.370.02 0.010.39 0.09 0.050.72 0.08 0.220.17 0.010.19 0.010.12 0.03Figure 6. Upper Panel: Intrinsic coherence between the X-ray and theinfrared light curves. Blue line represents the expected coherence for twoperfectly coherent signals with same PSD shape and statistics as in our dataset. Middle Panel: Phase lags between the X-ray and the infrared light curve.Positive lags mean the infrared variability lags the X-ray variability. LowerPanel: Time lags between the X-ray and the infrared light curve. All arecomputed from 1024 bin per segment with a logarithmic binning factor of1.2.declines to 0.2 at 1–2 Hz, while at the highest frequencies nosignificant degree of correlation is detectable. We verified whetherthe drop in the coherence could be due to bias effects. We thereforesimulated two perfectly coherent signals with the same PSD shapeand statistics as in our data set and then evaluated the coherence.The resulting coherence (blue line, Fig. 6: top panel) is significantlyhigher than the measured one, showing that bias effects cannot beresponsible for the observed decreasing trend.Phase and time lags are also shown in Fig. 6 (middle and lowerpanels, respectively). The phase lags show an increasing trend (considering the absolute value) between 0.1 and 2 Hz, corresponding toa roughly constant time lag of 100 ms, consistent with the lag foundwith the CCF by Casella et al. (2010).3.3 rms versus flux relationA linear relation between the absolute rms and the flux has beenreported in all classes of accreting sources: XRBs, active galacticnuclei (Uttley & McHardy 2001), ultra-luminous X-ray sourcesMNRAS 477, 4524–4533 (2018)Downloaded from 7/4/4524/4939299 by CNR user on 28 February 2019Figure 5. Upper panel: X-ray power spectral density data and best fit using1024 bin/segment and a geometric (i.e. multiplicative) rebinning factor of1.2. The blue continuous lines represent the Lorentzian components obtainedby the fit, while the black line is the full model. Central panel: IR powerspectral density data and best fit using 1024 bin/segment and a geometricrebinning factor of 1.2. Lower panel: Ratio between IR and X-ray powerspectrum. The plot shows clearly that the IR PSD has relative increasefollowed by a break at 1 Hz.
Multiwavelength timing analysis of GX 339-4Table 3. Parameters from the evaluation of a linear fit onthe measured IR rms–flux relation. The fitted function isσ k(F C).Range (Hz)k (abs. rms/ct s 1 )C (103 ct s 1 )0.015–0.250.25–11–50.15 0.020.229 0.0040.238 0.004 21 3 0.9 0.55.7 0.4(Heil, Vaughan & Uttley 2012), white dwarfs (Scaringi et al. 2012),and more recently also in young stellar objects (Scaringi et al.2015). Given also the presence of a lognormal distribution of thefluxes, it is usually assumed that this phenomenon arises from themultiplicative coupling of the fluctuations which propagate inwardsin the accretion inflow (Uttley, McHardy & Vaughan 2005). Recentstudies have also found this relation in the variable emission atwavelengths where the accretion inflow is not thought to be thedominant emitting component, raising questions as to the natureand origin of this property (Gandhi 2009; Edelson et al. 2013). Inorder to fully characterize the IR variability in our data set, we alsochecked for the presence of a correlation between rms and flux inthe IR light curve.The computation required several steps. First, the light curvewas divided in K segments in order to have K power spectra (eachwith a fractional squared rms normalization). Then, the segmentswere re-ordered in count rate. Then the power spectra and the fluxlevels of each group of N adjacent segments were averaged together,resulting in K/N points in the rms–flux plane. For consistency withprevious studies, the rms was normalized in absolute units, andcalculated over relatively narrow frequency ranges, each with alower boundary corresponding to the length of the segments. Thus,1-s long segments were used to compute the rms–flux relation atfrequencies above 1 Hz, 4-s long segments were used to computethe rms–flux relation at frequencies above 0.25 Hz, and so on.The relation for three different frequency ranges (0.015–0.25,0.25–1, and 1–5 Hz) is shown in Fig. 7. A relatively tight linearrelation is evident on all probed time-scales. The larger uncertaintiesfor the low-frequency measurements are due to the fewer numberof segments with which the relation was computed. A linear fit wasperformed to quantify the parameters of the trend: the fitted functionhas the usual form σ k · (F C), where σ is the absolute rms andF is the IR flux. Values from the fits are reported in Table 3: at lowFigure 8. Binned distribution of the IR count rate. The blue dashed lineshows the best lognormal fit.frequencies, the value of the intercept is 0. A similar behaviourhas been already observed in the optical (Gandhi 2009), and in theX-rays (Gleissner et al. 2004; Heil et al. 2012). From these works,it emerged that a complex relation is present between intercept andthe gradient, and that therefore the intercept cannot be interpretedsimply as a constant flux component.Given the presence of an rms–flux relation we also investigatedthe distribution of the fluxes. The histogram of the IR count rate isshown in Fig. 8: a skewed distribution is clearly present. We alsoperformed a fit to test whether the distribution is consistent withbeing lognormal. Even though the lognormal distribution seemsto approximates the measured histogram, the χ 2 test was not successful (χ 2 /d.o.f. 96/52). The presence of excess of residuals iscommon in lognormal flux distributions fitting and it is usually interpreted with the presence of non-stationarity (Uttley et al. 2005;Gandhi 2009; Edelson et al. 2013; Scaringi et al. 2015).4 DISCUSSION4.1 Fast flux–flux correlationIn a given spectral state, the source fluxes observed at differentwavelengths are expected to be correlated, with a slope that dependson the different dependence of the emission processes at play on theaccretion rate. Thus, the measurement of a flux–flux correlation canprovide us with key information on the emission processes, in turnoffering insights on the physical mechanisms with which matteraccretes into (and is ejected from) compact objects. For example,given a set of reasonable assumptions on the radio emitting medium(see Coriat et al. 2011 for details), a radio/X-ray correlation witha power-law index depending on the radiative efficiency of the Xray emitting medium is expected. Indeed, the measured power-lawindex of 0.6 observed in the hard state of several BHTs is nicelyconsistent with the slope expected for a radiatively inefficient Xray emitter, while a radiatively efficient flow would cause a steeperindex of 1.4, as is indeed observed in some neutron stars and in asubset of BHTs (e.g. Coriat et al. 2011; Tudor et al.
Characterization of the infrared/X-ray subsecond variability for the black . Box 41051, Science Building, Texas Tech University, Lubbock, TX 79409-1051, USA 5Anton Pannekoek Institute for . Polish Academy of Sciences, Bartycka 18, PL-00-716 Warsaw, Poland 8New York University Abu Dhabi, PO Box 129188, Abu Dhabi, UAE 9Department of Physics .