Transcription
Woo et al. BMC Medical Genomics(2019) NICAL ADVANCEOpen AccessGenomic data analysis workflows fortumors from patient-derived xenografts(PDXs): challenges and guidelinesXing Yi Woo1†, Anuj Srivastava1†, Joel H. Graber3†, Vinod Yadav1,5, Vishal Kumar Sarsani2,4, Al Simons2, Glen Beane2,Stephen Grubb2, Guruprasad Ananda1, Rangjiao Liu1,6, Grace Stafford2, Jeffrey H. Chuang1, Susan D. Airhart2,R. Krishna Murthy Karuturi1, Joshy George1* and Carol J. Bult2*AbstractBackground: Patient-derived xenograft (PDX) models are in vivo models of human cancer that have been used fortranslational cancer research and therapy selection for individual patients. The Jackson Laboratory (JAX) PDXresource comprises 455 models originating from 34 different primary sites (as of 05/08/2019). The models undergorigorous quality control and are genomically characterized to identify somatic mutations, copy number alterations,and transcriptional profiles. Bioinformatics workflows for analyzing genomic data obtained from human tumorsengrafted in a mouse host (i.e., Patient-Derived Xenografts; PDXs) must address challenges such as discriminatingbetween mouse and human sequence reads and accurately identifying somatic mutations and copy numberalterations when paired non-tumor DNA from the patient is not available for comparison.Results: We report here data analysis workflows and guidelines that address these challenges and achieve reliableidentification of somatic mutations, copy number alterations, and transcriptomic profiles of tumors from PDXmodels that lack genomic data from paired non-tumor tissue for comparison. Our workflows incorporate commonlyused software and public databases but are tailored to address the specific challenges of PDX genomics data analysisthrough parameter tuning and customized data filters and result in improved accuracy for the detection of somaticalterations in PDX models. We also report a gene expression-based classifier that can identify EBV-transformed tumors.We validated our analytical approaches using data simulations and demonstrated the overall concordance of thegenomic properties of xenograft tumors with data from primary human tumors in The Cancer Genome Atlas (TCGA).Conclusions: The analysis workflows that we have developed to accurately predict somatic profiles of tumors fromPDX models that lack normal tissue for comparison enable the identification of the key oncogenic genomic andexpression signatures to support model selection and/or biomarker development in therapeutic studies. A referenceimplementation of our analysis recommendations is available at s-Workflows.Keywords: Patient-derived xenografts, DNA sequencing, RNA sequencing, SNP array, Somatic mutation, Geneexpression, Copy number alterations, Mouse stroma, Bioinformatic analysis* Correspondence: Joshy.George@jax.org; Carol.Bult@jax.org†Xing Yi Woo, Anuj Srivastava and Joel H. Graber contributed equally to thiswork.1The Jackson Laboratory for Genomic Medicine, Farmington, CT 06030, USA2The Jackson Laboratory for Mammalian Genetics, Bar Harbor, ME 04609, USAFull list of author information is available at the end of the article The Author(s). 2019 Open Access This article is distributed under the terms of the Creative Commons Attribution 4.0International License (http://creativecommons.org/licenses/by/4.0/), which permits unrestricted use, distribution, andreproduction in any medium, provided you give appropriate credit to the original author(s) and the source, provide a link tothe Creative Commons license, and indicate if changes were made. The Creative Commons Public Domain Dedication o/1.0/) applies to the data made available in this article, unless otherwise stated.
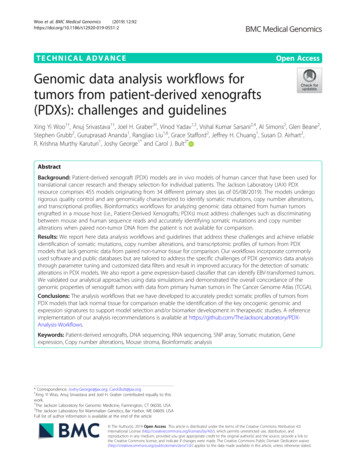
Woo et al. BMC Medical Genomics(2019) 12:92BackgroundPatient-derived xenograft (PDX) models are in vivomodels of human cancer that have been used for translational cancer research and therapy selection for individual patients [1–8]. Previous studies have demonstratedhuman tumors engrafted in mouse hosts retain therapeutically relevant genomic aberrations found in the original patient tumor [3, 9, 10] and that treatmentresponses of tumor-bearing mice typically reflect the responses observed in patients [6, 11]. PDXs have beenused successfully as a platform for pre-clinical drugscreens [6, 7, 11], to facilitate the development of potential biomarkers of drug response and resistance [6, 7,12], and to select appropriate therapeutic regimens forindividual patients [9].The Jackson Laboratory (JAX) PDX resource comprises455 PDX cancer models originating from 34 different primary sites (as of 05/08/2019, Table S14). The modelsundergo rigorous quality control and are genomicallycharacterized to identify somatic mutations, copy numberalterations, and transcriptional profiles (Fig. 1). To date,over 100 models in the resource have been assessed fortheir response to cytotoxic and/or targeted therapeuticagents. The integration of results from dosing studies withgenomic data for the models has been successfully appliedto the identification of novel genomic biomarkers associated with treatment responses [13].Four major challenges need to be addressed to genomically characterize human tumors engrafted in a mousehost. First, mouse sequences must be removed from adata set prior to data analysis. Nucleic acids extractedfrom engrafted tumors include both mouse and humansequences because human stroma is replaced by mousecells during tumor engraftment [14]. As the proteincoding regions of the mouse and human genomes are85% identical on average [15]; there is a high risk ofintroducing false positive (FP) variants resulting frommouse sequences aligning to a reference human genome[16–18]. Second, a baseline normal must be created toidentify aberrations that are likely somatic. Paired normal samples are not available for the majority of JAXPDXs because the tumor tissue used to create themodels was material that remained following clinicalpathology assessment (i.e., tumors were not collectedspecifically for xenograft model creation). The absenceof genomic data from paired normal tissue complicatesthe process of distinguishing germline variants fromsomatic alterations (point mutations, indels, and copynumber alterations) in the tumor [19–22]. Third, systematic errors in sequencing and alignment can lead toFP variant calls and require customized filtering logic incomputational workflows [23–25]. Finally, care must betaken to ensure the engrafted tumors in PDXs match theexpected cancer type. Some strains of immunodeficientPage 2 of 19host mice are susceptible to forming B-cell humanlymphomas during engraftment due to Epstein-Barrvirus (EBV)-associated lymphomagenesis [26–30]. Identifying PDX tumors that arise from EBV transformationis critical to the model integrity and to meaningful genomic data analysis.Here we describe bioinformatics analysis workflowsand guidelines sis-Workflows) that we developed specifically for the analysis of genomic data generated fromPDX tumors. Our workflows incorporate commonlyused software and public databases but are tailored toaddress the specific challenges of PDX genomics dataanalysis through parameter tuning and customized datafilters and result in improved accuracy for the detectionof somatic alterations in PDX models relative to analysesthat lacked custom filters. We also report a geneexpression-based classifier that can identify EBVtransformed tumors. Finally, to demonstrate the effectiveness of our workflows, we show the overall concordance of the genomic and transcriptomic profiles of thePDX models in the JAX PDX resource with relevanttumor types from The Cancer Genome Atlas (TCGA).MethodsGenomic and transcriptomic profiling of engraftedtumorsDNA sequencingFlash frozen tissues were pulverized using a BessmanTissue Pulverizer (Spectrum Chemical) and homogenized in Nuclei Lysis Buffer (Promega) using a gentleMACS dissociator (Miltenyi Biotec Inc). DNA wasisolated using the Wizard Genomic DNA PurificationKit (Promega) according to manufacturer’s protocols.DNA quality and concentration were assessed using aNanodrop 2000 spectrophotometer (Thermo Scientific),a Qubit dsDNA BR Assay Kit on a Qubit Fluorometer(Thermo Scientific), and the Genomic DNA ScreenTapeon a 4200 TapeStation (Agilent Technologies). Librarieswere prepared using the Hyper Prep Kit (KAPA Biosystems) and SureSelectXT Target Enrichment System withthe JAX Cancer Treatment Profile (CTP) targeted panelof 358 related genes (Agilent Technologies) [31, 32],according to the manufacturer’s instructions. Briefly, theprotocol entails shearing the DNA using the CovarisE220 Focused-ultrasonicator (Covaris), ligating Illuminaspecific adapters, and PCR amplification. AmplifiedDNA libraries are then hybridized to the CTP probes,amplified using indexed primers, and checked for qualityand concentration using the High Sensitivity D5000ScreenTape (Agilent Technologies) and Qubit dsDNAHS Assay Kit (Thermo Scientific). Libraries were pooledand sequenced 150 bp paired-end on the NextSeq 500(Illumina) using NextSeq v2 reagents (Illumina).
Woo et al. BMC Medical Genomics(2019) 12:92Page 3 of 19Fig. 1 Overview of Patient-Derived Xenograft (PDX) model generation and genomic characterization at The Jackson Laboratory (JAX). a Schematic overviewof PDX model generation and characterization for the JAX PDX resource. JAX has generated, clinically annotated, and genomically characterized 455 PDXcancer models originating from 34 different primary sites (as of 05/08/2019) using the immunodeficient NOD.Cg-Prkdcscid Il2rgtm1Wjl/SzJ (aka, NSG ) mouse asthe host strain. b Schematic of the genomic characterization of PDX models (see Methods for details). The three primary genomic characterization methodsare: 1) somatic mutations using the JAX Cancer Treatment Profile (CTP, erings/jax-cancer-treatment-profile),the Illumina TruSeq panel or whole-exome sequencing, 2) DNA copy-number variation using Affymetrix SNP 6.0 arrays, and 3) gene expression profiles fromAffymetrix microarrays or RNA sequencing (Illumina HiSeq)RNA sequencingTissues preserved in RNAlater were homogenized inTRIzol (ThermoFisher Scientific) using a gentleMACSdissociator (Miltenyi Biotec Inc). Total RNA was isolatedusing the miRNeasy Mini kit (Qiagen) according tomanufacturer’s protocols, including the optional DNasedigest step. RNA quality and concentration wereassessed using the RNA 6000 Nano LabChip assay on
Woo et al. BMC Medical Genomics(2019) 12:92the 2100 Bioanalyzer instrument and Nanodrop 2000spectrophotometer (Thermo Scientific). Prior to 2016,non-stranded libraries were constructed using TruSeqRNA Library Prep Kit v2 (Illumina). Stranded librarieswere prepared using the KAPA mRNA HyperPrep Kit(KAPA Biosystems), according to the manufacturer’s instructions. Briefly, the protocol entails isolation of polyAcontaining mRNA using oligo-dT magnetic beads, RNAfragmentation, first and second strand cDNA synthesis,ligation of Illumina-specific adapters containing a uniquebarcode sequence for each library, and PCR amplification. Libraries were checked for quality and concentration using the DNA 1000 assay (Agilent Technologies)and quantitative PCR (KAPA Biosystems), according tothe manufacturers’ instructions. Libraries were pooledand sequenced 75 bp paired-end on the NextSeq 500(Illumina) using NextSeq High Output Kit v2 reagents(Illumina), or 100 bp paired-end on the HiSeq2500 (Illumina) using TruSeq SBS v3 reagents (Illumina).SNP arrayDNA samples were sent to the Genotyping Core at theHussman Institute for Human Genomics (University ofMiami) for genotyping on the Genome-Wide HumanSNP Array 6.0 (Affymetrix). Quality control on the CELfiles was carried out using the standard Contrast QCmetric from the Affymetrix Genome Wide SNP 6.0 arraymanual.Somatic point mutation and indel calling workflowPreprocessing and removal of mouse readsDNA sequence data generated from PDX tumors underwent initial data processing as follows: (i) sequence readswith 70% of the bases having a quality score 30 (Q30)were discarded, (ii) bases with quality scores less thanQ30 were trimmed from the 3′ end of the read, (iii) sequence reads with 70% of bases remain after trimmingwere discarded, (iv) both reads from pair-end sequencingwere discarded if either read was discarded. If 50% ofthe total reads remained following the preprocessingsteps, the sample was removed from the analysis. Following the initial data processing step described above,mouse reads were identified and filtered out usingXenome v1.0.0 [16]. Only read pairs with both readsclassified as human were included in further analyses.Sequence reads that passed all pre-processing stepswere mapped to the reference human genome (buildGRCh38.p5 with 262 alternate loci) using the BWAMEM alignment tool with ALT-Aware mapping (Additional file 1: Text S5) [33–35]. Because low sequencecoverage leads to poor sensitivity in variant calling, samples with less than 75% of the target region covered atleast at 100X by human reads were excluded from further analysis.Page 4 of 19Variant callingThe GATK best practices workflow ctices/) using the UnifiedGenotyper, was used for variant discovery analysis[36–38], which is comprised of the following steps: (i)sorting the SAM/BAM file by coordinate, (ii) removingduplicates to mitigate biases introduced by library preparation steps such as PCR amplification by Picard(https://broadinstitute.github.io/picard/), and (iii) recalibrating the base quality scores as the variant calling algorithms rely heavily on the quality scores assigned tothe individual base calls in each sequence read. Pindel[39] was also incorporated into the workflow to callindels that have been missed by the GATKUnifiedGenotyper.Quality filtering of variants for targeted sequencingHigh quality variants from both variant callers in the PDXsamples were obtained based on GATK hard filtering (seebelow), and have a read depth (DP) of 140 and allele frequency (ALT AF) of 5%. These DP and ALT AF thresholdswere optimized using a set of known and validated mutationsand samples reported earlier for the JAX CTP targeted panelsequencing at high coverage (average 941 X) [31, 32]. Theparameters for GATK hard filtering [40] were set as defaultas recommended by GATK best practices itute.org/gatk/best-practices/):(i) for point mutations, QD 2.0, FS 60.0, MQ 40.0,MQRankSum 12.5, ReadPosRankSum 8.0.(ii) for indels, QD 2.0, FS 200.0, ReadPosRankSum 20.0.In addition, we verified that these default thresholdswere able to detect all the known mutations in the CTPsamples [31]. The average number of variants before andafter quality filtering across the CTP samples is shownAdditional file 1: Table S4.Annotation of variantsVariants were annotated for their effect (gene, consequence, amino acid change, etc.) using SnpEff v4.3 [41]based on gene annotations from Ensembl (version 84)and information from COSMIC version 80 [42], dbSNPbuild 144 [43]. The observed variant allele frequency inthe 1000 Genomes Project [44] and ExAC version 0.3[31, 45] databases were obtained using SnpSift tool byutilizing dbNSFP3.2a.txt database. We further annotatedeach variant with 1) known or predicted gain or loss ofprotein function, 2) potential treatment approach forany cancer type and 3) drug sensitivity and resistanceeffects in clinical or preclinical studies, based on curatedclinical information from the JAX clinical knowledgebase (CKB, https://ckbhome.jax.org/) [46, 47] via directintegration of our internal database of PDX data with
Woo et al. BMC Medical Genomics(2019) 12:92the JAX CKB database. The JAX CKB contains annotations for 28,362 variants in 1320 genes (as of 05/03/2019). The average number of variants annotated to beclinically relevant across the CTP samples is shown inAdditional file 1: Table S4.Filtering of germline variantsSince normal samples from patients whose tumors wereused to generate the PDX models were unavailable inmost cases, we generated a dataset of putative humangermline variants using data from several public resources: (i) dbSNP, (ii) 1000 Genomes Project, (iii) ExACdatabase with MAF 1%, and (iv) a compendium of variants from 20 normal human blood samples available inJAX (Additional file 1: Text S1) that were prepped andsequenced on the CTP panel using the same protocol asthe PDX samples, with a frequency of 2/20 in normalsamples or 1/20 in normal samples and 2/20 in PDXmodels. The number of variants in each of these databases are shown in Additional file 1: Table S3. The variants identified via GATK and Pindel in the PDX modeltumors were annotated as germline and filtered out ofthe model’s somatic mutation calls if they were presentin our aggregated dataset of putative germline variantsand had allele frequencies between 40 to 60% or morethan 90%.Filtering putative false positivesVariants not in our aggregated dataset of putative germline variants described above but occurred at a frequencyof 25% or greater across all PDX models (n 236) wereconsidered to be putative false positive (FP) mutations.The rationale for this data filtering step was based on ourobservation that the maximum recurrent frequency ofsomatic mutated base positions was 6% across a compendium of TCGA tumor samples (n 3576, 9 tumor typesthat were also represented in the PDX model). Thus, wewould expect that any mutated loci recurring across PDXsamples at significantly higher rates to likely be FP. Systematic technical errors in sequencing and/or mappingare possible explanations for the common recurrent nonsomatic mutations identified PDX models.Rescuing false negative variantsAn exception to the germline and false positives exclusion process was made for variants from GATK thatwere annotated as clinically relevant in JAX CKB. Werescued any filtered variants that were curated into theproprietary JAX-Clinical Knowledgebase (CKB, https://ckbhome.jax.org/) with 1) known or predicted gain orloss of protein function, 2) potential treatment approachfor any cancer type and 3) drug sensitivity and resistanceeffects in clinical or preclinical studies. In addition, asPindel results contained a large number of FPs, we onlyPage 5 of 19included those that were present in the JAX-CKB by thesame criteria.Benchmarking of PDX somatic mutation workflowTo benchmark the PDX somatic mutation workflow, wegenerated simulated datasets for five PDX models andnine conditions. The datasets included 1) varying sequencing coverage, 2) spiked-in mutations representativeof the different tumor types, and 3) different proportionsof spiked-in mouse sequence contamination (Additional file 2: Table S1).Generation of simulated sequence readsSeqMaker was used to generate simulated sequencing databased on human genome assembly GRCh38.5 with varying sequencing depth, read length, duplication rate, sequencing error and base quality range [48]. Referencesequences were extracted from target region of the CTPpanel. Sequence reads for 5 PDX tumor samples weresimulated using predicted mutations from PDX models ofdifferent cancer types from the CTP dataset to representdifferent spectrum of mutations, with a range of allele frequency to mimic germline and somatic mutations. Foreach simulated sample, we generated three technical replicates at 500X, 1000X and 1500X coverage.Mouse sequencing reads were added in different fractions to the human-specific simulated dataset to mimicmouse contamination observed in PDX models. Themouse reads were extracted from the sequencing data ofmouse DNA isolated from fresh spleen tissue of NSGmice on the CTP. For each simulated human-specificsample, we added mouse reads in three proportions (10,15 and 25% of the total coverage).Calculate sensitivity and specificity of mutation resultsbased on different workflow filtersTo evaluate the effect of each filter used in our workflow, we modified the somatic mutation workflow by: (i)omitting Xenome to filter mouse reads, and (ii) mappingto the reference sequence using BWA-MEM. Eachmodified workflow was used to process each PDX simulated library and each set of results, with and withoutquality filters, was used to compute the lists of true positive, false positive, true negative and false negative variants. As such, we can calculate the range of sensitivitiesand specificities of the predicted variants for all the simulated PDX models. We compared the distributions ofprecision, recall and F1-score (2*(Recall*Precision)/(Recall Precision)) for different variations of the variantcalling workflow on the simulated datasets. Furthermore,we compared the predicted allele frequencies of the truepositives of each sample with the input by correlation.
Woo et al. BMC Medical Genomics(2019) 12:92Page 6 of 19Gene expression workflowData processing and expression estimationCopy number alterations (CNA) workflowAssessing the effects of mouse DNA on SNP arrayPrior to alignment to the human transcriptome,sequences from PDX tumors were processed for sequence quality. Only sequences with base qualities 30 over 70% of read length were used in downstream analyses. Quality trimmed reads were then analyzed using the default parameters of Xenome v1.0.0(k 25) [16] to separate human, mouse, and ambiguous sequences (i.e., sequences that cannot be reliablyclassified as mouse or human). Sequence reads thatpassed the quality and Xenome screening werealigned to a human transcriptome dataset (ENSEMBLversion 84) using Bowtie v2.2.0 [49, 50]. Only sampleswith at least 1 million human reads were retained forexpression analysis to ensure reliable quantification ofgene expression level for all genes. The 1 million human read cutoff was determined using down-samplingexperiments (data not shown). Gene expression estimates were determined using RSEM v1.2.19 [51](rsem-calculate-expression) with default parameters.We further normalized the expression estimate (expected count from RSEM) using upper quantilenormalization of non-zero expected counts and scaling to 1000.DNA of the NSG mouse was hybridized on the Affymetrix SNP 6.0 array, and the signal intensity was extractedfrom the CEL files using Affymetrix Power Tools (aptcel-extract). The mouse content for each PDX samplewas estimated by the mouse reads proportion computedby Xenome of the mutation calling pipeline for the CTPsequencing of the same PDX sample.Classifier for EBV-associated PDX lymphomasTumor-normal CNA analysisA gene signature for identifying putative EBVassociated lymphomas was derived by calculating thefold change of the average expression of the expressedgenes between 20 EBV-associated lymphomas and 100non-EBV tumors based on the Z-score transformationof upper-quantile normalized RNA-Seq counts (RSEM).24 up-regulated and 24 downregulated genes, selectedbased on the highest and lowest fold change values,were used to define the list of classifier genes (Additional file 1: Table S6). We further checked that the expression levels of these classifier genes were consistentamong the EBV-associated lymphomas, and were ableto cluster the EBV-associated lymphomas separatelyfrom other non-lymphoma PDX tumors (Fig. S5). Geneset analysis on the resulting expression vector was performed with GSEA using the GenePattern webserverand default parameters (data not shown). For each PDXsample, the upper-quantile normalized counts fromRSEM of the classifier genes were transformed into zscores using the mean and standard deviation computed across all PDX samples for each gene. Subsequently, a sign corresponding to the direction ofregulation in the classifier table was multiplied to eachz-score and the sum of these modified z-scores resultedin a single score for each PDX sample. A classifier scoreof 3.0 was used to identify a PDX tumor sample as apotential EBV-associated lymphoma.The same normalization steps as the single-tumor analysis were applied in which both tumor and normal CELfiles were normalized with 300 HapMap samples,followed by the CNA analysis using the tumor-normalversion of ASCAT 2.4.3.Single-tumor CNA analysisPennCNV-Affy and Affymetrix Power Tools [52–54]were used to extract the B-allele frequency (BAF) andLog R Ratio (LRR) from the resulting CEL files of theAffymetrix Human SNP 6.0 array. Due to the absence ofpaired-normal samples, the allele-specific signal intensityfor each PDX tumor were normalized relative to 300randomly selected sex-matched Affymetrix Human SNP6.0 array samples obtained from the International HapMap project [55]. The single tumor version of ASCAT2.4.3 [56], which could infer the necessary germlinegenotypes from the tumor data, was then used for GCcorrection, predictions of the heterozygous germlineSNPs and estimation of ploidy, tumor content and copynumber segments with allele-specific copy number.Annotation of CNA segmentsThe resultant copy number segments were annotatedwith loss of heterozygosity (LOH) and log2 ratio of totalcopy number relative to diploid state (copy number 2)and predicted ploidy from ASCAT. A segment was defined as LOH when the major-allele copy number was 0.5 and the minor-allele copy number was 0.1. Genelevel copy number and LOH were estimated by intersecting the genome coordinates of copy numbersegments with genome coordinates of genes (Ensemblversion 84; genome assembly GRCh38.5). In cases wherea segment boundary was contained within a gene’s coordinates, the most conservative (lowest) estimate of copynumber was used to represent the copy number of theentire intact gene, and the gene was annotated with thenumber of overlapping segmentsDefining copy number gain and lossThe low-level copy number gain or loss of a gene wasdefined by the log2 ratio of the copy number relative tothe average ploidy of the sample or diploid state with a
Woo et al. BMC Medical Genomics(2019) 12:92threshold of 0.4 respectively. We compiled a list ofgenes with focal copy number alterations that were significantly amplified (n 273) or deleted (n 820) in the8 tumor types (Additional file 1: Fig. S8 and Table S12)from the GISTIC 2.0 analysis from the TCGA FireBrowse website (http://firebrowse.org/). Using this set ofgenes, we compared the proportion of genes that wouldbe classified as gain and loss when using different baselines (diploid state 2 or ASCAT predicted ploidy) forPDX models listed in Additional file 1: Table S12.Comparison of copy number alterations with geneexpressionUsing annotations from the Cancer Gene Census resource [57] we analyzed the relationship between copynumber alterations and gene expression using a list of23 oncogenes that are commonly amplified in cancersand a list of 40 tumor suppressor genes that are commonly deleted in cancers. These genes were classifiedinto copy number states of high-level loss (log2(CN/ploidy) 1), normal ( 1 log2(CN/ploidy) 1) andhigh-level gain (log2(CN/ploidy) 1). The expressionfold change of each gene was calculated as thelog2(TPM 1) relative to the mean expression acrossPDX samples with a stringent normal copy number state( 0.4 log2(CN/ploidy) 0.4). The significance of expression changes of each gene for the entire PDX resource with copy number gain or loss relative to thenormal state was calculated using the Student’s t-Test.Comparison between PDX and TCGA dataSomatic mutationsWe calculated the distribution of mutational load (number of non-silent, coding mutations in exonic regionsper sample) of the CTP genes for 6 tumor types with atleast 10 models in the PDX resource (colorectal cancer,lung adenocarcinoma, lung squamous cell carcinoma,melanoma, bladder carcinoma and triple-negative breastcancer, Additional file 1: Table S5). MAF files for somatic mutations based on whole-exome sequencing of theTCGA samples of 6 tumor types [58–62] were obtainedfrom TCGA Data Portal and were used to compute themutation frequency for CTP genes only. The Fisher’sexact test was used to test the significance of overlap ofmutated genes between the PDX resource and TCGApatient cohorts for each tumor type. The genes in eachPDX resource were considered if they were mutated inat least one sample, while the genes in each TCGAtumor cohort were considered if they were mutated withat least 5% frequency, due to a much larger sample size.Gene expression6 tumor types with at least 10 models in the PDX resource were selected for comparison with TCGAPage 7 of 19(colorectal cancer, lung adenocarcinoma, lung squamouscell carcinoma, melanoma, bladder carcinoma andtriple-negative breast cancer, Additional file 1: TableS10). The scaled estimate (TPM 10 6) from the RNASeq data of 6 tumor types in TCGA [58–63] wereobtained from the TCGA FireBrowse website (http://firebrowse.org/). Non-expressed genes across all tumortypes were removed (log2(TPM 1) 2), and the top1000 most varying genes based on the variance of theirz-scores of log2(TPM 1) across all tumor types wereselected to cluster the TCGA samples by hierarchicalclustering. These 1000 most varying genes were intersected, by common gene symbols, with the PDX expression data. The symbols of genes that mapped to multiplegenomic locations were removed, leaving 993 overlapping genes. These 993 genes were then used to clusterthe PDX samples by hierarchical clustering. The frequencies of over-expression and under-expression ofeach gene is defined by the z-scores of log2(TPM 1) of 1 and 1 respectively. Correlation of the gene expression frequencies in each tumor type was computedusing Pearson correlation. The differential gene expression of each tumor type compared to all other tumorty
a Qubit dsDNA BR Assay Kit on a Qubit Fluorometer (Thermo Scientific), and the Genomic DNA ScreenTape on a 4200 TapeStation (Agilent Technologies). Libraries . (Agilent Technologies) and Qubit dsDNA HS Assay Kit (Thermo Scientific). Libraries were pooled and sequenced 150bp paired-end on the NextSeq 500 (Illumina) using NextSeq v2 reagents .