Transcription
Mining Massive Amounts of Genomic Data: ASemiparametric Topic Modeling ApproachEthan X. Fang Min-Dian Li† Michael I. Jordan‡ Han Liu§January 1, 2015AbstractCharacterizing the functional relevance of transcription factors (TFs) in different biologicalcontexts is pivotal in systems biology. Given the massive amount of genomic data, computational identification of TFs is often necessary to generate new hypotheses for experimentalists.In this paper, we use large gene expression and chromatin immunoprecipitation (ChIP) datacorpuses to conduct high-throughput TF-biological context association analysis. This workmakes two contributions: (i) From a methodological perspective, we propose a unified topicmodeling framework for exploring and analyzing large and complex genomic datasets. Underthis framework, we develop new statistical optimization algorithms and semiparametric theoretical analysis which are also applicable to a variety of large-scale data analyses. (ii) From ascientific perspective, our method provides an informative list of new discoveries in biology. Ourdata-driven analysis of 38 TFs in 68 tumor biological contexts identifies functional signaturesof epigenetic regulators, such as SUZ12 and SET-DB1, and nuclear receptors, in many tumortypes. In particular, the TF signature of SUZ12 is present in a broad range of tumor types,suggesting the important role of SUZ12-mediated histone methylation in tumor biology.1IntroductionA fundamental goal of systems biology and functional genomics is to understand global regulationof gene expression. Transcription factors (TFs), cofactors, and epigenetic proteins represent majorregulators of gene expression, the disturbance of which contributes to the pathogenesis of a plethoraof human diseases, including cancer (Darnell, 2002; Arrowsmith et al., 2012). A major approach Department of Operations Research and Financial Engineering, Princeton University, Princeton, NJ 08544, USA;e-mail: xingyuan@princeton.edu†Department of Cellular and Molecular Physiology, Section of Comparative Medicine and Program in IntegrativeCell Signaling and Neurobiology of Metabolism, Yale University School of Medicine, New Haven, CT 06520, USA;e-mail: mindian.li@yale.edu‡Department of EECS and Statistics, University of California, Berkeley, CA 94720, USA; e-mail:jordan@stat.berkeley.edu§Department of Operations Research and Financial Engineering, Princeton University, Princeton, NJ 08544, USA;e-mail: hanliu@princeton.edu1
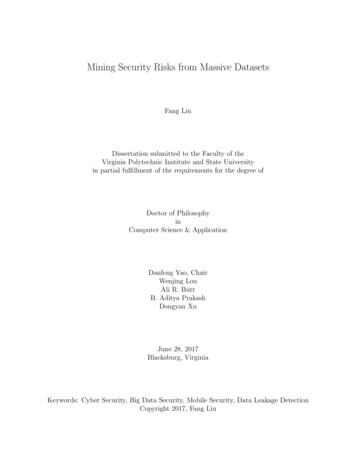
to understand such regulators is to integrate their genomic binding patterns with gene expressionprofiles in different biological contexts, including physiologic or pathologic conditions from differentorganisms. Currently, chromatin immunoprecipitation (ChIP), followed by microarray or DNAsequencing (-chip or -seq, collectively referred to as ChIPx) are widely used to examine the functionof TFs, cofactors and epigenetic proteins in different biological contexts. Since the launch ofthe ENCODE and modENCODE consortia, ChIPx data from more than 140 TFs and histonemodifications in more than 100 cell types from four organisms including human have been madeavailable (Landt et al., 2012). Meanwhile, more than 36,728 series of gene expression profiles indifferent organisms from frogs to human have been deposited to the Gene Expression Omnibus(GEO) public database (Edgar et al., 2002; Zhu et al., 2008; Barrett et al., 2013).Although a variety of computational methods have been proposed to integrate ChIPx and geneexpression data and to predict associations between TFs and biological contexts (Boulesteix andStrimmer, 2005; Faith et al., 2007; Zhu et al., 2008; Wu et al., 2013a), there are several criticalchallenges associated with such methods. First, current methods are often not able to cope withthe high dimensionality associated with gene-expression datasets, where the dimension of the datais generally much larger than the sample size. Second, current methods often assume idealizeddistributions such as Gaussian that are generally not a good match to the complex distributionsthat arises in these datasets, particularly in the tail of the distributions. Third, current methodsdo not address issues of heterogeneity that arise when the overall dataset is formed from differentsources.In this paper, we exploit the transelliptical distribution recently studied by Han and Liu (2012)to propose a semiparametric transelliptical topic (TROPIC) modeling framework to address thechallenges of integrating genomic binding patterns with gene expression profiles across biologicalcontexts. A semiparametric model contains both finite- and infinite-dimensional parameters, andis used in our framework to model gene expression data. The infinite-dimensional component ofthe model provides flexibility, and the finite-dimensional component comprise the parameters ofmajor scientific interest. Such a topic modeling framework, combined with a hierarchical mixturearchitecture, enables us to effectively extract common information from large aggregated datasetsthat exhibit high heterogeneity. In addition, we develop new statistical optimization algorithms toestimate the parameters in these topic models efficiently. We will show that under mild assumptions,our estimation procedure converges at a near-optimal rate.We show how to use our method to perform high-throughput TF-biological context analysisof ChIPx and gene expression profiles by matching target genes of a TF with feature genes of abiological context. We first show that the TROPIC method reveals the TF signature of c-MYCin a conserved cohort of tumors with ChIPx data from different sources. We next show that theTROPIC method is more reliable than ChIP-PED (Wu et al., 2013a), the first of such analyticmethods, but provides a simple platform. To illustrate the effectiveness of TROPIC, we furtherapply our framework to ChIPx data involving 38 TFs and epigenetic proteins, and gene expressionprofiles of 68 tumor types. Figure 1 illustrates the work flow. We find that the TF signatureof the epigenetic regulator SUZ12 is prevalent in a broad range of tumors. Classic tumor-relatedTFs, such as NF-κB, c-FOS, c-JUN, ESR1 and PAX5, are also prevalent in tumors. Interestingly,2
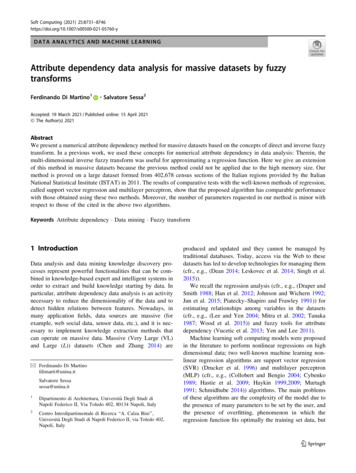
Application: Data-Driven ScienceA K( B( K)K)Gene TopicsGenesSignificant TopicTop target gene (TTG)Topic gene match TTGTopic gene does not match TTG60,000 gene expression samplesfrom multiple biological contexts3000 ChiPx samples for multiple inEwSarcomaKidneyCancerTextGene ExpressionData (Microarray)(104/sample)BRCA1EWSR1Confirmed connectionsUnexplored areaPotential connectionMYCFigure 1: (A) Our method integrates datasets arising from gene expression and ChIPx. (B) We assess whether toptarget genes (red) have significant overlap with topic genes (purple). (C) We systematically explore the associationsbetween biological contexts and transcription factors. The current state of the art is that only a small proportion(red) of the joint ChIPx and expression data in human has been investigated; we analyze the unexplored area (grey)in order to guide biologists in the design of new experiments.several nuclear receptors, e.g., HNF4A, and RXRA, exhibit significant relevance in a wide spectrumof tumor types.2Data and MethodologyWe exploit a gene expression dataset (McCall et al., 2011) consisting of n 13, 182 samples ofM 2, 631 biological contexts generated from Affymetrix Human 133A (GPL96) arrays. The datawas downloaded from GEO, preprocessed and normalized using frozen-RMA (McCall et al., 2010) toreduce batch effect. For each probeset, we standardize its expression values to have zero mean andunit standard deviation across all array samples. The data contain 20,248 probes, correspondingto d 12, 704 genes.3
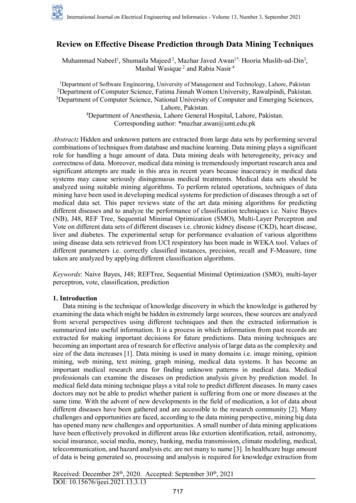
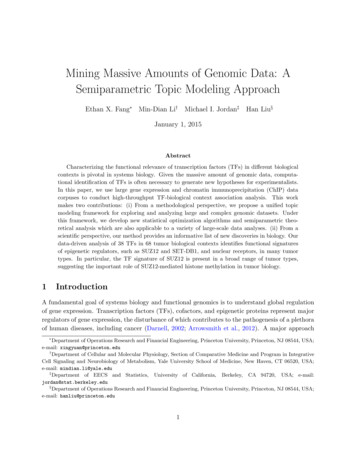
2.1Data ModelingThe gene expression data X Rn d is highly heterogeneous since it is collected from multiplebiological contexts and labs. Such heterogeneity invalidates the classical Gaussian model andmotivates us to adopt a more flexible model based on the transelliptical distribution (Han and Liu,2012).A random vector X (X1 , ., Xd )T Rd follows a transelliptical distribution, denoted X T E(µ, Σ; Z, f1 , ., fd ), if there exist monotone univariate functions f1 , ., fd : R R such that the Ttransformed data f (X) f1 (X1 ), ., fd (Xd ) follows an elliptical distribution with mean µ andcovariance matrix Σ. More details regarding this distribution are provided in Appendix A.To model the heterogeneity of the gene expression data X, we assume the expression datafrom the m-th biological context are generated from a transelliptical random vector Xm . Thisresults in a transelliptical mixture model, i.e., each gene expression sample is generated from X PMPMdm 1 πm 1.m 1 πm Xm R where M is the total number of biological contexts andThe transelliptical mixture model has a natural hierarchical interpretation (Liu et al., 2012).Specifically, for each biological context m, we assume that there exists a latent Gaussian randomvector Ym Nd (µm , Σm ). As shown in Figure 2, the Gaussian random vector can be convertedinto an elliptical random vector Zm ECd (g, µm , Σm ) via a global stochastic scaling factor ξm .Compared to the Gaussian distribution, elliptical distributions are powerful at modeling heavy-taildistributions with possibly nontrivial tail dependency. However, elliptical distributions are still restrictive since they must be symmetric. The elliptical random vector can be further converted intoa possibly asymmetric transelliptical random vector through marginal monotone transformations.The transelliptical model is semiparametric since it contains both finite-dimensional parameters(the mean and covariance matrix) and infinite-dimensional parameters (the stochastic scaling variable and marginal transformations). Such a semiparametric architecture naturally addresses theheterogeneity issue in modeling the expression data. For the purposes of statistical inference, wetreat the stochastic scaling factor ξm and marginal transformations as nuisance parameters and diPrectly infer the latent means and covariance matrices µm ’s and Σm ’s. We define Y Mm 1 πm Ymto be the latent Gaussian mixture random vector associated with X.2.2Transelliptical Topic ModelWe assume the gene expression data X Rn d can be summarized by a small number of “topic”vectors v1 , v2 , ., vT Rd with T n. This general approach has been used in many applications,including text mining (Blei et al., 2003; Mimno, 2012), social media analysis (Purushotham et al.,2012), image processing (Wang et al., 2009) and others (Bakalov et al., 2012; Yao et al., 2009; Shalitet al., 2013). In particular, motivated by the approach to topic modeling based on the singularvalue decomposition (Deerwester et al., 1990), we define the topics of the transelliptical mixturerandom vector X to be the leading eigenvectors of the latent mean-adjusted covariance matrixS Σ µµT , where Σ and µ are the covariance matrix and mean of the latent Gaussian mixture4
GaussianElliptical TransellipticalExpression for Expression forBreast Cancer Ewing SarcomaExpression forKidney CancerAsymmetrich1h2hMHeavy tail 1 M 2Lighted tailBreastCancerEwingSarcomaY 1 N (µ1 , 1 ) 1MixturedistributionY 2 N (µ2 , 2 ) 2KidneyCancerY M N (µM , M ) M Multi( 1 , . . . , M )Figure 2: The hierarchical structure of a transelliptical mixture distribution. Each biological contextm has a underlying normal distribution Ym N (µm , Σm ). Each Ym is transformed to an ellipticalrandom vector and then to a transelliptical random vector. The observed data are generated fromthe transelliptical random vector.random vector Y , i.e.,S Cov(Y ) E(Y )E(Y T ) MXπm Sm ,(1)m 1µm µTm .where each Sm Σm The first term Cov(Y ) captures population-level variability, and the second term E(Y )E(Y T )captures location information. Recall that for a positive semidefinite matrix, S Rd d , we canPwrite S di 1 λi vi viT where λ1 λ2 . λd 0 are the eigenvalues of S, and vi are thePcorresponding eigenvectors, such that the best rank-k approximation of S is ki 1 λi vi viT for all 1 k d (Trefethen and Bau III, 1997). Thus, the leading topics provide a latent representation thatsummarizes important aspects of the first- and second-order statistical structure of the distributionof X. We additionally assume that the topics v1 , v2 , .vT Rd are s-sparse; i.e., we assume atmost s of the d elements of each vt are non-zero where s d. Such sparsity assumptions havebeen widely adopted in the latent variable modeling literature as a tool for addressing the curse ofdimensionality; see, e.g., Carvalho et al. (2008) and Wang and Blei (2009). The nonzero componentsof the topics represent features which are important in one or more Xm ’s. To summarize, thetranselliptical topic model is defined as:5
Definition 2.1 (Transelliptical topic model). The transelliptical topic model, denoted by T (S; M, s),P(m)(m)is the set of distributions X Mm 1 πm Xm , where each Xm T Ed (µm , Σm ; Z, f1 , ., fd ),PMsuch that S m 1 πm (Σm µm µTm ) and the first T leading eigenvectors of S are s-sparse.Since transelliptical distributions can be heavy-tailed or asymmetric, we exploit a combinationof rank correlation (Han and Liu, 2012) and an M-estimator proposed by Catoni (2012) to estimatethe mean-adjusted covariance matrix S. For parameter estimation, we adopt the truncated power(TPower) method (Yuan and Zhang, 2013) initialized by a semidefinite program that is known asthe Fantope Projection and Selection (FPS) method (Vu et al., 2013). More details regarding theseestimators can be found in Appendix B.We now present a theorem which shows that our proposed method achieves the minimax optimalp rate of convergence, OP(s log d)/n , for estimating the sparse topic vectors.Theorem 2.2. Let X T (S; M, s). We assume the first T eigenvalues of S, λ1 , ., λT , have asmallest spectral gap such that λt λt 1 Cd for all t 1, ., T 1 and Cd 0. Denote theb1 , ., vbT . Under “sign sub-Gaussian condition” (Han and Liu, 2013), withestimated topics to be vsuitable choice of tuning parameters, with probability at least 1 O(d 1 ), we havers log db t k2 C ·kvt v,(2)nfor some constant C.Note that when X follows a Gaussian or elliptical mixture distribution, the topics are the leadingeigenvectors of E(XX T ). To connect our topic model with existing work, suppose we have T topics[v1 , ., vT ] W Rd T where each column vt Rd is a topic. We assume that the observed datamatrix X Rn d is generated through some random combination of topics v1 , ., vT ; i.e., weassume that the observed data matrix XT WA where the random matrix A RT n is generatedfrom some unknown distribution. In Deerwester et al. (1990), a singular value decomposition ofthe observed data matrix XT UDVT is conducted, such that if the columns of U are viewedas the topics, then A DV can be viewed as a random combination matrix. It is easily seenthat if d is fixed and n , the columns of U converge to the leading eigenvectors of E(XX T )asymptotically. Thus, our definition of topics can be viewed as a generalization of that of Deerwesteret al. (1990).Our topic modeling framework, based on a transelliptical mixture distribution, is nongenerative,in distinction to the bulk of the literature on topic modeling, which focuses on generative models(Blei et al., 2003; Mimno, 2012). Our topics are defined in the latent space and the transformationsto the observed data are treated as nuisance parameters; however, the topics in the latent spacecan be viewed as informative summaries of the distribution of the random vector X.2.3TROPIC for TF-Biological Context AnalysisWe now introduce the TROPIC method for conducting TF-biological context analysis. Given atranscription factor and a biological context, we first identify the biological context’s feature genes6
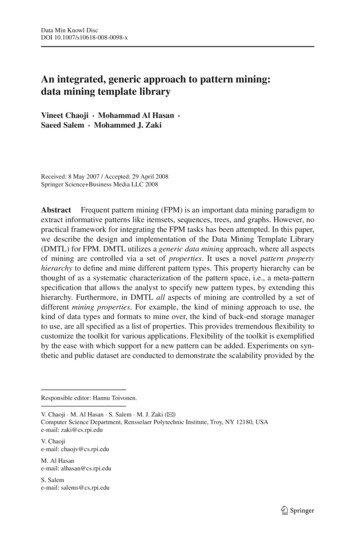
using the estimated topics from the gene expression data. Next, we exploit the ChIPx data toidentify the top target genes of the TF. We then test if the feature genes of the biological contextand the top target genes of the TF have significant overlap. If so, we conclude that the featuregenes and target genes significantly match, and the TF is deemed functionally significant in thebiological context.b1 , vb2 , ., vbT be the estimated topics from the gene expression profiles X. WeIn more detail, let v(m)blet vdenote the leading eigenvector of the estimated latent mean-adjusted covariance matrixof Xm , which can also be viewed as the leading “topic” of the m-th biological context. We canb (m) as encoding summary information for the m-th biological context. However, the sampleview vsize of the m-th biological context is possibly very small, which results in the instability of the b (m) . To resolve this problem, we regress vb (m) on the population topics vb1 , vb2 , ., vbTestimated v mbmK which explains the greatest fraction of the variability.bm1 , ., vto identify a subset S v(g)(g)We then construct a binary feature vector, vm , where vm (i) 1 if there exists some k such that(g)bmk (i) 6 0, and vm (i) 0 otherwise, where v(i) denotes the i-th component of v.v(m)We further construct a binary target gene vector ujcorresponding to the j-th TF. The(m)elements of uj corresponding to the top target genes of the j-th TF are set to be 1, where wefirst use CisGenome (Ji et al., 2008) to perform peak detection using the ChIPx data of the j-thTF, and then we use ChIPXpress (Wu and Ji, 2013) to identify the top target genes of the TF.(g)(m)We then test if vm and uj have significant overlap. If so, we conclude that the feature genesof the m-th biological context significantly match the target genes of the j-th TF, and infer thatthe regulation of the j-th TF is functionally important in the m-th biological context. A moredetailed presentation of the protocol can be found in the Appendix C.3Results and DiscussionsWe apply the TROPIC method to the analyze the association between 38 TFs and a total of 68tumor-related biological contexts where the sample sizes of each biological contexts are greater than20. In this section, we discuss several important biological findings that arise from this analysis.3.1TROPIC Reliably Predicts TF Signature in a Conserved Cohort of TumorTypes with ChIPx Data from Different SourcesTo test the hypothesis that the adaptively selected target genes from the ChIPx data representthe major targets of a TF, we use the TROPIC method to examine the association between majortargets of MYC and 68 sources of tumors, with ChIPx data from 6 sources, respectively. The ChIPxdata are different in the prepared laboratory and cell type. As shown in Figure 3A, ChIPx data forMYC predicts a conserved cohort of tumor types (14/18), suggesting our selection criteria faithfullypreserves major targets of MYC regardless of the origins of the data. In particular, as shown inFigure 3B, ChIPx data from three different cell types predicts MYC signature in 12 tumors sharedby all cell types. The cell types chosen are originally from umbilical vein endothelium (HUVEC),lymphoblastoid tumor (GM12878), myelogenous leukemia (K562), and cervical malignant tumor7
AAChIPSources37BiologicalContextA5CLK ellLPo insi e: MBtivCele aligAB l: Lna naon ypl ntmeas MphMBtic elaaorerrmow aLy moasmnB t: T : Tph are-Auomas mor LLt:aBre Tum LGasor LAt:CStTlaross ummaEw ica orPosin l Hodgt-MKTg56 um kin eno2C or:LpelLuB ym aulsangL on p: L ine e T hom lLu:uung ng CM mo aL:rCLy Tuam mo nceporCrMelC blalLF7stoin:idMBeelran ea CesllLiM om t Ade neelaanBL: no sM omM carelan a M ela cinSq om eta nom omaua a M staaCtmou eta ic D ellsLisertaneCer tic ivatDvica er ivel E iva s,Lutipith ves ngelliu , S.Cm:Tumor(HeLa), which have distinct cellular physiology. Experimental variance is another concern forextrapolating TF function to a new biological context. We compare the outcomes of TROPICfrom two laboratories and found K562 cell-derived and GM12878 cell-derived ChIPx data predictMYC signature in a highly overlapped cohort of tumors, 12/14 and 14/16, respectively, as shownin Figure 3C. Together, the results indicate that our selection criteria to process ChIPx data canreliably predict TF signatures in new biological contexts.UTA: HUVECUTA: GM12878UTA: K562Yale: HelaYale: GM12878Yale: K562BC1111112101120: UTA HUVEC: UTA GM12878: UTA K56221212211420: Yale K562: UTA K562: Yale Hela: Yale GM12878: Yale K562: UTA GM12878: Yale GM12878Figure 3: TROPIC predicts the TF signature in a conserved cohort of tumor types with ChIPxdata from different sources. (A) The diagram that shows significant biological contexts from 68tumors for MYC. The horizontal panel shows significant biological contexts. The vertical panelshows sources of ChIPx data for MYC. The red color indicates an adjusted P-value 0.05. (B)A Venn diagram of the number of significant biological contexts for ChIPx data from different celltypes. (C) A Venn diagram of the number of significant biological contexts for ChIPx data fromdifferent laboratories.3.2TROPIC Predicts TF Signature in a Bigger Cohort of Tumor Types thanChIP-PEDChIP-PED is an alternative method to predict TF signatures in biological contexts where ChIPxdata are not available. To estimate the accuracy of our TROPIC method, we choose ChIPx datafor MYC and SET-DB1, which represent a TF and an epigenetic protein, and apply the TROPIC8
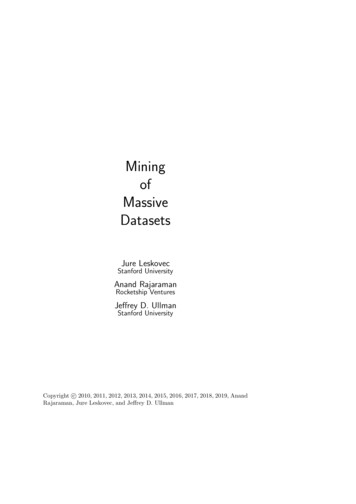
method to predict associations of TFs with 68 tumors. Note that throughout the paper, we usethe FDR method (Benjamini and Hochberg, 1995) to adjust the P-values for multiple comparison.However, for a fair comparison in Figure 4, we adjust the P-values of the two methods usingBonferroni’s method as ChIP-PED does. By applying Bonferroni’s adjusted P-value of 0.05 as thethreshold, the results show that the tumor types predicted by ChIP-PED have significant overlapwith that predicted by the TROPIC method as shown in Figure 4. In particular, the TROPICmethod predicts MYC signature in seven tumors (Figure 4A, ChIPx source: UTA GM12878 withoutMCF7) whereas ChIP-PED predicts MYC signature in a sub-cohort of four tumors. Two typesof lymphoma and K562 cell line are predicted by both methods, which is supported by previousstudies (Li et al., 2003; Slack and Gascoyne, 2011). Melanoma is another common tumor typeaffected by MYC (Zhuang et al., 2008; Leonetti et al., 1996), which is predicted by our method.Similarly, ChIP-PED predicts SET-DB1 signature in a sub-cohort of 6 tumors out of 11 predictedby the TROPIC method as shown Figure 4B. Both TROPIC and ChIP-PED methods predictmelanoma as a significant biological context, which is consistent with a recent study (Ceol et al.,2011). The difference is likely due to the additional assumption by ChIP-PED method, whereChIP-PED assumes that the target genes and TF will both have significantly high/low expressions.Meanwhile, our TROPIC method sets no threshold value for the expression level of TFs and doesnot match the expression level of target genes to the expression level of TFs. It is reasonable thataltered expression of TF contributes to changes in its target genes, especially given that tumorcells are known to show increased activity of oncogenic TFs (Darnell, 2002). However, increasedactivity of TFs is not necessarily associated with increased level of expression. It is known thatchromosomal translocations and point mutations in oncogenic TFs, cofactors, or epigenetic proteinscan contribute to increased activity of TFs. In addition, decreased activity of TFs, cofactors, orepigenetic proteins can be counted as features of the biological context by the TROPIC method,so long as the inactivation leads to a dramatic change on target genes. This extends the power ofTROPIC to predict TF signature in a biological context that has inactivated TFs, as commonlyobserved in chromosomal transcolations and truncations. In summary, the TROPIC method canpredict the TF signature regardless of the expression level and the activation status of the protein,and thus provides a bigger cohort of tumor types for a specific TF.3.3TROPIC Predicts Novel Biological Contexts in TumorsTo test whether the TROPIC method is applicable to other regulators of gene expression, wefurther apply the transelliptical topic modeling framework to context-specific analysis of ChIPxdata comprising 38 TFs, cofactors, and epigenetic proteins, and gene expression of 68 tumor types.3.3.1Epigenetic Regulators are Relevant to Many Tumor TypesEpigenetic control of gene expression is emerging as a crucial contributor to tumorigenesis andmetastasis (Suvà et al., 2013). Histone methylation is an important and widespread form of epigenetic mechanism. Emerging evidence indicates that deregulation of histone methylation contributesto tumor formation (Martin and Zhang, 2005; Greer and Shi, 2012; Dawson and Kouzarides, 2012;9
AAMethod37BiologicalContextMYC5CLK ellLPo insi e: MBtivCele aligAB l: Lna naon ypl nte mpas MMhelBare arr om ticow aLy moasmnaB t: T : Tprehoas um ALmLort:aBre Tum LGLAasoC t: T r Slatromss umaEw ica orPosin l Hodgt-MKTg56 um kin eno2C or:LpelLuB ym aulsangL on p: L ine e T hom lLu:uung ng CM mo aL:rCLy Tuam mo nceporCrMelC blalLF7stinM : B oideelreCanasellLotmMAide neelaanBL: no sM omM carelaelanMa cinSq om eta nom omaua a M staaCtmou eta ic D ellsLisertaneCer tic ivativDvica erel E iva s,Lutipith ves ngelliu , B15CLK ellPo Linsi e:Btiv MCaell P e A lignBrog nap anCella t MeB l: L nito stic elloayLy mod mp r: Am onB : Le hom LLpho aonukameemaMBiaon arroewM:MCer arrviow yelx:om:Cala Ca T-AssncLLiFa ca ervo l HorFa ab dgkivo lenHrLiLe abl sto ymelftpoFr His gy hotoW maLu onltoalnggy ilmLW sTLu : Lu obilm umng ng e:orGs:T ClLyiaob Tum : Num nmolapo or cerst or: n-RCblomMeReCael lapllF7 stapLi asoinese edM :BrCelan eas ellM om t A Linelan a B den esM om L: M ocaelan a M ela rcinoYo om eta nostm maalksa Me atic a CtceTu ast De ll Lm ati riviorat nec: T De ivum riv e,Luor ative ng,S.CChIP-PEDTROPIC 1ChIP-PED 1TROPIC 2ChIP-PED 2Figure 4: Comparison between TROPIC and ChIP-PED. (A) Diagram that shows significant biological contexts from 68 tumors for MYC computed from TROPIC and ChIP-PED. The red squareindicates an adjusted P-value 0.05. (B) Diagram that shows significant biological contexts from68 tumors for SET-DB1 computed from TROPIC and ChIP-PED, where the first two rows indicatethe results from one ChIPx dataset, and the last two rows show the results from another ChIPxdataset. The red square indicates an adjusted P-value 0.05.Chi et al., 2010). We include several epigenetic regulators in the TROPIC analysis and present theresults as shown in Figure 5.SUZ12: Multiple subunits of polycomb repressive complex 2 (PRC2) that trimethylates histone 3 lysine 27 are either mutated or dyeregulated in different tumors (Sparmann and van Lohuizen, 2006). SUZ12 is a core subunit of PRC2. Previous studies report altered expression levelof PRC2/SUZ12 in a wide range of human primary tumors, such as T cell acute lymphoblasticleukemia (T-ALL) (Ntziachristos et al., 2012), ovarian (Li et al., 2012, 2007), metastatic prostate(Yu et al., 2007), lung (Martı́n-Pérez et al., 2010), melanoma (Martı́n-Pérez et al., 2010), brain andglial tumors (Crea et al., 2010). To test whether the SUZ12 signature is present in tumors, we applythe TROPIC method to analyze SUZ12 in human tumor samples. The results indicate that SUZ12signature is present in 48 out of 68 tumor samples (70.59%), including most of the reported tumortypes as shown in Figure 5. Genetic manipulation of SUZ12 results in difference in tumor proliferation in the context of ovarian cancer and mantle cell lymphoma (Li et al., 2012; Martı́n-Pérez et al.,2010). However, whether the function of SUZ12 in other tumor types is significant is largely un10
HippoPathwayChIPProteinsGABPssicol al HonodEw : Tu gkm ininLyorgmFa Tuphvo momra or:blaFaBeovoneHisrato TublGmloeergy orHmiWG Ce stoilliololgy msbl l: TuaTWmsK56 toilm umm oror2sLe Ce a: TTu : Nonft ll L ummFrorionLe o: R Relreauk nta : Nelolap pseeLi mi Lo rmsepo abasa Ce e: G lllrLilpo com s: A iobsacu lasaLu rco Cu te L tomltumngare ym a:pCLu Adul :inc hotung enbre uba lao:st:intLu Lu carcu ed ic Lcing ngwith eu: T Ca nom batkeLyeum ncdadmerw oxo miaopithCruM ob relam laPlLB bicm stoSininar ideMyCCGF7la ell LndM :Bielr: T nesan eaumsM om t Aelde oran a BnM om L: M ocaelan a M ela rcinoO om eta nom mavasaaria M tatCeicOnva Tu tasD ellrim tat eriv LinicoreO anva Tu : E D ativereria mnor do iva , LnOt:mTiv ungvaum Meu eryor ci troi , S.CPo : C: S no dastncer userouPr io ersos r FostatRig e: T sa:PhtuFr mo ilocSkonytricinta:AlLstSk Meobroin lae:cy: M noGtolioSqet mamblua asaastamtictoSq oumua sMaem Ceou ll lanT:omCel s C CaalYo : A erv rciniclk cual omsa teaELcTu ym pithm pheorob lium:Tl:Tum astumor ic Leu ogicalContext5Cecu ll LteineLALK ym : MaPo pho ligBnabsCntel itiv lasMB l Pr e A ticelamec na LeCelupuB l P rso las kem onatC roelge r: A ic L ial:C nito LL ymBhrphCon r: Aeloml:Ly ic L LLBaladd mp ymphhoB erobmlaTuaddlamstB er: or:iclaLedd mT T2uk-4CeBemla r: s CstTiasCan CBlododMonB :Auclocod utleeaB : Le My r Coneluk eleem oid ls:MBLe Leon arr iauk ukoweem emB Maiarr Mooniaow noe: A nuB Maoncrce row ute learC:CB MaLonelrhr yme roph ls:oB Ma w: L nioc AMoncrreyLLueoM w: ke ym ticBLeon arro Mu mia phouklcewemyt: M tiplB Maiconry eLe iae row elo Myeukm:TB Maloemraamin rro -ALaia: G w:LBlio Wraainb: T la ldesBre um to nstmasoa romB t: C rsreMas anaccet:roBglre Ca rncobasulB t: T er Dinreuemutas maoriat:lBre TumasotrBre : Tu EpasithmB t: T or L elirear umas umor get:lyBre Tum LarOpgas
Given the massive amount of genomic data, computa- . modeling framework for exploring and analyzing large and complex genomic datasets. Under this framework, we develop new statistical optimization algorithms and semiparametric theo- . including text mining (Blei et al.,2003;Mimno,2012), social media analysis (Purushotham et al.,