Transcription
NBER WORKING PAPER SERIESU.S. TRADE POLICY IN HISTORICAL PERSPECTIVEDouglas A. IrwinWorking Paper 26256http://www.nber.org/papers/w26256NATIONAL BUREAU OF ECONOMIC RESEARCH1050 Massachusetts AvenueCambridge, MA 02138September 2019I am grateful to Gene Grossman for helpful comments. This paper is forthcoming in the AnnualReview of Economics. 10.1146/annurev-economics-070119-024409. The views expressed hereinare those of the author and do not necessarily reflect the views of the National Bureau ofEconomic Research.NBER working papers are circulated for discussion and comment purposes. They have not beenpeer-reviewed or been subject to the review by the NBER Board of Directors that accompaniesofficial NBER publications. 2019 by Douglas A. Irwin. All rights reserved. Short sections of text, not to exceed twoparagraphs, may be quoted without explicit permission provided that full credit, including notice, is given to the source.
U.S. Trade Policy in Historical PerspectiveDouglas A. IrwinNBER Working Paper No. 26256September 2019JEL No. F13,N71,N72ABSTRACTThis survey reviews the broad changes in U.S. trade policy over the course of the nation’s history.Import tariffs have been the main instrument of trade policy and have had three main purposes: toraise revenue for the government, to restrict imports and protect domestic producers from foreigncompetition, and to reach reciprocity agreements that reduce trade barriers. These three objectives– revenue, restriction, and reciprocity – accord with three consecutive periods in history whenone of them was predominant. The political economy of these tariffs has been driven by theinteraction between political and economic geography, namely, the location of trade-relatedeconomic interests in different regions and the political power of those regions in Congress. Thepaper also addresses the impact of trade policies on the U.S. economy, such as the welfare costsof tariffs, the role of protectionism in fostering American industrialization, and the relationshipbetween the Smoot-Hawley and the Great Depression of the 1930sDouglas A. IrwinDepartment of EconomicsDartmouth CollegeHanover, NH 03755and NBERdouglas.irwin@dartmouth.edu
Trade Policy in American Economic History1. IntroductionA country’s trade policy affects the prices that prevail in its domestic market andtherefore the allocation of the country’s resources. It should come as no surprise, therefore, thattrade policy is politically contentious because dollars and jobs are at stake whenever importduties are adjusted up or down. As a result, trade policy issues have been a perennial part of theAmerican political debate.This article focuses on what can be learned from the history of U.S. trade policy. It willaddress some of the key questions about the political economy of trade policy and the economicimpact of those policies. This brief survey will not address how international trade itself hasshaped the U.S. economy, but concentrate on the factors driving trade-policy outcomes and theeconomic consequences of some of those policy outcomes. In doing so, I draw extensively onmy recent book Clashing over Commerce: A History of U.S. Trade Policy, which provides acomprehensive look at historical evolution of U.S. trade policy.Section 2 provides an overview of the three main purposes of imports tariffs – revenue,restriction, and reciprocity, as will be explained below – and the three eras in which one of thosepurposes was predominant. The interplay between political and economic geography will beexamined as some of the key political economy factors shaping trade policy. Along with therules of the political system, these underlying factors ensure that policy is stable and has a strongstatus-quo bias. Section 3 examines how the history of U.S. trade policy sheds light on theclassic issues of gains from trade and costs of protection. Section 4 looks at the impact of tradepolicy on the American economy by addressing three long-standing historical questions: Howlarge were the economic stakes in the contentious North-South conflict prior to the Civil War?1
Did protective tariffs accelerate U.S. industrialization and promote economic growth in the latenineteenth century? Did the Smoot-Hawley tariff of 1930 spark a trade war that led to the GreatDepression? Section 5 offers some concluding thoughts.2. Three Eras of U.S. Trade PolicyInternational trade consists of exchanging exports of domestic goods and services forimports of foreign goods and services. Governments can either encourage this trade withsubsidies or discourage it with taxes. This gives us four possible trade policies to consider:export taxes, export subsidies, import taxes, and import subsidies.With respect to the United States, two of these four policies have little relevance: importsubsidies are almost never employed by any country, the United States being no exception, andexport taxes are expressly prohibited under article 1, section 9 of the Constitution.1 This leavesexport subsidies and import taxes. The United States has sometimes employed export subsidies,but never on a large scale because of their budgetary cost. 2 Instead, import tariffs have been thecentral focus of U.S. trade policy since the establishment of the federal government in 1789. 3What objective is a government trying to achieve in levying taxes on imports? Threeobjectives stand out: to raise revenue for the federal government, to restrict imports and protectdomestic producers from foreign competition, and to achieve reciprocity through agreements thatreduce trade barriers. In Clashing over Commerce, I dub these the “three R’s” of trade policy:revenue, restriction, and reciprocity.1At the constitutional convention of 1787, Southern states insisted that export taxes be banned. These statesproduced most of the nation’s exports and feared that Northern states would enact such taxes at their expense; seeIrwin (2017, 64).2The Export-Import Bank was created in 1934 to provide credit guarantees for exporters, but its overall financialsupport for exports has been small. For a history of the bank, see Becker and McClenahan 2003.3Import quotas and voluntary export restraints were infrequently used policy instruments until the mid-twentiethcentury.2
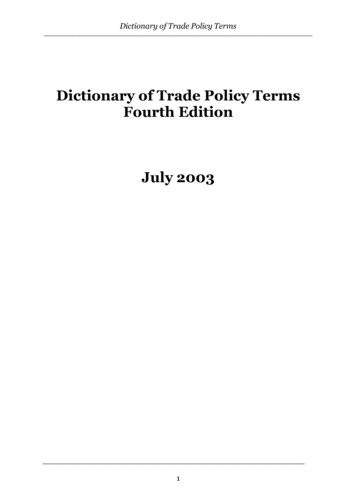
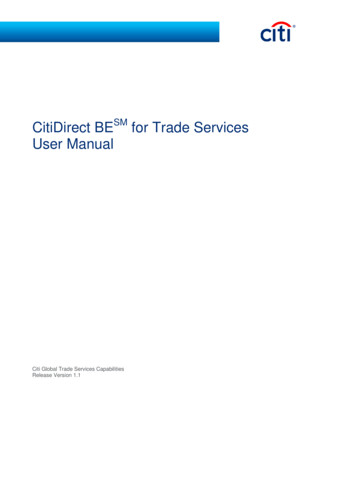
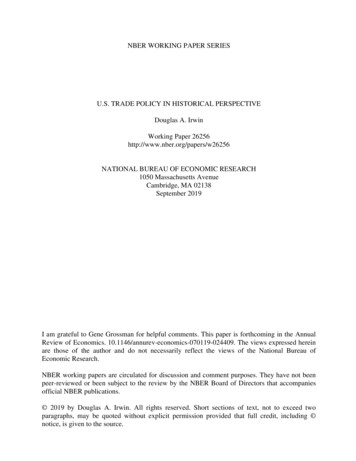
At any point in time, all three objectives can be in play. Yet the history of U.S. tradepolicy can be divided into three eras in which one of them is predominate. From 1790 to 1860,revenue considerations were paramount in the setting of tariffs because import duties raisedabout 90 percent of receipts of the federal government. From 1861 to 1933, government revenuecame increasingly from domestic taxes and therefore import duties were imposed mainly toprotect domestic producers from foreign competition. 4 And from 1934 until 2016, the primarygoal of trade policy has been to reach trade agreements with other countries, either multilaterallythrough the General Agreement on Tariffs and Trade (GATT) and the World Trade Organization(WTO), regionally in agreements such as the North American Free Trade Agreement (NAFTA)or the Central American Free Trade Agreement (CAFTA), or bilaterally in agreements withcountries such as Israel, Singapore, Australia, Korea, and others. (To judge from his Tweets,President Trump approves of tariffs for their ability to achieve all three goals of revenue,restriction, and reciprocity simultaneously.)Figure 1 shows the average tariff on total and dutiable imports from 1790 to 2018. 5 Theaverage tariff on total imports includes imports of all goods (dutiable and duty-free), whereas theaverage tariff on dutiable imports includes goods that are subject to import duties. A large gapbetween these two series appeared after the Civil War when some products (such as coffee andtea, bananas and tin) were put on the duty-free list. These items were generally not produced inthe United States so that no domestic producer would be harmed by giving the goods free entry.4After the Civil War, the federal government introduced other domestic taxes to raise revenue and import dutiesaccounted for only about half of the government’s revenue. The revenue effects of tariffs were still important, asIrwin (1998b) shows in the context of the Laffer Curve, but the goal of protecting import-competing producers wasconsidered more important. After the introduction of the income tax in 1913, import duties accounted for a verysmall fraction of government revenue.5This series is based on tariff revenue divided by total imports or dutiable imports. As has long been recognized,this measure is far from perfect, but there is no ideal single measure of a country’s tariff policy. See Anderson andNeary (2005) and Irwin (2010).3
Since the 1980s, free-trade agreements have also allowed some countries to export their goods tothe United States without facing any duties. Setting aside such imports, the average tariff ondutiable imports can be interpreted, somewhat simplistically but still usefully, as the averagedegree of protection given to domestic producers facing foreign competition.In Figure 1, one can see a rough delineation of these three eras. In the revenue periodfrom 1790 to 1860, average tariffs rose from about 20 percent to 60 percent and then fell backdown to 20 percent. In the restriction period from 1861 to 1933, the average tariff on dutiableimports jumped to 50 percent and remained at about that level for several decades. In thereciprocity period from 1934 to the present, the average tariff fell sharply, and then leveled off atabout 5 percent. (In 2018, there is a very slight uptick in the average tariff as a result of theTrump administration’s duties on imports from China and on imports of steel.)4
Figure 1: Average tariff on dutiable and total imports, 1790-20187060Dutiable ImportsTotal Importspercent504030201001790 1810 1830 1850 1870 1890 1910 1930 1950 1970 1990 2010Source: Irwin (2017, 6), updated with data from the U.S. International Trade Commission.Shifts in the average tariff often reflect deliberate changes in tariff rates enacted byCongress in legislation or negotiated by the president in trade agreements. 6 Yet most tariff actsand trade agreements maintained the continuity of existing policy by making only incrementalchanges to the structure and rate of import duties. Many of the fluctuations seen in Figure 1 donot reflect deliberate policy actions by the government, but movements in import pricesinteracting with specific duties, which are a tax of a particular dollar amount per importedquantity rather than a percent of the import value. For most of U.S. history, specific dutiescomprised about two thirds of the rates in the tariff schedule. The ad valorem equivalent of6From 1815 to 1930 (excluding the Civil War), Congress enacted 19 major revisions to the tariff schedule, aboutevery 6 years.5
specific duties is inversely related to the price of imports. 7 As a result, exogenous fluctuations inimport prices have sometimes produced large changes in average tariffs, even when there was nochange in the actual rates of duty set by policymakers and applied to imports.For example, the sharp rise in prices during World War I followed by their equally sharpfall after the war moved tariffs down and up and largely account for the downward spike inFigure 1. Similarly, severe deflation during the Great Depression in the early 1930s followed byrising prices in the mid-1930s helps account for the upward spike in tariffs during that period.Most of the dramatic reduction in the average tariff during and after World War II reflects thehigher inflation of that period. The average tariff on dutiable imports dropped from 33 percent in1944 to 12 percent in 1950; about two thirds of this decline was driven by higher prices and onethird by the tariff reductions negotiated at the first GATT conference in 1947. Irwin (1998a)finds that about 80 percent of the decline in tariffs from their peak in the early 1930s to the early1950s was due to higher prices.Although the average tariff on dutiable imports has fluctuated considerably over time, theunderlying tariff rates chosen by policymakers have been much more stable than the figuresuggests. The basic levels are set by policymakers to achieve the objectives of revenue,restriction, or reciprocity. What political economy factors help determine the average height ofimport duties and their structure across goods?2.1 Political Economy and Policy StabilityUnder the Constitution, Congress has the primary authority over trade policy andtherefore it is the principal forum in which decisions about tariffs have been made. From 1790-7See Crucini 1994 and Irwin 1998a. For example, a 5 specific duty on a 100 shirt would amount to a 5 percent advalorem duty. If the shirt’s price fell to 50, the ad valorem equivalent would rise to 10 percent; if the shirt’s pricerose to 200, the ad valorem equivalent would fall to 2.5 percent.6
1930, Congress voted on legislation that set the rates of duty on all imports. Beginning in 1934,however, Congress began delegating to the president the authority to negotiate trade agreementsand no longer votes on the tariff schedule itself. Congress now occasionally votes on whether togrant such negotiating authority and, since 1979, on any agreements submitted by the president. 8The standard assumption is that members of Congress seek to be reelected and thereforevote on legislation in a way that satisfies the interests of their constituents. 9 These constituentinterests tend to be producers, not consumers, because producers are usually better organized forpolitical action and employ many workers who are voters. The nation’s Founding Fathersrecognized that various factions would seek to pressure legislators to vote for their owneconomic benefit, especially on trade policy. As James Madison wrote in Federalist 10: “Shalldomestic manufactures be encouraged, and in what degree, by restrictions on foreignmanufactures? are questions which would be differently decided by the landed and themanufacturing classes, and probably by neither with a sole regard to justice and the publicgood.” He was pessimistic about whether “enlightened statesmen will be able to adjust theseclashing interests, and render them all subservient to the public good.” That concern, in part, iswhy the founders created a political system that made the passage of legislation difficult, therebyforcing different factional interests to compromise with each other.The nation’s producer interests are not uniformly distributed across the country becausedifferent regions specialize in different economic activities. This regional specialization can8In the grants of negotiating authority since 1934, the president has been authorized to reduce tariffs by up to acertain percentage. Starting with the Tokyo Round of trade negotiations (1973-79), international agreements havegone beyond tariffs to include the regulation of nontariff barriers. These provisions require changes in domestic lawand hence Congressional approval is required.9This is a reasonable presumption because this is how members of Congress behave and even what they tell us. In1881, Senator Thomas Bayard observed: “The member of the Senate and House are the advocates andrepresentatives of different local interests all of which naturally seek to influence the transactions of the governmenton their own behalf.” Quoted in Irwin 2017, 700n81.7
persist for many decades. 10 For example, for about two centuries, cotton has been produced inMississippi and Alabama, corn in Iowa and Illinois, wheat in Kansas and Nebraska, tobacco inKentucky and North Carolina, sugar in Louisiana and Florida, coal in Pennsylvania and WestVirginia, iron and steel in Pennsylvania and Ohio, and farm equipment in Illinois and Indiana. Inthe twentieth century, automobiles have been produced in Michigan, aircraft in Washington, andhigh-technology and intellectual-property-intensive products in California, and so forth.The persistence of this regional specialization is consistent with region-specific resourceendowments (such as arable land suitable for certain crops) or locational advantages that implysignificant adjustment costs in moving capital and labor between regions. These factors lock in astate’s production pattern for many decades. Political economy models of trade policy, such asBaldwin (1984) or Grossman and Helpman (1994), reflect this fact by using a specific factorsframework, wherein capital and labor employed in a particular industry are not mobile acrosssectors of the economy. This framework implies that trade-related interests cut along industrylines, depending on whether they produce goods for export or produce goods facing competitionfrom imports: workers in exporting industries have an interest in low tariffs and workers inindustries competing against imports have an interest in high tariffs. 11Just as the geography of production tends to be stable over time, the pattern of trade – thetypes of goods a country exports and imports – also tends to be stable over time. This is becausethe deep determinants of trade (technology and factor endowments) evolve slowly. Being10As Holmes and Stevens (2004, p. 2008) note, “For industries producing nontradable goods or services like retail,there is little [geographic] specialization, while for tradable goods like manufactures, mining output, and agriculturalproducts, there is a substantial amount of specialization across regions.”11Other models focus on mobile factors of production and have political divisions based on different interests ofthose factors (landowners, capital owners, different types of labor, etc.) rather than industry; see Hiscox (2002) forhistorical evidence and Blonigen (2011) for recent evidence on the question of specific versus mobile factors.Median voter models that treat trade policy decision as a national referendum, such as Mayer (1984), are aninteresting benchmark, but models that emphasize legislative voting, such as Grossman and Helpman (2005), aremore in line with historical experience.8
resource rich, the United States has tended to export land-intensive agricultural products andresource-intensive manufactured goods. For most of the nineteenth century, the United Statesexported cotton, wheat, and other agricultural produce and imported manufactured goods andconsumer products (coffee) or raw materials (tin). Due to its high land-to-labor ratio, the UnitedStates has always been a high wage country and a net importer of unskilled labor-intensivemanufactured goods, such as textiles and apparel. 12The stable geographic location of domestic production and the stable composition offoreign trade means that regional economic interests are stable over time. Both factors produce astable political geography of Congressional voting on trade policy. Of course, should anindustry’s geographic location shift or the composition of trade change, regional economicinterests will be affected and Congressional voting patterns would adjust accordingly. A goodexample of an industry changing its geographic location is the gradual migration of the cottontextile industry from New England, where it originally arose in the early nineteenth century, tothe South in the early twentieth century. A key example of a changing trade pattern is America’sshift from being a net importer to a net exporter of manufactured goods in the late nineteenthcentury due to the exploitation of mineral resources. 13 Yet such changes tend to happengradually, which again means that stability is the general rule.These claims about the stability of policy are supported by looking at the geographicconfiguration of Congressional voting, the structure of the tariff over time, and the pattern ofpartisanship over trade issues.12Of course, cotton exports were based on the mass use of unskilled (slave) labor before the Civil War.In the mid-1890s, the United States became a net exporter of natural-resource-intensive manufactured goods,which slowly began to crowd out exports of cotton and other products. Wright (1990) examined the factor content ofU.S. trade in manufactures from 1879 to 1940 and showed that exports were intensive in non-reproducible naturalresources. Irwin (2003a) finds that the exploitation of the massive Mesabi iron ore range in the 1890s led to a sharpincrease in iron and steel exports.139
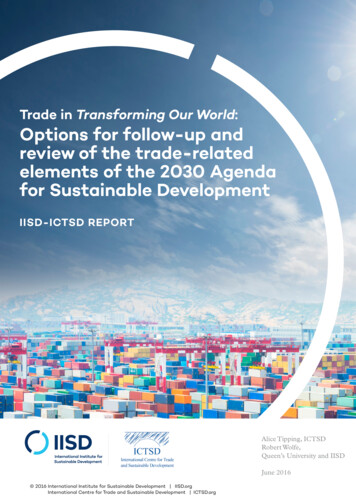
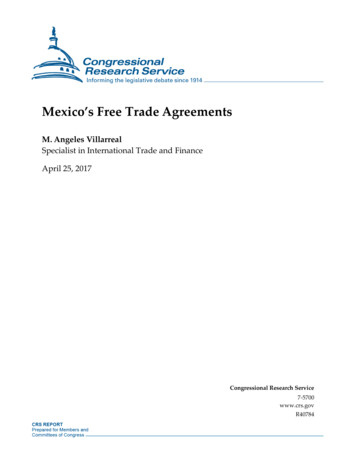
2.2 Stable Congressional VotingBecause political representation is based on geography, regional economic interestsshould translate into consistent voting patterns in Congress over time. For most of the nation’shistory, the most important political divide over trade policy has been a geographic one on aNorth-South axis. This reflected a stark division in the location of trade-affected production. Inthe early nineteenth century, a manufacturing belt developed that stretched across the Northeast,including cotton textiles in New England and iron in Pennsylvania and Ohio. These industriesusually faced competition from imports. Meanwhile, the South produced agricultural crops suchas cotton and tobacco that were exported. Consequently, from the time of the 1787 constitutionalconvention until the Smoot-Hawley tariff in 1930, Congressional voting on trade measures hasshown a distinctive North-South split.To illustrate the persistence of this divide, Figure 2 depicts voting in the House ofRepresentatives on two tariff bills more than a century apart, one in 1828 and another in 1929,the last House vote ever on the tariff schedule. Despite the vast changes in the U.S. economyover that century – including large-scale industrialization, mass immigration, westwardmovement in population, and enormous technological change – the Congressional vote isremarkably similar. Even today, representatives from the Rust Belt of old manufacturingindustries that stretches from upstate New York into the industrial Midwest are largely opposedto trade agreements, while representatives from the South and West tend to be more favorable tosuch agreements.10
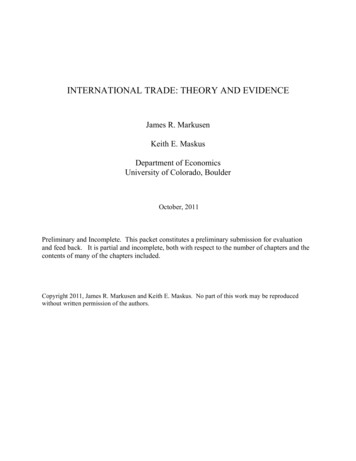
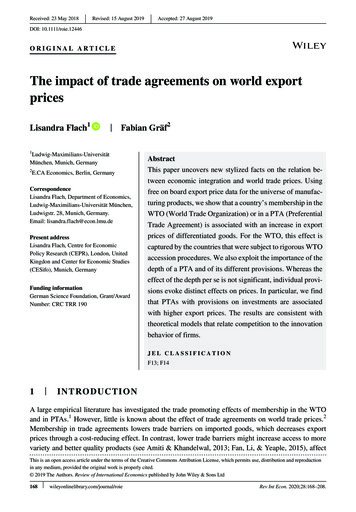
Figure 2: House voting on the tariff in 1828 (left panel) and 1929 (right panel)Source: Irwin (2017,16).2.3 Stable Tariff StructureThe structure of the tariff across goods has also been fairly stable over long periods oftime. Figure 3 presents a simple scatterplot of the average tariff for the major schedules of thetariff code in 1880 and in 1939. The tariff rates in 1880, which are largely those that emergedafter the Civil War, are highly correlated with those prevailing nearly 60 years later.11
Figure 3: Average Tariff Rate by Schedule, 1880 and 193990Tariff rate (percent) in tsCottonChemicalsAgricultureMetals SundriesFlaxPulpWood3020100010203040506070Tariff rate (percent) in 18808090Source: Statistical Abstract of the United States, various issues.Such an outcome is suggested by the Grossman and Helpman (1994) model of thepolitical economy of trade policy. They derive an expression that explains the structure of tariffrates across industries:𝑡𝑡𝑖𝑖𝐼𝐼𝑖𝑖 𝛼𝛼𝐿𝐿 𝑥𝑥𝑖𝑖 (1 𝑡𝑡𝑖𝑖 )𝑎𝑎 𝛼𝛼𝐿𝐿 𝑚𝑚𝑖𝑖 𝜀𝜀𝑖𝑖where Ii is an (exogenous) indicator that equals one if industry i is represented by a lobby group(and zero otherwise), a is the weight put on social welfare in the objective function of politicians,αL is the (exogenous) share of the population that is represented by lobbies, xi/mi is the inverseimport market share in industry i (xi being domestic output and mi being imports in sector i), andεi is the elasticity of import demand. The protection received by a sector is higher when it isorganized, when its output is high relative to competing imports, and when the priceresponsiveness of the corresponding trade flows is low. Unless the import share, the elasticity,12
the population share, or the weight on social welfare changes, the tariff rates would not beexpected to change.The biggest changes in the tariff usually have been the adjustment of the entire scheduleof rates up or down rather than adjustments to the scale of tariff rates across industries. Referringto the equation above, this suggests that the weight on social welfare (a) may change more thanthe factors affecting particular industries. Such shifts in policy arise from changes in the politicalpower of different political parties or regions of the country. Thus, a move to a lower level ofaverage tariffs (which comes from a change in the weight on social welfare in the model) doesnot reflect one political faction being more “subservient to the public good” than another, asMadison put it, but simply that an ascendant political faction puts greater weight on exportoriented producer interests than on import-competing producer interests.2.4 Partisan Divisions & Political RulesOne implication of different regions having different trade-related economic interests isthat political parties will take opposing positions on trade policy issues if they draw on differentregions for their political support. Each of the three eras of trade policy identified above –revenue, restriction, and reciprocity – has occurred in a period in which one political party waspolitically dominant and could implement its preferred policy. This is summarized in Table 1.In addition, political rules make it difficult to change policy and help lock-in the policypreferences of the dominant party. The passage of legislation requires the approval of the Houseof Representatives, the Senate, and the president. This usually can happen only when one partyhas unified control of government, i.e., when one party controls all three entities. If there is13
divided government, partisan differences make significant policy change unlikely and the statusquo remains secure. 14Table 1: Three Eras of U.S. Trade PolicyPeriodTrade Policy ObjectiveCongressional VotingDominant iff ScheduleDemocratsSouth1861-1933RestrictionTariff ating Authority &Trade AgreementsDemocratsMixedFrom 1837 to 1860, from the start of the Second party system until the outbreak of theCivil War, the Democratic party dominated American politics. Democrats drew their politicalstrength from the export-oriented South and their rallying cry was “a tariff for revenue only”because of their opposition to protective tariffs. This is why the average tariff fell from the early1830s to less than 20 percent by 1860, as shown in Figure 1. During this period there were 12Congresses, 7 with unified governments (6 under the Democrats, 1 under the Whigs) and 5divided governments. In other words, over this 34 year period, the Whig party from the Norththat favored higher protective tariffs was only in power for two years. They succeeded in raisingtariffs in 1842, but the Democrats promptly reversed this in 1846 after they regained control ofgovernment. During the 10 years of divided government, no changes were made to trade policy.14The status quo bias applies mainly to the opposition to tariff reductions, as in Fernandez and Rodrik (1991), whopoint out how domestic producers facing foreign competition are certain to lose but the gains to particularconsumers and exporters are uncertain.14
From 1861 to 1932, Republicans dominated American politics and drew their politicalsupport from the North, where manufacturing interests were concentrated. They wanted highduties to restrict imports, which is why tariffs jumped to 40-50 percent during the Civil War andremained at that level for several decades. During this period there were 35 Congresses, 21 withunified governments (17 Republican, 4 Democratic), and 14 divided governments. Over these 72years, Democrats only had two opportunities to reduce tariffs, which they did in 1894 and 1913.In each case, these reductions were immediately reversed when Republicans came back intooffice.In each of these eras, the existing trade policy was heatedly disputed by the oppositionparty. The status quo never went unchallenged, with one side or the other complaining that thecountry would be ruined if tariffs were not raised higher or lowered further. And yet, despite allthe debate and controversy, it proved very difficult to dislodge existing policies once they wereestablished. Partisan dominance and political rules enforced a status quo bias that kept tradepolicy relatively stable within the two eras.From 1933 to 1993, Democrats again dominated American politics and ensured thatreciprocity through trade agreements would reduce tariffs and keep them low. During this periodthere were 30 Congresses, 16 unified governments (15 Democratic, 1 Republican), and 14divided governments. During this 60 year period, very few changes were made to the overridinggoal of seeking reciprocal trade agreements, even during the two years (1953-55) in which theRepublicans had unified control of government.In the period since 1993, divided government has been more frequent, but the presidenthas usually been in favor of maintaining the status quo or furthering the reduction in trade15
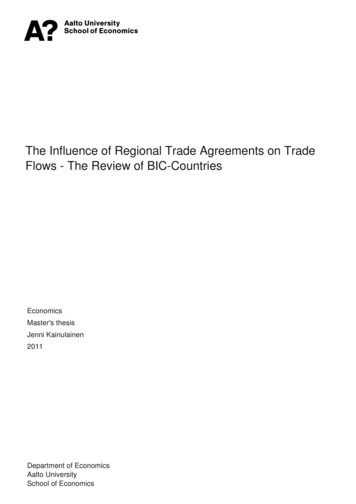
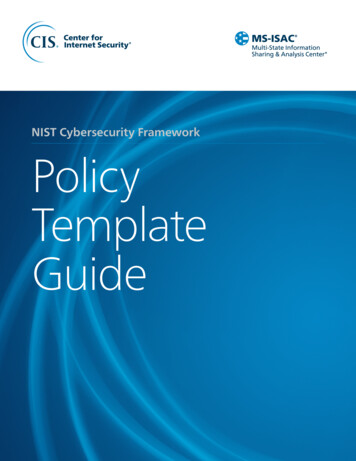
barriers. Donald Trump is the first president since 1930 who seems intent on raising importtariffs and import restrictions, not lowering them in trade agreements.Figure 4 illustrates the partisan division on trade by showing the percentage of each partyin the House voting for lower tariffs (or trade authority or trade agreements) or against highertariffs. From the 1830s until the 1970s, Democrats were uniformly in favor of lower tariffs.Republicans mainly voted in favor of protective tariffs, although after the Civil War theysupported reducing some duties on non-competing imports for consumers, such as tea andcoffee. After World War II, however, they began to support trade liberalization. From the early1950s until the early 1990s, there was a historically anomalous period of bipartisan consensusand the two parties voted in sync with one another. This
average tariff on total imports includes imports of all goods (dutiable and duty-free), whereas the average tariff on dutiable imports includes goods that are subject to import duties. A large gap between these two series appeared after the Civil War when some products (such as coffee and tea, bananas and tin) were put on the duty-free list.