Transcription
ECG BasicsRebecca Sevigny BSN, RN, CCRN
DISCLOSURESNone of the planners or presenters of thissession have disclosed any conflict orcommercial interest
ObjectivesIdentify the conduction system of the heart and thecomponents of the cardiac cycleDiscuss a systematic approach to rhythm interpretationReview common cardiac arrhythmiasDescribe the process for interpretation of a 12 lead ECG
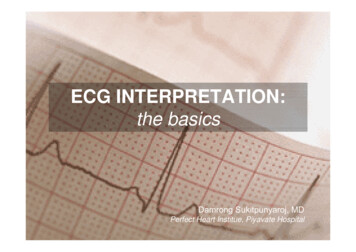
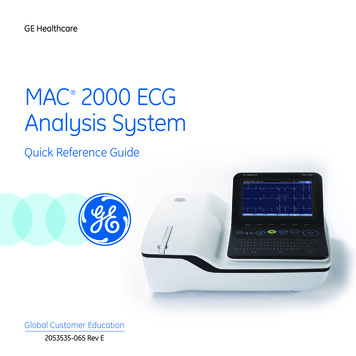
Pacemakers60-10040-6020-40 SA Node AV Junction Purkinje
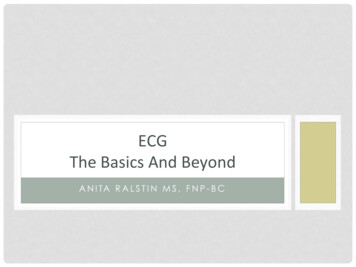
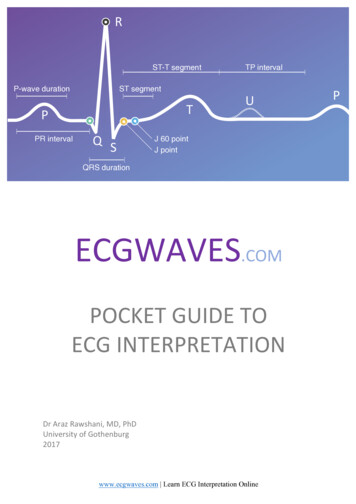
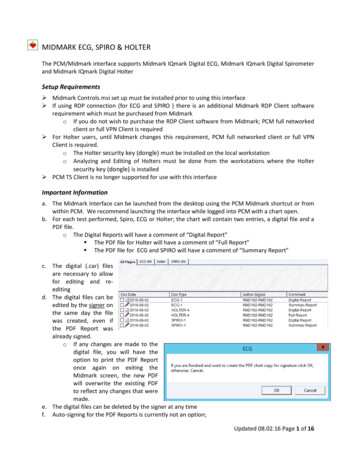
Conduction: Normal P-QRS-T
Normal P-QRS-TP WavePR IntervalST SegmentVentriculardepolarizationInterval betweenventriculardepolarization andrepolarizationMeasure from end ofQRS (J-point) tobeginning of T waveRepresentsAtrialdepolarizationDuration 0.12 seconds0.11 - 0.20 seconds0.06 - 0.11 secondsHeight 2.5 mmMeasure start of P waveto start of QRSShapeSmoothQ- First negativedeflectionR- First positivedeflectionS- Negative deflectionafter R waveOrientationPositive in LeadsI,II,aVF, V4Negative in aVRatrial depolarization anddelay at the AV Node(AV conduction time)QRS ComplexProlonged indicates aconduction blockShortened indicatesaccelerated conduction orjunctional in originIn relation to isoelectric line:Depression/Negativeindicates ischemiaElevation/Positiveindicates injury
Analyzing RhythmsRegularityQRSRatePRintervalP waves
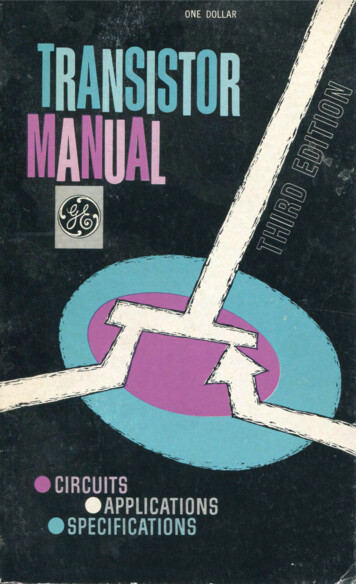
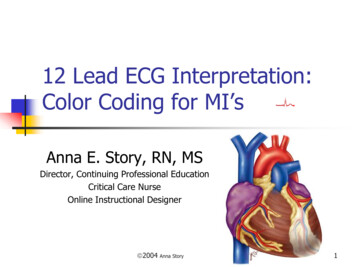
ECG Paper0.04 sec2 large squares 1 mV5 large squares 1 sec (1000msec)
Rate practice
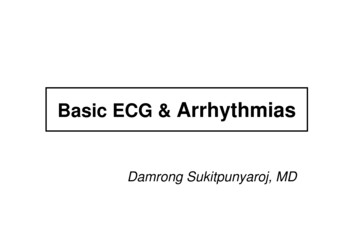
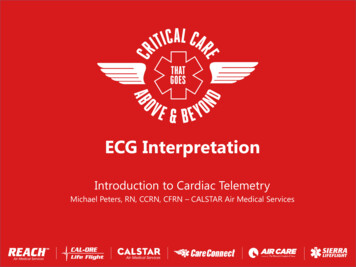
Guess the RhythmRate60-100RegularityVaries with respirationsP waveNormalQRSSinus ArrhythmiaNormalGroupingNoneDropped beatsNone
Sinus Block & PauseRhythmRateIrregular when SA block occursNormal or SlowRhythm Irregular due to pauseRateNormal to SlowP waveNormalP waveNormalPRIntervalNormal (0.12-0.20sc.)PRIntervalNormal (0.12-0.20sc.)QRSNormal (0.06-0.10sc.)QRSNormal (0.06-0.10sc.)NotesPause time is an integer multipleRuleof the P-P interval.RhythmNotesPause time is not an integerRulemultiple of the P-P intervalRhythm
WAP & MATRhythmMay be irregularRateNormal (60-100)P waveChanging shape from beat tobeat. At least 3 different shapesPRIntervalVariableQRSNormal (0.06-0.10sc.)NotesIf HR exceeds 100 may be MAPRhythmIrregularRate 100P waveChanging shape from beat tobeat. At least 3 different shapesPRIntervalVariableQRSNormal (0.06-0.10sc.)NotesT wave often distorted
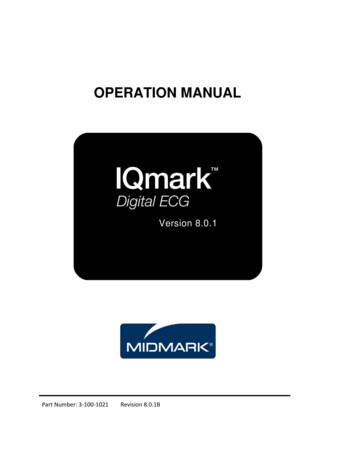
A-fib & Flutter
RhythmRegularRateUnderlying rateP waveNormalPR Interval 0.20 scQRSNormal (0.06-0.10sc.)NotesRhythmRhythmIrregular with progressivelylonger PR interval lengtheningRateUnderlying rateP waveNormalPR IntervalProgressively longer until QRSdropped then cycle repeatsImpulses through AV node aredelayed not blocked. No missedbeatsQRSNormal (0.06-0.10sc.)Regular or Irregular dependingon conduction ratioRhythmRegular atrial and ventricularRateAtrial rate usually normal andventricular rate 40-60 ifjunctional & 20-40 ifventricularP waveNormalPR IntervalNot applicableQRSNormal if junctional (0.060.10sc.) or 0.12 if ventricularNotesComplete block at AV nodeRateAtrial rate usually normal (60100) Ventricular rate slow ( 60)P waveNormal4.75PR IntervalConstant on conducted beats.May be 0.20scQRSNormal (0.06-0.10sc.)Notes
PREMATUREBEATS
SVTAtrialAtrioventricularRegularIrregularSinus tachycardiaAtrial tachycardiaAtrial flutterInappropriate sinustachycardiaSinus node re-entranttachycardiaAtrial fibrillationAtrial flutter with variableblockMultifocal atrialtachycardiaAtrioventricular re-entrytachycardia (AVRT)AV nodal re-entrytachycardia (AVNRT)Automatic junctionaltachycardia
Slow-Fast AVNRT
Paced beats
Electrical current flowing toward a positive electrodeproduces an upward deflection
Electrical current flowing away from a positiveelectrode produces a downward deflection
Electrical current flowing perpendicular to a positiveelectrode produces a biphasic deflection
Vectors Each cell has its own electricalimpulse Vary in strength and direction According to physics can add andsubtract vectors The sum of all of these is theelectrical axis of the ventricle
Ventricular Depolarization
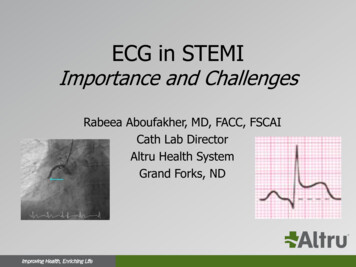
Lead Placement Limb leads 10 cm fromheart Precordial leads placedexact V1&V2 each side ofsternum 4th intercostal V4 5th intercostal midclavicular line
Pictures of the Heart Electrodes are like cameras Pick up the electrical activity of vectors and turns it into waves 3-D image of the heart
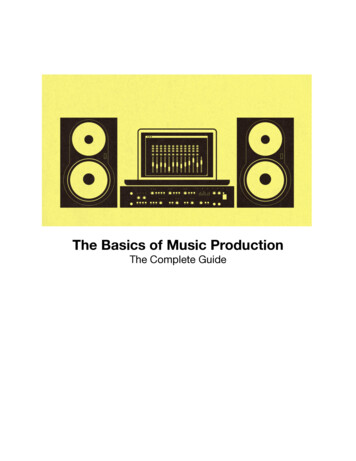
Leads I, II, & III
aVR, aVL, & aVF
Manipulation of Leads Positive and negative poles for leads I, II, & III In physics two vectors (leads) are equal as longas they are parallel and same polarity Move the leads to pass through the center ofthe heart With vector manipulation ECG machinecreates aVR, aVL, & aVF
Hexaxial System Used to determineelectrical axis What is the normal axisfor the heart? -30 to 90
Electrical AxisRight Axis Deviation-RVH-Left posterior hemiblock-Dextrocardia-Ectopic ventricular beats andrhythmsLeft axis deviation-Left Anterior hemiblock-Ectopic ventricular beats andrhythmsExtreme Right
Determine the axis
R Wave Progression V1 overlays rightventricle deep s wave V5 & V6 overlay leftventricle tall positive Rwaves. V5 usually thetallest R wave Transition zonebetween V3 & V4
Temporal relationship
Normal 12 Lead
Normal 12 Lead
Systematic Approach to Interpretation General Impression/Anything that sticks out?Rate, intervals & rhythmAxisIs there hypertrophyIschemia or infarctionAny other unusual findingsPutting it all together for the patient
ReferencesECG Clinical Interpretation: A to Z by diagnosis. Retrieved from: gnosis/Garcia, T. B. (2015). 12 Lead ECG The Art of Interpretation. Jones & Bartlett Learning Burlington, MAMalcolm, T. S. (2012). The Only EKG Book You’ll Ever Need. Lipincott Williams & Wilkins. Philadelphia, PAWalraven, G. (2011) Basic Arrhythmias Seventh Edition. Pearson Education Upper Saddle River, NJ
ECG Basics Rebecca Sevigny BSN, RN, CCRN . DISCLOSURES None of the planners or presenters of this session have disclosed any conflict or commercial interest . Objectives Identify the conduction system of the heart and the components of the cardiac cycle . Discuss a systematic approach to rhythm interpretation . Review common cardiac arrhythmias . Describe the process for interpretation of a 12 .