Transcription
Leveraging Metrics to TakeSouthwest Airlines to a Higher PlaneCase StudyYour Speaker: Jeff Rumburg
The One Year Path to World-ClassPerformanceInitial Benchmarkand ROICalculationImplement ProjectRecommendations from InitialBenchmarkAnnualBenchmark andROI CalculationMonths from Project Kickoff24681012Metrics Trainingand ReportDevelopmentThe Benchmarking MethodologySouthwest’s ServiceDesk PerformanceCOMPAREPerformance ofBenchmarking PeerGroupDetermine HowBest in Class AchieveSuperiorityAdopt SelectedPractices ofBest in ClassBuild a SustainableCompetitiveAdvantageThe ultimateobjective ofbenchmarking
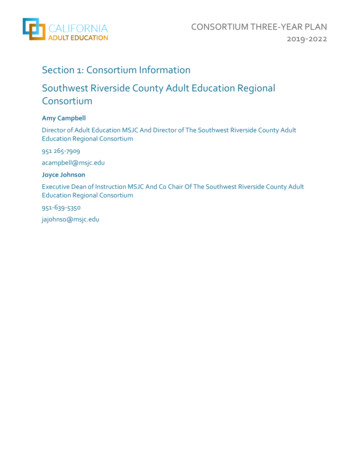
Southwest Service Desk OverviewService Desk LocationsDallas, TXHours of Operation24 X 7Annual Operating Expense* 5,154,828Voice11,101Email278Web Portal1,218Chat3,524Monthly Inbound Contact VolumeOther3,379Total19,500Monthly Outbound Contact Volume4,324FTE Personnel HeadcountTechnology ProfileTechnician Level 147.0Trouble Ticket SystemServiceNow GenevaLead Tech3.0Automatic Call Distributor (ACD)Avaya G3 Version 11Supervisor/Team Lead3.0Knowledge Management SystemServiceNow GenevaManager2.0Remote Control SoftwareRemotely AnywhereQA/QC1.0Call QualityClick 2 CoachTraining1.0Total57.0Initial Benchmark Module 1: Southwest Baselining / Data Collection Module 2: Benchmarking and Gap Analysis Module 3: Balanced Scorecard Module 4: Best Practices Process Assessment Module 5: Strategies for Improved Performance Module 6: Report Development and Presentation of Results
Data CollectionPersonnel Interviews
Benchmarking Peer Group SelectionSummary of Included Benchmarking MetricsCost Cost per Inbound Contact Cost per Minute of Inbound Handle Time Net First Level Resolution RateProductivity Inbound Contacts per Technician per MonthOutbound Contacts per Technician per MonthTechnician UtilizationTechnicians as a % of Total HeadcountService Level Average Speed of Answer (ASA)% of Calls Answered in 30 SecondsCall Abandonment RateTechnicianQuality Call Quality Net First Contact Resolution Rate Customer Satisfaction Annual Technician TurnoverDaily Technician AbsenteeismTechnician OccupancySchedule AdherenceNew Technician Training HoursAnnual Technician Training HoursTechnician Tenure (months)Technician Job SatisfactionContact Handling Inbound Contact Handle Time (minutes)Outbound Contact Handle Time (minutes)Inbound Contacts as a % of Total ContactsUser Self-Service Completion Rate
Process Maturity rategyDefining Your Charterand MissionHumanResourcesProactive, Life-CycleManagement ofPersonnelExpeditious Delivery ofCustomer ogyLeveraging People andProcessesPerformanceMeasurementA Holistic Approach oactively ManagingStakeholderExpectationsTechnologyResults of theFirstBenchmark
Cost per Inbound Contact 30.00 27.50 25.00Cost per Inbound Contact 22.50 20.00 17.50 15.00 12.50 10.00 7.50 5.00 2.50 0.00Service DeskCustomer Satisfaction100.0%95.0%90.0%Customer 0%Service Desk
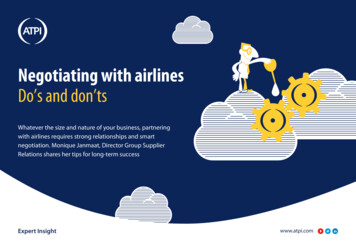
Cost vs. Quality for Southwest Service DeskHigherQualityMiddle QuartilesEffective but not EfficientQuality (Effectiveness)Top QuartileEfficient and EffectiveSouthwestService DeskGlobalDatabaseLowerQualityMiddle QuartilesEfficient but not EffectiveLower QuartileHigher CostLower CostCost (Efficiency)Initial Southwest Airlines Service Desk BalancedScorecardPerformance RangeMetricWeightingPerformance MetricWorst CaseBest CaseYour ActualMetric ScorePerformanceBalancedScoreCost per Inbound Contact25.0% 26.66 10.81 23.2521.5%5.4%Customer an Utilization15.0%37.9%63.8%61.7%91.9%13.8%Net First Contact Resolution Rate15.0%60.3%94.1%76.6%48.2%7.2%Technician Job Satisfaction10.0%62.5%93.9%80.0%55.7%5.6%% of Calls Answered in 30 AN/A61.1%TotalStep 1Step 3Step 5Six critical performancemetrics have been selectedfor the scorecard.For each performance metric,the highest and lowestperformance levels in thebenchmark are recorded.Your score for eachmetric is then calculated:Step 2Each metric has beenweighted according toits relative importance.Step 4Your actual performancefor each metric isrecorded in this column.(worst case - actualperformance) (worst case– best case) 100Step 6Your balanced score foreach metric is calculated:metric score weighting
Balanced Scorecard Summary80.0%75.0%70.0%65.0%60.0%Balanced %10.0%5.0%0.0%Service DeskSix-Part Model for Service Desk sStrategyDefining Your Charterand MissionHumanResourcesProactive, Life-CycleManagement ofPersonnelExpeditious Delivery ofCustomer ogyLeveraging People andProcessesPerformanceMeasurementA Holistic Approach oactively ManagingStakeholderExpectationsTechnology
Best Practices Process AssessmentSummary4.54.31Average 2.52.492.642.01.51.00.50.0SouthwestPeer GroupOverall Process Assessment Score100%Key Statistics90%Total Process Assessment Scores80%70%63.2%60%50%40%30%20%10%0%Total Process Assessment ScoreHigh93.0%Average ־־־־־ 43.0%Median43.6%Low1.7%Southwest63.2%World-Class ־־־־־ 75.0%
100%Southwest Performance90%Process Assessment Score63.2%Balanced Score61.1%80%Balanced Score70%Average 43%Process Maturity vs. Scorecard Performance60%Average 53%World-Class 75%50%40%30%20%Southwest10%Global Database0%0%10%20%30%40%50%60%70%80%90%100%Process Assessment ScoreNotable StrengthsThe Southwest Service Desk has a number of notable strengths. Customer Satisfaction is in the top quartile Productivity metrics are outstanding Customer Satisfaction is the most important measure of qualityAll productivity metrics are in the top quartileMost technician metrics are strong All but two technician metrics are in the top quartile Growth in the chat and portal channels is excellent! Southwest scored very well on the process maturity assessment The Southwest Service Desk scored above average on the balanced scorecard Second quartile performance overall
Opportunities for Improvement Southwest’s costs are above average Cost per Inbound Contact and Cost per Minute of Inbound Handle Time are in the bottom quartile This is most likely due to the high tenure and wage rates of the techniciansSome key service level metrics are weak Average Speed of Answer is in the third quartile, and Call Abandonment Rate is in the bottomquartile This may be the result of high technician utilization levelsInterviewees expressed concern in the following additional areas: The inability to retain new technicians long-term A perceived lack of opportunities for career advancementRecommendations were Made1. Develop a formal career path for service desk personnel2. Take steps to increase contact volume in lower cost channels – e.g., chat, anduser self help3. Adopt the MetricNet Service Desk Balanced Scorecard4. Establish stretch goals in key areas to improve performance5. Improve process maturity in compliance with industry best practices
The ContinuousImprovementPhaseThe One Year Path to World-ClassPerformanceInitial Benchmarkand ROICalculationImplement ProjectRecommendations from InitialBenchmarkAnnualBenchmark andROI CalculationMonths from Project Kickoff2468Metrics Trainingand ReportDevelopment1012
Key Initiatives1. The Balanced Scorecard was Adopted2. A Technician Career Path was Established3. Chat Volume Increased Dramatically4. Technician Scorecards were Implemented5. Processes Matured Significantly6. Metrics Matured SignificantlyProcesses Matured Significantly5.54.825.04.65Average Score4.53.603.543.52.54.154.004.03.04.31 4.262.863.112.833.432.92 3.082.942.362.492.642.01.51.00.50.0Southwest 2016Southwest 2017Peer Group
Overall Process Assessment Scores100%Key StatisticsTotal Process Assessment ScoreHigh93.0%Average ־־־־־ 43.0%Median44.2%Low1.7%Southwest 201663.2%Southwest 201780.1%World-Class ־־־־־ 75.0%90%Total Process Assessment Scores80%80.1%70%63.2%60%50%40%30%20%10%0%Maturing the MetricsTECHPROCESSPEOPLEMETRICS
Metrics: The Linchpin of SuccessDesktop Support Balanced ScoreBalanced Scorecard Performance100%90%80%70%60%50%40%30%n 14320%10%12345Metrics Maturity RankingThe SecondBenchmark:One Year Later
The One Year Path to World-ClassPerformanceInitial Benchmarkand ROICalculationImplement ProjectRecommendations from InitialBenchmarkAnnualBenchmark andROI CalculationMonths from Project Kickoff24681012Metrics Trainingand ReportDevelopmentYear over Year Improvement in Cost 45.00Key StatisticsCost per Inbound Contact 40.00Cost per Inbound ContactHigh 42.56 35.00 Average ־־־־־ 26.44Median 25.52 30.00 Low 18.35SWA 2017 20.27 23.25 25.00 SWA 2016 20.00 15.00 10.00 5.00 0.00Service Desk
Year over Year Improvement in Quality100.0%Key Statistics95.0%Customer SatisfactionHigh97.8%Average ־־־־־ 84.4%Median83.5%Low66.7%SWA 201793.9%SWA 201692.8%Customer vice DeskYear over Year Improvement in FCR95.0%Key Statistics90.0%Net First Contact Resolution RateHigh93.4%Average ־־־־־ 70.8%Median70.5%Low58.5%SWA 201777.6%SWA 201676.6%Net First Contact Resolution 0.0%Service Desk
Cost vs. Quality After One YearHigherQualityTop QuartileEfficient and EffectiveQuality (Effectiveness)Middle QuartilesEffective but not EfficientSouthwestService DeskGlobalDatabaseLowerQualityMiddle QuartilesEfficient but not EffectiveLower QuartileHigher CostLower CostCost (Efficiency)One Year Later: Southwest Service DeskScorecard ScorecardPerformance RangeMetricWeightingPerformance MetricWorst CaseBest CaseSWA 2017ActualMetric ScorePerformanceBalancedScoreCost per Inbound Contact25.0% 42.56 18.35 21.6486.4%21.6%Customer an Utilization15.0%39.5%63.3%53.4%58.2%8.7%Net First Contact Resolution Rate15.0%58.5%93.4%76.8%52.4%7.9%Technician Job Satisfaction10.0%61.0%93.5%80.0%58.5%5.8%Average Speed of Answer .5%TotalStep 1Step 3Step 5Six critical performancemetrics have been selectedfor the scorecard.For each performance metric,the highest and lowestperformance levels in thebenchmark are recorded.Your score for eachmetric is then calculated:Step 2Each metric has beenweighted according toits relative importance.Step 4Your actual performancefor each metric isrecorded in this column.(worst case - actualperformance) (worst case– best case) 100Step 6Your balanced score foreach metric is calculated:metric score weighting
Year over Year Improvements in BalancedScore85.0%Key Statistics80.0%75.0%Service Desk ScoresHigh79.5%Average ־־־־־ 53.1%Median54.5%Low27.4%SWA 201766.5%SWA 201661.1%70.0%65.0%Balanced %15.0%10.0%5.0%0.0%Service DeskProcess Maturity vs. Scorecard Performance100%80%63.2%2016 Balanced Score61.1%2017 Process Assessment Score80.1%2017 Balanced Score66.5%60%Average 52.8%2017201650%World-Class 75.0%Balanced Score70%Average 43.0%90%Southwest Performance2016 Process Assessment Score40%30%20%Southwest10%Global Database0%0%10%20%30%40%50%60%Process Assessment Score70%80%90%100%
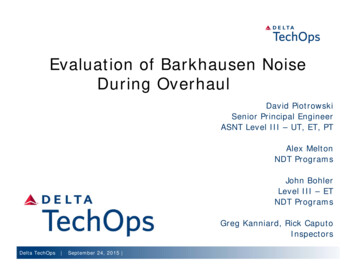
SWA Service Desk is Now World-Class!World-Class Performance CriteriaSWA Service DeskPerformanceQuartile 21.641st2 Top quartile on Customer Satisfaction93.9%1st3 Top quartile on the Balanced Scorecard66.5%1st4 Overall Process Assessment score of 75% or more80.1%5 ROI of more than 100%231%1 Top quartile on Cost per ContactFrom Good to Great in One Year!
Questions?
Performance Quartile. 1 Top quartile on Cost per Contact 21.64 1st 2 Top quartile on Customer Satisfaction 93.9% 1st 3 Top quartile on the Balanced Scorecard 66.5% 1st 4 Overall Process Assessment score of 75% or more 80.1% 5 ROI of more than 100% 231%. SWA Service Desk World-Class Performance Criteria.