Transcription
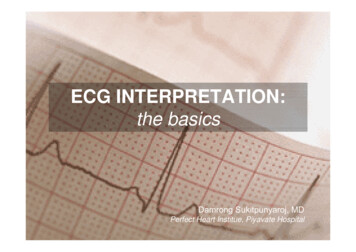
12 Lead ECG Interpretation:Color Coding for MI’sAnna E. Story, RN, MSDirector, Continuing Professional EducationCritical Care NurseOnline Instructional Designer 2004 Anna Story1
Objectives review the ECG waveform and intervalsDefine myocardial ischemia, injury andinfarctionIdentify the 5 major infarct areas on the 12leadName occluded arteries common to the areaDifferentiate ECG changes reflectingischemia, injury and infarctionIdentify cardiac enzymes associated with ACS 2004 Anna Story2
MI Definition A result of occlusion of arterial flow tothe myocardium.Ischemia, injury and necrosis is resultOcclusion occurs via spasm, blood clotor stenosis 2004 Anna Story3
The 12-Lead view Each limb lead I, II, III, AVR, AVL, AVFrecords from a different angleAll six limb leads intersect and visualize afrontal planeThe six chest leads (precordial) V1, V2, V3,V4, V5, V6 view the body in the horizontalplane to the AV nodeThe 12 lead ECG forms a camera view from12 angles 2004 Anna Story4
Views from Augmented andLimb Leads- Frontal 2004 Anna Story5
Precordial lead snapshots 2004 Anna StoryThink of eachprecordial lead as ahorizontal view ofthe heart at the AVnodeWith the limb leadsand the precordialleads you have asnapshot of heartportions6
Unipolar and Bipolar Limb leads I, II, III are bipolar and have anegative and positive pole AVR, AVL and AVF are unipolar Electrical potential differences are measuredbetween the polesNo negative leadThe heart is the negative poleElectrical potential difference is measuredbetweeen the lead and the heartChest leads are unipolar The heart also is the negative pole 2004 Anna Story7
Lead Placement is Important Each positive electrodeacts as a cameralooking at the heartTen leads attached fortwelve lead diagnostics.The monitor combines 2leads.Mnemonic for limb leads White on rightSmoke(black) overfire(red)Snow(white) ongrass(green) 2004 Anna Story8
Precordial Leads 2004 Anna Story9
I and AVLV3 & v4V1 & v2V5 & v6II, III and AVFWhere the positive electrode ispositioned, determines what 2004 Anna Story part of the heart is seen!10
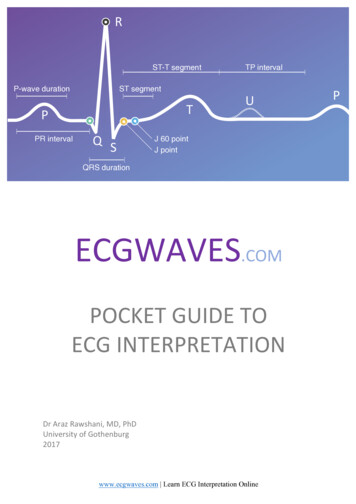
The ECG Tracing: Waves P- wave Marks the beginning of the cardiac cycle andmeasures the electrical impulse that causes atrialdepolarization and mechanical contractionQRS- Complex Measures the impulse that causes ventriculardepolarization Q-wave- may or may not be evident on the ECGR-wave- first upward deflection following P waveS-wave- the first downward deflection following the RwaveT- wave Marks ventricular repolarization that ends the 2004 Anna Storycardiac cycle11
Intervals and Segments P-R interval QRS Interval Time interval for impulse to go from AV node to stimulatePurkinjie fibersLess than 0.12 secsQT Interval Time interval for impulse to go from the SA to the AV nodenormal 0.12-0.20 secsTime interval from beginning of depolarization to the end ofrepolarizationShould not exceed ½ the length of the R-RST segment end of the S to the beginning of the T 2004 Anna Story12
The ECG Tracing 2004 Anna Story13
ECG Changes : Ischemia T-wave inversion ( flipped T)ST segment depressionT wave flatteningBiphasic T-wavesBaseline 2004 Anna Story14
ECG Changes: Injury ST segment elevation of greater than 1mm in at least2 contiguous leadsHeightened or peaked T wavesDirectly related to portions of myocardium renderedelectrically inactiveBaseline 2004 Anna Story15
ECG Changes: Infarct Significant Q-wave where none previously existed Why? Impulse traveling away from the positive lead Necrotic tissue is electrically deadNo Q-wave in Subendocardial infarcts Why? Not full thickness dead tissue But will see a ST depression Often a precursor to full thickness MICriteria Depth of Q wave should be 25% the height of the R wave Width of Q wave is 0.04 secs Diminished height of the R wave 2004 Anna Story16
Evolving MI and Hallmarks ofAMIQ waveST Elevation1 year 2004 Anna StoryT waveinversion17
Dissecting the 12 Lead ECG Horizontal marks timeVertical marks amplitude6 limb leads6 precordial leadsPositioning measures 12 perspectives orviews of the heartThe 12 perspectives are arranged in verticalcolumnsLimb leads are I, II, III, AVR, AVL, AVFPrecordial leads are V1, V2, V3, V4, V5, V6 2004 Anna Story18
A Normal 12 Lead ECG 2004 Anna Story19
A Normal 12 Lead ECG 2004 Anna Story20
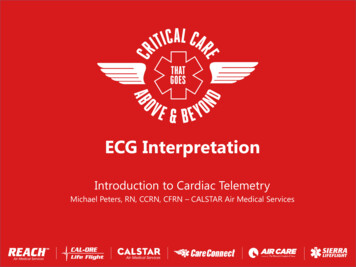
Color Coding ECG’s Anterior Yellow indicates V1, V2,V3, V4 Anterior infarct with ST elevationLeft Anterior Descending Artery(LAD)V1 and V2 may also indicateseptal involvement whichextends from front to the back ofthe heart along the septumLeft bundle branch blockRight bundle branch block2nd Degree Type2Complete Heart Block 2004 Anna Story21
Anterior MI 2004 Anna Story22
Color Coding ECG- Inferior Blue indicates leads II,III, AVF Inferior Infarct withST elevationsRight Coronary Artery(RCA)1st degree Heart Block2nd degree Type 1, 23rd degree BlockN/V common, Brady 2004 Anna Story23
Inferior MI 2004 Anna Story24
As an aside . Right sided EKGEver heard of it?Ever done one?Think about it . For your cases that are clearly inferior MI’sObtain a dextrocardiogram whenever STsegment elevation is noted in Inferior leads 2004 Anna Story25
Right Sided EKG? RVI occurs around 40% ininferior MI’sSignificance The single most accuratetool used in measuring RVI.90% sensitive and specific 2004 Anna StoryLarger area of infarctBoth ventriclesDifferent treatmentRight leads “look” directly atRight Ventricle and can showST elevations in leads II. III.AVF, V4R , V5R and V6ROcclusion in RCA andproximal enough to involvethe RV26
Clinical Triad of RVI 2004 Anna StoryHypotensionJugular veindistentionDry lung sounds27
Color Coding ECG- Lateral Red indicates leadsI, AVL, V5, V6 Lateral Infarctwith ST elevationsLeft CircumflexArteryRarely by itselfUsually in combo 2004 Anna Story28
Lateral MI 2004 Anna Story29
Color Coding ECG- Posterior Green indicates leads V1,V2Posterior Infarct with STDepressions and/ tall R wave RCA and/or LCX ArteryUnderstand Reciprocal changes The posterior aspect of theheart is viewed as a mirrorimage and thereforedepressions versus elevationsindicate MI Rarely by itself usually incombo 2004 Anna Story30
Posterior MI 2004 Anna Story31
Color Coding ECG- SubEndo No color forSubEndocardial infarctssince they are nottransmuralLook for diffuse orlocalized changes andnon – Q waveabnormalities T-wave inversionsST segmentdepression 2004 Anna Story32
SubEndo MI 2004 Anna Story33
More than one color showsabnormality A combination of infarcts such as: Anterolateral yellow and redInferoposterior blue and greenAnteroseptal yellow and green 2004 Anna Story34
Putting it ALL together 2004 Anna Story35
2004 Anna Story36
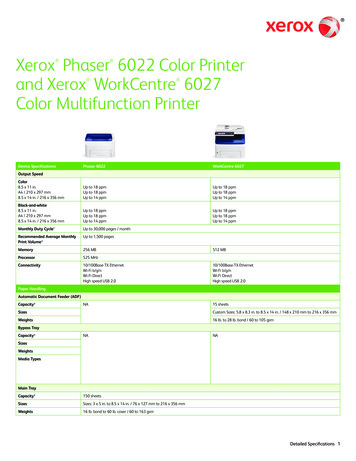
Practice 1Anterior MI with lateralinvolvement ST elevations V2, V3, V4 ST elevations II, AVL, V5 2004 Anna Story37
Practice 2 Anteroseptal MI ST elevations V1, V2, V3, V4 2004 Anna Story38
Practice 3Inferior MI ST elevation 2,3 AVF 2004 Anna Story39
Practice 4 Inferior lateral MI ST elevations 2, 3, AVF ST elevations V5 2004 Anna Story40
Practice 5 Acute inferior MI Lateral ischemia 2004 Anna Story41
Cardiac Enzymes IndicatingInfarct Troponins- Now theGold Standard! Rises after 3-6 hoursNegative Troponinwithin 6 hours ofonset of S&S rulesout the MIPeaks at about 20hoursMay be raised for 14days 2004 Anna Story42
Cardiac Enzymes IndicatingInfarct Troponin T 84% sensitivity for MI 8 hours after onset ofsymptoms22% for unstable angina Advantages Highly sensitive for detecting myocardial ischemiaLevels may help to stratify risksDisadvantages Less specific than Troponin IIncreased in anginaIncreased in chronic renal failure 2004 Anna Story43
Cardiac Enzymes IndicatingInfarct Troponin I 90% sensitivity for MI 8 hours after onset of S&Sand 95% specificityLevel greater than 1.2 suggest MINegative rules out MIObtain two negative troponin values 4 hours apartNormally exceedingly lowEven a small elevation indicatesmyocardial damage 2004 Anna Story44
References Twelve Lead Electrocardiography for ACLS Providers, D. Bruce Foster,D.O.W.B. Saunders CompanyRapid Interpretation of EKG’s , Dale Dubin, M.D., Cover Publishing Co.1998ECG’s Made Easy, Barbara Aehlert, RN, Mosby, 1995The 12 Lead ECG in Acute Myocardial Infarction, Tim Phalen, Mosby,1996Color Coding EKG’s , Tim Carrick, RN, H &H Publishing, me.htmlwww.nyerrn.com/h/ekg.htm Drawings by Jill Gregory, Medical Illustrator, CGEY 2004 Anna Story45
12 Lead ECG Interpretation: Color Coding for MI’s Anna E. Story, RN, MS Director, Continuing Professional Education Critical Care Nurse Online Instructional Designer 2004 Anna Story 2 Objectives review the ECG waveform and intervals Define myocardial ischemia, injury and infarction Identify the 5 major infarct areas on the 12 lead Name occluded arteries common to the area Differentiate ECG .