Transcription
ECG INTERPRETATION:the basicsDamrong Sukitpunyaroj,Sukitpunyaroj MDPerfect Heart Institue, Piyavate Hospital
Overview Conduction Pathways Systematic Interpretation Common abnormalities in Critical Care– Supraventricular arrhythmias– VentricularVentric lar arrharrhythmiasthmias
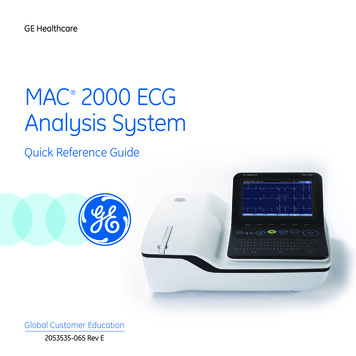
Conduction Pathways
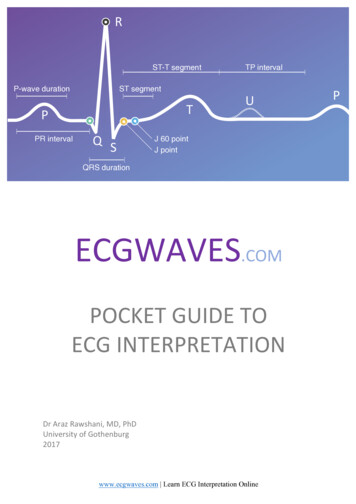
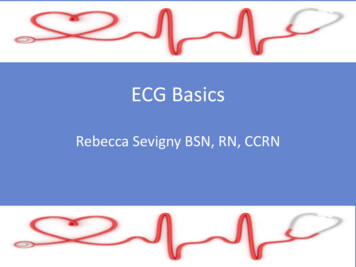
Conduction PathwaysP wave atrial depolarisation.PR Interval impulse from atriato ventricles.ventriclesQRS complex ventriculardepolarisation.ST segment isoelectric - partof repolarisation.T wave usually same directionas QRS - ventricularrepolarisation.QT Interval This intervalspans the onset ofdepolarisation to thecompletion of repolarizationof the ventricles.ventricles
Interpretation
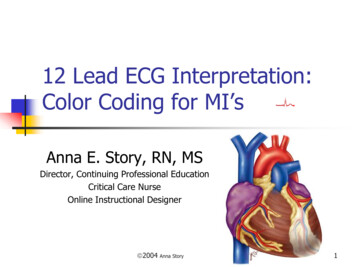
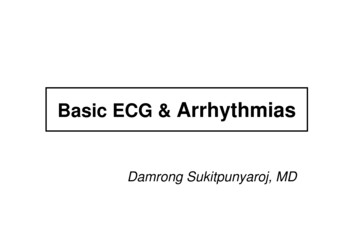
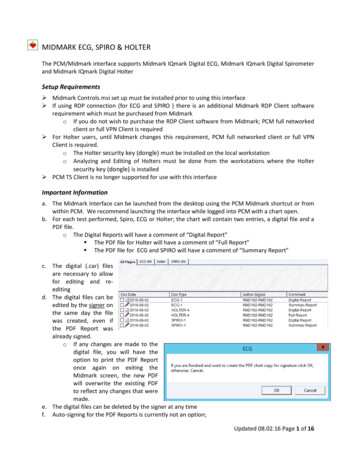
Interpretation1.Rate Number of P’s (atrial) R’s (ventricular) perminute (6 second [30 squares] X 10 minute rate).P rate: 8 x 10 802.R rate: 8 x 10 80Rhythm Regular or irregular. Map P-P and R-Rintervals.intervals
Interpretation3 P wave present,3.t 1 per QRS,QRS shape,hdduration,tivoltage.lt4. P-R interval length (0.12 - 0.2 sec 1 big square), isoelectric.
Interpretation5. QRS duration (0.06 - 0.10 ), voltage, q or Q waves6. ST Segment shape, isoelectric with PR segment
Interpretation7. T wave shape, direction8. QT interval length (R-R/2 or QTc 0.40 sec)
Abnormalities:Supraventricular arrhythmias Atrial Fibrillation Atrial Flutter Supraventricular Tachycardia (SVT)Abnormalities:V t i l arrhythmiasVentricularh th i Premature Ventricular Complexes (PVCs) Ventricular tachycardia (VT)
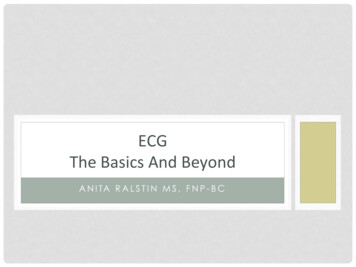
Conduction PathwaysSupraventricularNarrow QRS complexVentricularVti lWide QRS complex
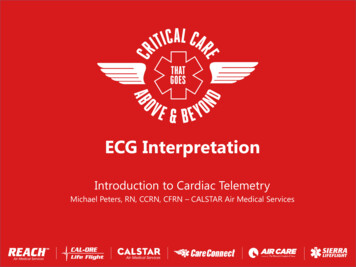
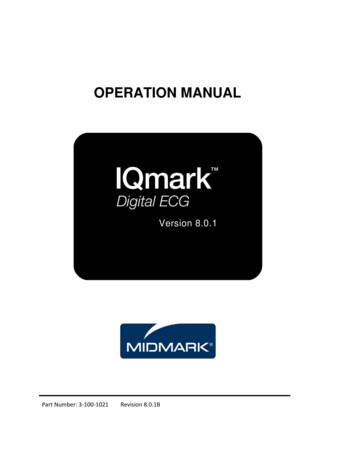
Abnormalities:atrial fibrillationRhythm: IrregularRate: A: 350 – 650; V: variesP: poorly definedP-R: N/AQRS: narrow complexS-T: normalT: normalQ-T: normal
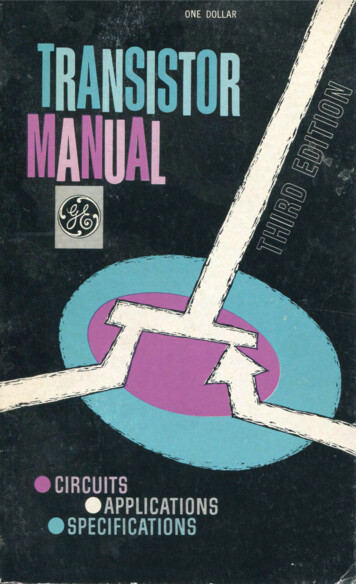
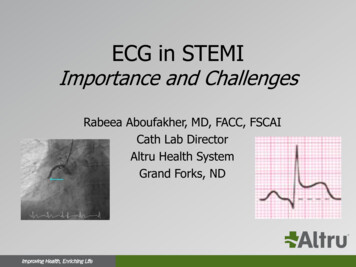
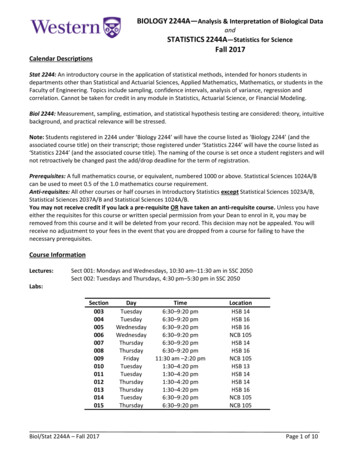
Abnormalities:atrial flutterRhythm: Regular / IrregularRate: A: 220 – 430; V: 300 (2:1, 3:1 or sometimes 4:1)P: Saw toothed appearanceP-R: N/AQRS: narrow complexS-T: normalT: normalQ-T: normal
Abnormalities:supraventricular tachycardia (SVT)Rhythm: RegularRate: 100P: not visibleP-R: not definedQRS: narrow complexS-T: depression (sometimes)T: normalQ-T: prolonged (sometimes)
Abnormalities:premature ventricular complexes
Examples
Examples
ECG INTERPRETATION:12 Lead
Overview Lead Placement Axis Common abnormalities in Critical Care– Heart block– BundleB ndle branch blocks– Life threatening arrhythmias
Lead PlacementV1 4th ICS righti ht sternumtV2 4th ICS left sternumV3 midway between V2and V4V4 5th ICS midclavicularV5 between V4 and V6anterior auxiliary lineV6 midauxillary linelateral to V4 and V5
Lead Placement Electrical activity towards Electrical activity away
Lead Placement
Axis The direction of an ECGwaveform in the frontalplane measured indegrees Representspthe flow ofthe majority of electricalactivity NormallyNll theh QRScomplex is measured
Axis Each lead has its own axis
Lead PlacementStandard Leads (bipolar) I - lateral wall II - inferior wall III - inferior wallAugmented leads (unipolar) aVR - no mans land aVL - lateral wall aVF - inferior wallChestt LChLeadsd (unipolar) V1 - septal wall V2 - septal wall V3 - anterior wall V4 - anterior wall V5 - lateral wall V6 - lateral wall
Lead PlacementNo-mans land, inferior, lateral, anterior, septal,
Abnormalities:bundle branch blocks QRS widened, greater than 0.12 secs Change in axis Difficult to interpret ECG Right or Left Normal P wave Followed by a T wave
Abnormalities:right bundle branch blocks Indicates conductionproblems in the right side ofthe heart May be normal in healthypeople R wave in V1, ie two R wavesin V1 Q wave in V6 Lead V1 cats ears
Abnormalities:left bundle branch blocks Always indicates heartdisease, usually of the leftside of the heart Hard to interpret an ECG withLBBB Lead V1 Q wave and an Swave Lead V6 an R wave followedbyy another R wave Lead V6 Rabbit ears
Abnormalities:heart block SA block (exit block) 1st degree AV block 2nd degree AV block– Wenckeback (type I)– MobitzMobit (type(t pe II) 3rd degree AV block
Abnormalities:heart block – SA block
Abnormalities:heart block – 1st degree AV
Abnormalities:heart block – 2nd degree AVW k b kWenkebackMobitz
Abnormalities:heart block – 3rd degree AV
Abnormalities:life threatening arrhythmias Ventricular Tachycardia Ventricular Fibrillation Asystole
Abnormalities:life threatening arrhythmias - VT
Abnormalities:life threatening arrhythmias - VF
Abnormalities:life threatening arrhythmias – Asystole
Examples
Examples
Interpretation 1. Rate Number of P’s (atrial) R’s (ventricular) per minute (6 second [30 squares] X 10 minute rate). P rate: 8 x 10 80 R rate: 8 x 10 80 2. Rhythm