Transcription
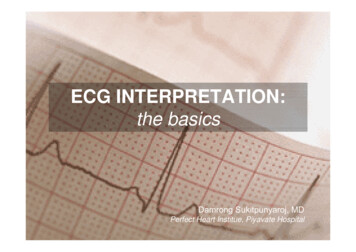
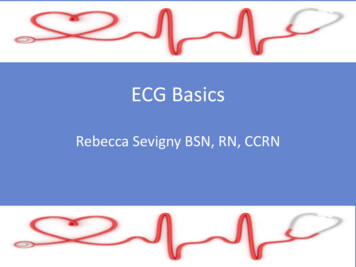
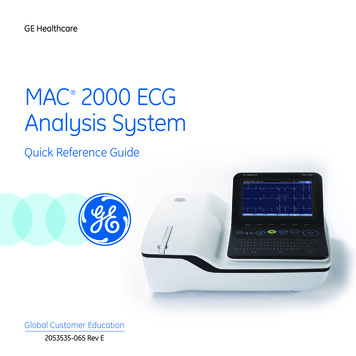
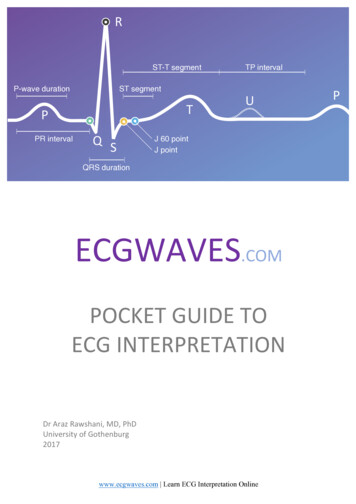
RST-T segmentP-wave durationTP intervalST segmentTPPR intervalQ SUJ 60 pointJ pointQRS durationECGWAVES.COMPOCKET GUIDE TOECG INTERPRETATIONDr Araz Rawshani, MD, PhDUniversity of Gothenburg2017www.ecgwaves.com Learn ECG Interpretation OnlineP
Methodological ECG InterpretationThe ECG must always be interpreted systematically. Failure to perform a systematic interpretation ofthe ECG may be detrimental. The interpretation algorithm presented below is easy to follow and itcan be carried out by anyone. The reader will gradually notice that ECG interpretation is markedlyfacilitated by using an algorithm, as it minimizes the risk of missing important abnormalities and alsospeeds up the interpretation.1. RhythmASSESSMENTSEVALUATIONAssess ventricular (RR intervals)and atrial (PP intervals) rate andrhythm. Is ventricular rhythm regular?What is the ventricular rate(beats/min)? Is atrial rhythm regular? Whatis the atrial rate (beats/min)? P-waves should precede everyQRS complex and the P-waveshould be positive in lead II. Sinus rhythm (which is the normal rhythm) has thefollowing characteristics: (1) heart rate 50–100 beats perminute; (2) P-wave precedes every QRS complex; (3) the Pwave is positive in lead II and (4) the PR interval is constant. Causes of bradycardia: sinus bradycardia, sinoatrial block,sinoatrial arrest/inhibition, second-degree AV block, thirddegree AV block. Note that escape rhythms may arise duringbradycardia. Also note that bradycardia due to dysfunction inthe sinoatrial node is referred to as sinus node dysfunction(SND). If a person with ECG signs of SND is symptomatic, thecondition is classified as sick sinus syndrome (SSS). Causes of tachycardia (tachyarrhythmia) with narrow QRScomplexes (QRS duration 0,12 s): sinus tachycardia,inappropriate sinus tachycardia, sinoatrial re-entrytachycardia, atrial fibrillation, atrial flutter, atrial tachycardia,multifocal atrial tachycardia, AVNRT, AVRT (pre-excitation,WPW). Note that narrow complex tachyarrhythmia rarelycauses circulatory compromise or collapse. Causes of tachycardia (tachyarrhythmia) with wide QRScomplexes (QRS duration 0,12 s): ventricular tachycardia isthe most common cause and it is potentially life-threatening.Note that 10% of wide complex tachycardias actually originatefrom the atria but the QRS complexes become wide due toabnormal ventricular depolarization (e.g sinus tachycardiawith simultaneous left bundle branch block).2. P-wave and PR intervalASSESSMENTSEVALUATION P-wave always positive in leadII (actually always positive in leadsII, III and aVF). P-wave duration should be 0,12 s (all leads). P-wave must be positive in lead II, otherwise the rhythmcannot be sinus rhythm. P-wave may be biphasic (diphasic) in V1 (the negativedeflection should be 1 mm). It may have a prominentsecond hump in the inferior limb leads (particularly lead II).www.ecgwaves.com Learn ECG Interpretation Online
P-wave amplitude should be 2,5 mm (all leads). PR intervalmust be 0,12–0,22 s (all leads). P mitrale: increased P-wave duration, enhanced secondhump in lead II and enhanced negative deflection in V1. P pulmonale: increased P-wave amplitudes in lead II andV1. If P-wave not clearly visible: look for retrograde (inverted)P-waves, which can be located anywhere between the J pointand the terminal part of the T-wave. PR interval 0,22 s: first-degree AV block. PR interval 0,12 s: Pre-excitation (WPW syndrome). Second-degree AV-block Mobitz type I (Wenckebachblock): repeated cycles of gradually increasing PR intervaluntil an atrial impulse (P-wave) is blocked in theatrioventricular node and the QRS complex does not appear. Second-degree AV-block Mobitz type II: intermittentlyblocked atrial impulses (no QRS seen after P) but withconstant PR interval. Third-degree AV-block: All atrial impulses (P-waves) areblocked by the atrioventricular node. An escape rhythmarises (cardiac arrest ensues otherwise), which may havenarrow or wide QRS complexes, depending on its origin.There is no relation between P-waves and the escaperhythm's QRS complexes, and atrial rhythm is typically fasterthan the escape rhythm (both rhythms are typically regular).3. QRS complexASSESSMENTSEVALUATION QRS duration must be 0,12 s(normally 0,07-0,10 s). There must be at least onelimb lead with R-wave amplitude 5 mm and at least one chest(precordial) lead with R-waveamplitude 10 mm; otherwisethere is low voltage. High voltage exists if theamplitudes are too high, i.e if thefollowing condition is satisfied: SwaveV1 or V2 R-waveV5 35mm. Look for pathological Q-waves.Pathological Q-waves are 0,03 sand/or amplitude 25% of R-waveamplitude in same lead, in at least2 anatomically contiguous leads. Is the R-wave progression inthe chest leads (V1–V6) normal? Wide QRS complex (QRS duration 0.12 s): Left bundlebranch block. Right bundle branch block. Nonspecificintraventricular conduction disturbance. Hyperkalemia. ClassI antiarrhythmic drugs. Tricyclic antidepressants. Ventricularrhythms and ventricular extrasystoles (prematurecomplexes). Artificial pacemaker which stimulates in theventricle. Aberrant conduction (abberancy). Pre-excitation(Wolff-Parkinson-White syndrome). Short QRS duration: no clinical relevance. High voltage: Hypertrophy (any lead). Left bundle branchblock (leads V5, V6, I, aVL). Right bundle branch block (V1–V3). Normal variant in younger, well-trained and slenderindividuals. Low voltage: Normal variant. Misplaced leads.Cardiomyopathy. Chronic obstructive pulmonary disease.Perimyocarditis. Hypothyreosis (typically accompanied bybradycardia). Pneumothorax. Extensive myocardial infarction.Obesity. Pericardial effusion. Pleural effusion. Amyloidosis. Pathological Q-waves: Myocardial infarction. Left-sidedpneumothorax. Dextrocadia. Perimyocarditis.Cardiomyopathy. Amyloidosis. Bundle branch blocks. Anteriorwww.ecgwaves.com Learn ECG Interpretation Online
Is the electrical axis normal?Electrical axis is assessed in limbleads and should be between –30 to 90 .fascicular block. Pre-excitation. Ventricular hypertrophy.Acute cor pulmonale. Myxoma. Fragmented QRS complexes indicates myocardial scarring(mostly due to infarction). Abnormal R-wave progression: Myocardial infarction.Right ventricular hypertrophy (reversed R-wave progression).Left ventricular hypertrophy (amplified R-wave progression).Cardiomyopathy. Chronic cor pulmonale. Left bundle branchblock. Pre-excitation. Dominant R-wave in V1/V2: Misplaced chest electrodes.Normal variant. Situs inversus. Posterolateralinfarction/ischemia (if patient experiences chest discomfort).Right ventricular hypertrophy. Hypertrophic cardiomyopathy.Right bundle branch block. Pre-excitation. Right axis deviation: Normal in newborns. Right ventricularhypertrophy. Acute cor pulmonale (pulmonary embolism).Chronic cor pulmonale (COPD, pulmonary hypertension,pulmonary valve stenosis). Lateral ventricular infarction. Preexcitation. Switched arm electrodes (negative P and QRS-T inlead I). Situs inversus. Left posterior fascicular block isdiagnosed when the axis is between 90 and 180 with rScomplex in I and aVL as well as qR complex in III and aVF(with QRS duration 0.12 seconds), provided that othercauses of right axis deviation have been excluded. Left axis deviation: Left bundle branch block. Leftventricular hypertrophy. Inferior infarction. Pre-excitation.Left anterior fascicular block is diagnosed if the axis isbetween -45 and 90 with qR-complex in aVL and QRSduration is 0,12 s, provided that other causes of left axisdeviation have been excluded. Extreme axis deviation: Rarely seen. Probably misplacedelectrodes. If the rhythm is wide QRS complex tachycardia,then the cause is probably ventricular tachycardia.4. ST segment ASSESSMENTS The ST-segment should be flatEVALUATION Benign ST segment elevation is very common in theand isoelectric (in level with thebaseline). It may be slightlyupsloping at the transition withthe T-wave. ST segment deviation(elevation and depression) is measured in the J point.population, particularly in the precordial leads (V2–V6). Up to90% (in some age-ranges) of healthy men and women displayconcave ST-segment elevations in V2–V6 (this is calledmale/female pattern). ST-segment elevations which are notbenign nor due to ischemia are rather common (listedbelow). ST-segment depression is uncommon among healthyindividuals. ST-segment depression is particularly suspiciousin the chest leads. Guidelines recommend that 0.5 mm STsegment depression be accepted in all leads.www.ecgwaves.com Learn ECG Interpretation Online
Causes of ST-segment elevation: Ischemia. ST segmentelevation myocardial infarction (STEMI/STE-AKS). Prinzmetal'sangina (coronary vasospasm). Male/female pattern. Earlyrepolarization. Perimyocarditis. Left bundle branch block.Nonspecific intraventricular conduction disturbance. Leftventricular hypertrophy. Brugada syndrome. Takotsubocardiomyopathy. Hyperkalemia. Post cardioversion.Pulmonary embolism. Pre-excitation. Aortic dissectionengaging the coronary arteries. Left ventricular aneurysm. Causes of ST-segment depression: Ischemia. Non-STsegment elevation myocadial infarction (NSTEMI/NSTE-AKS).Physiological ST-segment depression. Hyperventilation.Hypokalemia. High sympathethic tone. Digoxin. Left bundlebranch block. Right bundle branch block. Pre-excitation. Leftventricular hypertrophy. Right ventricular hypertrophy. Heartfailure. Tachycardia. Causes of waves/deflections in the J point (J wavesyndromes): Brugada syndrome. Early repolarization.5. T-wave ASSESSMENTS Should be concordant with theEVALUATION Normal variants: An isolated (single) T-wave inversion isQRS complex. Should be positivein most leads. T-wave progression should benormal in chest leads. In limb leads the amplitude ishighest in lead II, and in the chest leads the amplitude is highest inV2–V3.accepted in lead V1 and lead III. In some instances the T-waveinversions from childhood may persist in V1–V3(V4), which iscalled persistent juvenile T-wave pattern. Rarely, all T-wavesremain inverted, which is called global idiopathic T-waveinversion (V1–V6). T-wave inversion without simultaneous ST-segmentdeviation: This is not a sign of ongoing ischemia, but may bepost-ischemic. One type of post-ischemic T-wave inversion isespecially acute, namely Wellen's syndrome (characterized bydeep T-wave inversions in V1–V6 in patient with recentepisodes of chest pain). Cerebrovascular insult (bleeding).Pulmonary embolism. Perimyocarditis (after normalization ofthe ST-segment elevation, T-waves become inverted inperimyocarditis). Cardiomyopathy. T-wave inversion with simultaneous ST-segmentdeviation: acute (ongoing) myocardial ischaemia. High T-waves: Normal variant. Early repolarization.Hyperkalemia. Left ventricular hypertrophy. Left bundlebranch block. Occasionally perimyocarditis. High (hyperacute)T-waves may be seen in the very early phase of STEMI. www.ecgwaves.com Learn ECG Interpretation Online
6. QTc interval and U-waveASSESSMENTSEVALUATION QTc duration men 0,45 s. QTc duration women 0,46 s. Prolonged QTc duration maycause malignant arrhythmias(torsade de pointes, which is atype of ventricular tachycardia). Shortened QTc duration ( 0.32s) is rare, but may also causemalignant ventricular arrhythmias. The U-wave is seenoccasionally, especially in well- trained individuals, and duringlow heart rate. It is largest in V3–V4. Amplitude is one fourth of T- wave amplitude. Acquired QT prolongation: anti arrhythmic drugs(procainamide, disopyramide, amiodarone, sotalol),psychiatric medications (tricyclic antidepressants, SSRI,lithium etc); antibiotics (macrolides, kinolones, atovaquone,klorokine, amantadin, foscarnet, atazanavir); hypokalemia,hypocalcemia, hypomagnesemia; cerebrovascular insult(bleeding); myocardial ischemia; cardiomyopathy;bradycardia; hypothyroidism; hypothermia. A complete list ofdrugs causing QT prolongation can be found here. Congenital QT prolongation: genetic disease of whichthere are approximately 15 variants. Short QTc syndrome ( 0,32 s): caused by hyperkalcemiaand digoxin treatment. May cause malignant ventriculararrhythmia. Negative U-wave: high specificity for heart disease(including ischemia). 7. Compare with earlier ECG tracingsIt is fundamental to compare the current ECG with previous recordings. All changes are of interestand may indicate pathology.8. Clinical contextECG changes should be put into a clinical context. For example, ST-segment elevations are commonin the population and should not raise suspicion of myocardial ischemia if the patient do not havesymptoms suggestive of ischemia.The guide continues on the next page.www.ecgwaves.com Learn ECG Interpretation Online
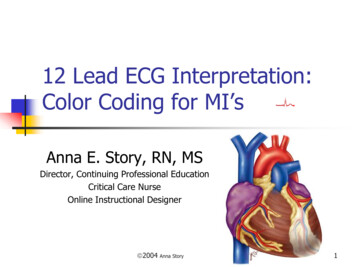
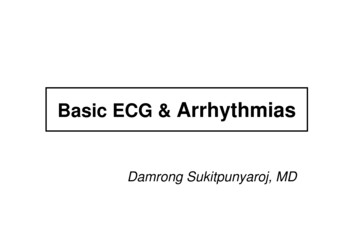
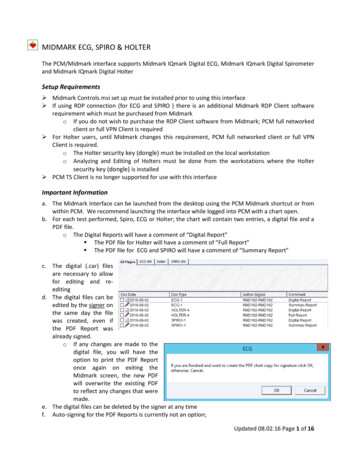
The cardiac conduction systemWaves, intervals and durations on the ECGwww.ecgwaves.com Learn ECG Interpretation Online
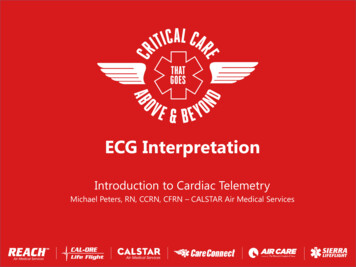
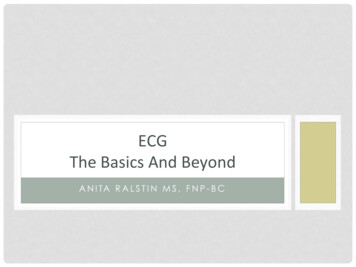
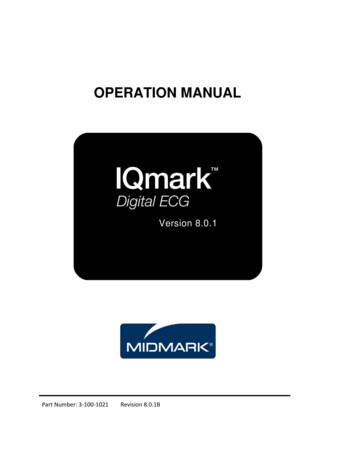
The walls of the left ventricle and the leads that viewthese wallsThe ECG leadswww.ecgwaves.com Learn ECG Interpretation Online
P-wave changeswww.ecgwaves.com Learn ECG Interpretation Online
ST segment depressionswww.ecgwaves.com Learn ECG Interpretation Online
ST segment elevationswww.ecgwaves.com Learn ECG Interpretation Online
T-wave changeswww.ecgwaves.com Learn ECG Interpretation Online
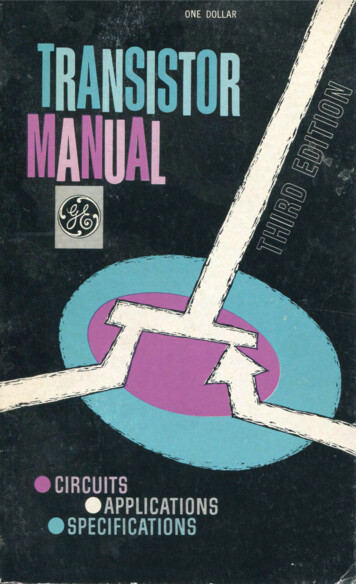
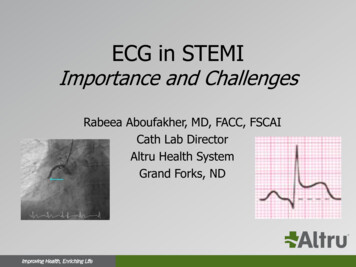
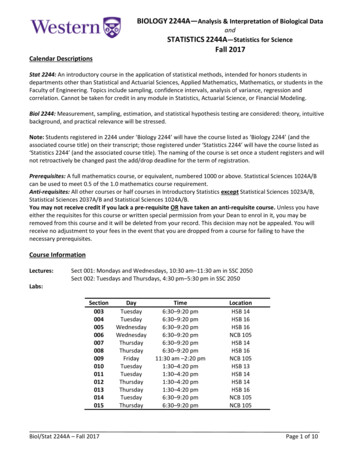
Electrical axis of the heartAs evident from the figure above, the normal heart axis is between –30 and 90 . If the axis is morepositive than 90 it is referred to as right axis deviation. If the axis is more negative than –30 it isreferred to as left axis deviation. The axis is calculated (to the nearest degree) by the ECG machine.The axis can also be approximated manually by judging the net direction of the QRS complex in leadsI and II. The following rules apply: Normal axis: Net positive QRS complex in leads I and II. Right axis deviation: Net negative QRS complex in lead I but positive in lead II. Left axis deviation: Net p
www.ecgwaves.com Learn ECG Interpretation Online Methodological ECG Interpretation The ECG must always be interpreted systematically. Failure to perform a systematic interpretation of the ECG may be detrimental. The interpretation algorithm presented below is easy to follow and it can be carried out by anyone. The reader will gradually notice that ECG interpretation is markedlyFile Size: 1MBPage Count: 21