Transcription
Carnegie Mellon UniversitySwartz Center for EntrepreneurshipCONNECTS SeriesFinancial ModelingPhil Compton, CFOSingleSource Property Solutionspacmanwvu@gmail.comBuilding Financial Models
My Background BS in Accounting – West Virginia University CPA, Entrepreneur, Investor, Advisor 30 years of largely entrepreneurial experience– Public Acctg – PricewaterhouseCoopers (Coopers &Lybrand)– Industry – Black Box (BBOX on Nasdaq), MallettTechnology, WiseWire (CMU startup), CoManage,Netronome, Malcovery– Worked on LBO / IPO / Bankruptcy (Black Box), Exits(WiseWire to Lycos, Malcovery to PhishMe), VC fundings of 100M, commercial bank financing, sales contractnegotiations, investor relations, Board level involvement,etc.– 2014 Pgh Business Times CFO of the Year (SmallCompanies)Building Financial Models
Financial Modeling – Main Points1) Building Your Model Planning considerations and assumptions2) Testing Your Model Stress test to make sure it works as planned3) Funding and Cap Table Review Simplifying the mathBuilding Financial Models
Building Financial Models - Setting a Planning Horizon Typical timeframe is 2 to 3 years Forecast monthly detail for first 2 years (obviously gets moredifficult to estimate as you go out in time) What are you planning toward– Initial funding round or eventual liquidity event?– Building company to sell? – Shorter term focus, but becareful– Building company to become public (IPO)? – Not near asrealistic or even desirable these days– Building for the long term and see what happens? Be realistic in your numbers and the time it takes to achievethemYou will be viewed as credible / less risky if you are practical anddemonstrate good judgment in your projections I just happened to build you a template / detailed model !(posted online)Building Financial Models
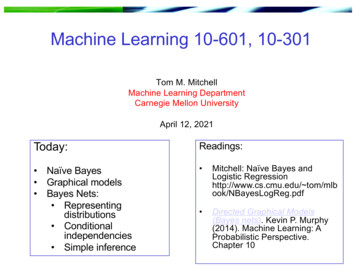
Defining Relevant Assumptions Document the assumptions you make in building yourmodel – Don’t rely on memory (see Notes tab inmodel) Tells the audience a more complete story and that youunderstand your own projections What type of company are you striving to create? Product or service company? Build it or Buy it? (i.e. Manufacturer or Reseller) Revenues via Direct Sales team or Partners? What type / how many employees do you need to buildyour company and product or service? EVERYTHING affects your cash needsBuilding Financial Models
Defining Relevant Assumptions – Notes ExampleBuilding Financial Models
Defining Relevant Assumptions (cont’d) What tools do these employees need to do their job? Where are you going to put them? How long tostay? What physical environment are you going to create? What data / telecomm infrastructure will you need? What kind of Marketing efforts will you need to gainmindshare in your industry / segment? How much will the Sales team travel? Do they needto?That sounds really ALL these assumptions are“big ticket” costs that affect yourinitial and ongoing cash needsinteres0ng, but “No!”Building Financial Models
Speaking of CashCash is not only King Cash is KING KONG !!!Building Financial Models
Developing a Basic Financial Model Keep it understandable & easy to update –because you will certainly need to update manytimes! Based on your assumptions - Build model so thatyou know what happens if you make changes(sensitivity):– Add a body– Offer more benefits– Purchase more computers / equipment / software– Need to expand inventory– Open a new office / location– In other words - Add any type of costBuilding Financial Models
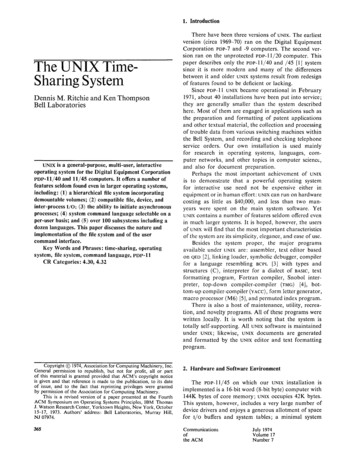
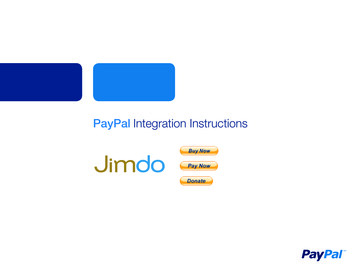
Defining Assumptions – Hiring Costs 5,0004,583-(select)123456789101112131415Big CheeseChief Idea GuyBuild It GuruTitle 4Title 5Title 6Title 7Title 8Title 9Title 10Title 11Title 12Title 13Title 14Title 15G&AG&ADevelopmentDevelopmentSalesSalesBiz DevG&ASalesProduct 151/1/163/1/165/1/166/1/167/1/168/1/168/1/16 ,00055,00060,00055,00065,00065,00070,000Building Financial Models
Defining Assumptions – Hiring Ramp ExampleIncludes part-time & contractors or FTEsBuilding Financial Models
Developing a Basic Financial Model Build model so that you perform data entry ofvariables in specific categories:–––––HeadcountOperating Expenses (Departments / cost structure)Capital ExpendituresRevenuesCost of Goods Sold (forces Inventory needs) that, in turn, feed into the 3 main financial statementtemplates of:– Income Statement– Balance Sheet– Cash Flow StatementBuilding Financial Models
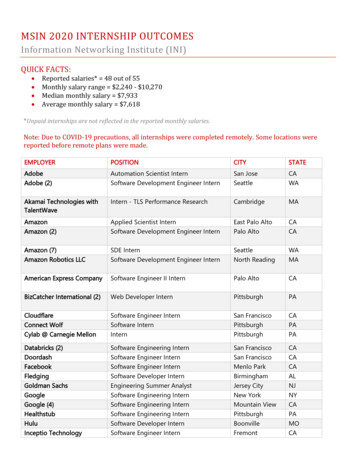
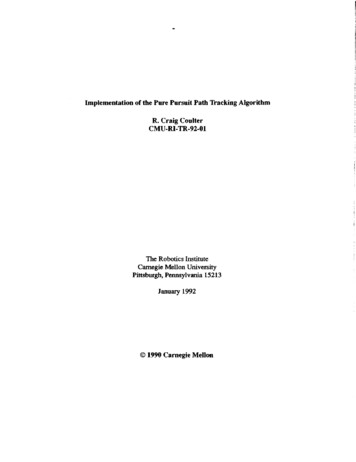
Accounting Basics – Financial StatementsINCOME STATEMENTBALANCE SHEETFull YearRevenueProductServiceOtherTotal RevenueCost of Goods SoldGross ProfitGross Profit MarginOperating expenses:TechnologySalesMarketingGeneral & AdministrativeTotal Operating ExpensesOperating Income (EBITDA)Interest Income/(Expense)Income (loss) before taxesIncome Tax ProvisionNet Income (Loss)1,000,000400,000100,0001,500,000CASH FLOWYear endAssetsCurrent AssetsCashAccounts receivableOther current assetsTotal current 500(149,500)(149,500)Fixed assetsAccumulated depreciationNet fixed assetsTotal AssetsLiabilities and EquityCurrent LiabilitiesAccounts payableAccrued liabilitiesCurrent portion of long term debtTotal current liabilitiesLong term liabilitiesBank loanConvertible debtTotal long term liabilitiesTotal liabilitiesShareholder's EquityStock and additional paid in capitalBeginning retained earnings/(loss)Current earnings/(loss)Total EquityTotal Liabilities and 00(1,550,500)(149,500)300,0001,050,000Full YearCash Flows from Operating ActivitiesNet income/(loss)Adjust for non-cash itemsDepreciationAdjusted net income/(loss)Changed in working capitalChange in receivablesChange in other current assetsChange in accounts payableChange in accrued liabilitiesChange in Working CapitalNet cash used in 75,000(10,500)4,500(120,000)Cash Flows from Investing ActivitiesPurchase of fixed assetsNet cash used in investing activities(100,000)(100,000)Cash Flows from Financing ActivitiesPayment on bank loanReceipt of convertible debtSale of stockNet Cash provided by Financing(50,000)300,000200,000450,000Net Increase (Decrease) in Cash230,000Cash Balance at Beginning of PeriodCash Balance at End of Period270,000500,000
Mapping the Statements TogetherINCOME STATEMENTBALANCE SHEETFull YearRevenueSoftwareServiceOtherTotal RevenueCost of Goods SoldGross ProfitGross Profit MarginOperating expenses:TechnologySalesMarketingGeneral & AdministrativeTotal Operating ExpensesOperating Income (EBITDA)Interest Income/(Expense)Income (loss) before taxesIncome Tax ProvisionNet Income (Loss)1,000,000400,000100,0001,500,000CASH FLOWYear endAssetsCurrent AssetsCashAccounts receivableOther current assetsTotal current 500(149,500)(149,500)Fixed assetsAccumulated depreciationNet fixed assetsTotal AssetsLiabilities and EquityCurrent LiabilitiesAccounts payableAccrued liabilitiesCurrent portion of long term debtTotal current liabilitiesLong term liabilitiesBank loanConvertible debtTotal long term liabilitiesTotal liabilitiesShareholder's EquityStock and additional paid in capitalBeginning retained earnings/(loss)Current earnings/(loss)Total EquityTotal Liabilities and 00(1,550,500)(149,500)300,0001,050,000Full YearCash Flows from Operating ActivitiesNet income/(loss)Adjust for non-cash itemsDepreciationAdjusted net income/(loss)Changed in working capitalChange in receivablesChange in other current assetsChange in accounts payableChange in accrued liabilitiesChange in Working CapitalNet cash used in 75,000(10,500)4,500(120,000)Cash Flows from Investing ActivitiesPurchase of fixed assetsNet cash used in investing activities(100,000)(100,000)Cash Flows from Financing ActivitiesPayment on bank loanReceipt of convertible debtSale of stockNet Cash provided by Financing(50,000)300,000200,000450,000Net Increase (Decrease) in Cash230,000Cash Balance at Beginning of PeriodCash Balance at End of Period270,000500,000
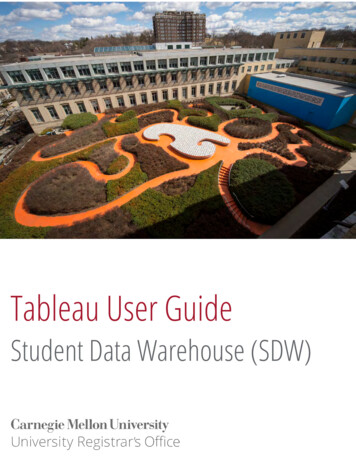
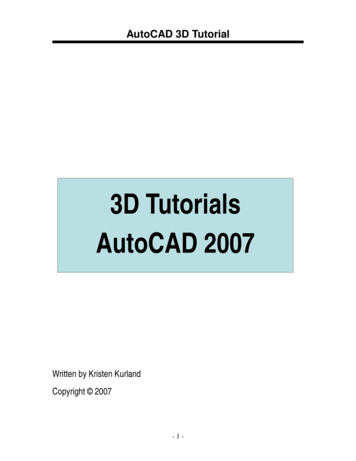
Newco - Market AnalysisYEAR 1YEAR 2YEAR 3YEAR 4YEAR 5Market Size 100M 110M 121M 133M 146MNewco Penetration0.5%0.9%1.65%3.0%4.1%Unit Sales50100200400600Average SellingPrice 10k 10k 10k 10k 10kNewco Revenue 500k 1M 2M 4M 6M* Use Toggle cell(s) for sensitivity testing
Developing a Basic Financial Model Product is you’ll reasonably know the “bottom line”results of your planned operations and the integrity ofyour assumptions This result will tell you if your operations are going toproduce adequate positive cash flow to internally fundcash needs OR if you need to plan on external fundingsources Key milestones are your path to profitability and yourcash flow breakeven point If you use this “modular” format, you’ll have a modelthat lends itself well to sensitivity testing Use a “toggle” cell to quickly create “What If” scenarios Questions so far ? .Building Financial Models
Basic Financial Terms / Metrics Burn Rate – Trending amount of cash you consume in a givenmonth Cost of Goods Sold Operating Expenses Cap Ex Current Debt Obligations Runway – Amount of cash currently on hand to cover BurnRate, which is likely growing over time EBITDA Breakeven – Point at which profitability / incomefrom operations is reached on a sustainable basis (more thana couple months)– EBITDA or Earnings Before Interest, Taxes, Deprec,Amortization Cash Flow Breakeven – Point at which positive net cash flowis reached on a sustainable basis (remember cash is KingKong!) You will burn cash before you sell Expenses/cash outlays precede sales/cash collectionsBuilding Financial Models
Projected Income StatementQ1 15Q2 15Q3 15Q4 15Projected2015Revenues 350 500 650 900 2,400Cost of Service 180 200 220 250 850Gross Margin 170 300 430 650 1,550Gross Margin %49%60%600EBITDA (430) (425) (420) (300) (1,575)Monthly Gross Burn (Burn Rate) (260) (308) (357) (400) 26 85029 95065% 2372572%Operating ExpensesEnding Headcount (FTEs) 66% 3,12529Building Financial Models(331)27
Testing / Reality Checking Your Model You won’t build the perfect model the first time; youmay not do it the 3rd or 4th time Point is, you have now built a model that can betested for validity, completeness and integration Don’t let your potential investors tell you your modeldoesn’t flow or that it breaks when tested (do a TestRun) Perform “what if” analysis - Add more headcount;increase certain operating costs; increase, thendecrease your revenues Does the model behave and respond in the way youhad envisioned? Remember the “toggle” cell to quickly create “What If”scenariosBuilding Financial Models
Reality Checking Your Model Great way to test for reasonableness is tocompare to peer companies or at least yourindustry metrics– Search for the early year financials of thosecompanies Find out who the public companies (or private ifyou know someone who will share info) are inyour space and obtain their financial data – even%’s will help Ask advisors / potential investors for metrics onsimilar companies Internet is FULL of informationBuilding Financial Models
Figuring Out Your Audience You’ve built your model – now what? It is very likely your audience will know more aboutfinance than you will ever know, so it can beintimidating The more sophisticated the potential investor, the moreyou need to be prepared Committing those assumptions to writing and stresstesting your model in advance place you on more firmground If you are approaching a party for the first time, youneed to give them your Business Plan as well (at leastExec Summary) It is MUCH more effective for them to know the story ofyour business before reviewing your financial model If you are going for another round of financing from anexisting party, you can limit this to a narrativeupdateBuilding FinancialModels
Figuring Out Your Audience Investors will quickly see if you have been realistic in yourmodel (you likely won’t go from sales of 1M - 10M in 1 year) The financial model needs to be credible Profitability and cash breakeven do INDEED matter Investors are looking for companies to be “Capital Efficient” Investors won’t want to see your model projecting a largeexternal cash infusion every year Cash flows from operations need to reach the point of selffunding Questions so far ? .Building Financial Models
Funding Calculation – Angel RoundInitial'External'Funding'RoundPre Money)ValuationO/S)Shares) )Pre)AngelPrice)/)Share) )Angel)RoundNew)Money) ) )Angel)RoundNew)Money)Shares) )Angel)RoundNew)Money)%Post MoneyO/S)Shares) )PostAngel'RoundCalculated'as ))))))))))2,000,000))))))))))) 3,000,000 ))))))))))))))))) 0.67 )))))))))))) 500,000)))))))))))))) 750,00020.0% ))))))))))2,500,000))))))))))) w)Money)/)PriceNew)/)Post)SharesPre) )New)MoneyPre) )New)SharesBuilding Financial Models
Capitalization Table (Fully Diluted)Pre ranted ,,,,,,300,00010.0%Angel,Capital,Group,,,,,,,,,,,,, @0.0%Total,,,3,000,000 100.0%Post ,,,,750,00020.0%,,,,,3,750,000100.0%Building Financial Models
Summary Be realistic and conservative Tho
Financial Modeling Phil Compton, CFO SingleSource Property Solutions pacmanwvu@gmail.com Building Financial Models . My Background BS in Accounting – West Virginia University CPA, Entrepreneur, Investor, Advisor 30 years of largely entrepreneurial experience – Public Acctg – PricewaterhouseCoopers (Coopers & Lybrand) – Industry – Black Box (BBOX on Nasdaq), Mallett .