Transcription
PUBLIC SECURITIES GROUP i I GLOBAL LIS TED INFR A S TRUC TURE2Q 2 019Global Listed Infrastructure:Playing Offense with Defensive AssetsHow The Potential for Downside Protection andIncome Generation Can Improve Long-Term ReturnsEXECUTIVE SUMMARYInfrastructure assets, the backbone of the modern economy, provide essential servicesfor everyday life. They facilitate the flow of electrons on a wire, hydrocarbons througha pipeline, cars on a toll road and data transmitted among cellular towers, along withmany other important functions. Listed infrastructure companies that own and operatethese long-lived and historically highly cash-generative assets are often natural monopoliesprotected by high barriers to entry. Their cash flows are generally derived from regulated orconcession-based revenues, often linked to inflation. Due to the inherently inelastic demandof the services they provide, there is a high degree of transparency of the expected revenuesover the life of the asset.Because of the structural features highlighted above, the asset class has a long historyof generating predictable and stable cash flows that have grown over time. We believethat adding these characteristics to a broad-based investment strategy can add value,especially in periods of market decline. To illustrate, we examined the long-term returnprofiles of listed infrastructure indexes relative to broad-based global equities.Our findings demonstrate the relatively defensive nature of infrastructure returnprofiles, based on:i. Favorable market capture statistics and long-term performance, relativeto global equities; andii. Better income returns than global equities.Since these defensive return profiles are structurally rooted in the operating modelsof infrastructure assets, we see them as enduring themes for investors seekingincome-oriented alternatives with attractive risk-adjusted profiles.FOR INSTITUTIONAL USE ONLY AND NOT FOR DISTRIBUTION TO THE PUBLIC.1
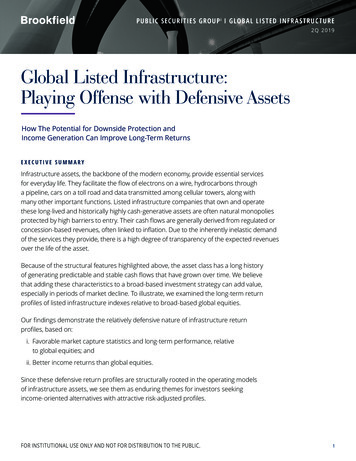
Favorable Market Capture Statistics and Long-TermPerformance, Relative to Global EquitiesWe believe one of the most attractive investment characteristics of listed infrastructure is its potentialto preserve capital when broader equity markets decline.To demonstrate this, we examined the relative performance for listed infrastructure during periods of downmarkets and heightened volatility between January 1, 2006 and December 31, 2018. The time frame reflectsall historical data available for the three most widely used indexes that track listed infrastructure: the FTSEGlobal Core Infrastructure 50/50 Index, the Dow Jones Brookfield Global Infrastructure Composite Indexand the S&P Global Infrastructure Index. We also used an equal-weighted index blendto address any sector/geography biases that exist as a result of differences in the makeup of each index.To examine the efficacy of listed infrastructure’s ability to mitigate downside risk, we studied the following: Frequency of outperformance when broader equities declined Relative performance in up and down markets Relative performance during peak-to-trough drawdowns Relative returns versus global equities during periods of heightened volatilityWe found that in the above scenarios listed infrastructure showed favorable downside capture and relativeoutperformance versus the broader equity market in the majority of instances. We believe this is dueto the fact that these assets are vital to the functioning of the global economy and benefit from relativelyinelastic demand, lower competitive effects and stable cash-flow generation. The results support ourview that, over the long term, listed infrastructure may serve to enhance the risk-adjusted return profileof a multi-asset portfolio.HIGH FREQUENCY OF OUTPERFORMANCE WHEN BROADER EQUITIES DECLINEDOver the study’s 13-year time frame, listed infrastructure proved to be relatively resilient during quarters whenthe MSCI World Index posted a decline. Since infrastructure indexes vary according to their sector composition,we included three commonly used index proxies with varying weightings to energy, utilities, transportation andcommunications.Our findings were that the FTSE Global Core Infrastructure 50/50 Index and the Dow Jones Brookfield GlobalInfrastructure Composite Index outperformed global equities more than 85% of the time during quarterlydeclines for broader equities. The frequency of S&P Global Infrastructure Index outperformance was moremoderate, but still meaningful at 73%.E XHIBIT 1: FREQUENC Y AND AVER AGE OUTPERFORMANCE FOR LIS TED INFR A S TRUC TURE COMPARED TOT H E M S C I W O R L D I N D E X I N D O W N Q U A R T E R S F O R T H E M S C I W O R L D I N D E X , J A N U A R Y 2 0 0 6 – D E C E M B E R 2 0 1 8 iiFREQUENCY OFOUTPERFORMANCE OVERMSCI WORLD INDEX (%)AVERAGEOUTPERFORMANCE OVERMSCI WORLD INDEX (%)OVER THE STUDY’S 13-YEARTIME FRAME, LISTEDFTSE Global Core Infrastructure 50/50 Index874.1INFRASTRUCTURE PROVEDTO BE RELATIVELY RESILIENTDow Jones Brookfield Global Infrastructure Composite Index873.4IN QUARTERS WHEN THES&P Global Infrastructure Index732.0MSCI WORLD INDEX POSTEDEqual-Weighted Index Blend803.2A DECLINEAs of December 31, 2018. Source: Bloomberg. The index data presented above include back-tested performance. Please see the disclosures for additionalinformation on hypothetical performance. Brookfield has no direct role in the day-to-day management of the Dow Jones Brookfield Global InfrastructureComposite Index. Past performance is no guarantee of future results. See index definitions at the end of this report.INDE XFOR INSTITUTIONAL USE ONLY AND NOT FOR DISTRIBUTION TO THE PUBLIC.BROOKFIELD OVERVIEW FAC T SHEET2
FAVOR A BLE C A P TUR E R ATIOS OV ER THE S TUDY PERIODOver the study period, listed infrastructure also deliveredattractive upside and downside capture of the market, asdefined by global equities. Investment managers typicallyuse these ratios to measure the percentage of market gainscaptured by a strategy when markets are up, and converselyto measure the percentage of market losses enduredwhen markets are down. An imbalance between these tworatios—specifically, when downside capture is lower thanupside capture—infers that the strategy can be expected todeliver more favorable risk-adjusted returns versus the broadmarket over the long run. Upside and downside capture canalso be applied to a comparison of public indexes, as we havewith listed infrastructure.When we applied these measures to infrastructure indexes,the FTSE Global Core Infrastructure 50/50 Index exhibitedthe most attractive downside capture ratio, likely driven byits higher allocation to utilities, which tend to be a defensiveinfrastructure sector. And while the downside capture forthe Dow Jones Brookfield Global Infrastructure CompositeIndex was slightly less favorable at 61%, the index exhibiteda higher upside capture of 88%. This is likely due to thegreater exposure to energy infrastructure, which historicallyhave shown a higher beta to the broader equity market.E X HIBIT 2: UP SIDE A ND DOWNSIDE C A P TUR E R ATIOS, LIS TED INFR A S TRUC TUR E INDE X ES COMPA R EDTO THE MSCI WORLD INDEX, JANUARY 2006 – DECEMBER 2018DOWNSIDECAPTURE RATIO (%)UPSIDECAPTURE RATIO (%)5282Dow Jones Brookfield Global Infrastructure Composite Index6188S&P Global Infrastructure Index7888Equal-Weighted Index Blend6486INDE XFTSE Global Core Infrastructure 50/50 IndexOVER THE STUDY PERIOD,LISTED INFRASTRUCTUREDELIVERED ATTRACTIVEUPSIDE AND DOWNSIDECAPTURE RELATIVETO GLOBAL EQUITIESAs of December 31, 2018. Source: eVestment. The index data presented above include back-tested performance. Please see the disclosures for additionalinformation on hypothetical performance. Brookfield has no direct role in the day-to-day management of the Dow Jones Brookfield Global InfrastructureComposite Index. Past performance is no guarantee of future results. See index definitions at the end of this report.POSITIV E R EL ATIV E PER FOR M A NCE DURING PE A K-TO -TROUG H DR AWDOWN SListed infrastructure has also shown the ability to mitigatedownside risk during periods of meaningful peak-to-troughdrawdowns. Within the study period we identified ninedrawdowns of 5% or more in the MSCI World Index.Results, presented in Exhibit 3, show that infrastructureoutperformance was most pronounced for the FTSE GlobalCore Infrastructure 50/50 Index, which produced positiverelative returns in eight of the nine drawdowns. The twoother indexes and the equal-weighted blend outperformedin six of the nine drawdowns.E X HIBIT 3: R EL ATIV E R E TUR NS OF LIS TED INFR A S TRUC TUR E INDE X ES COMPA R ED TO THE MSCI WOR LD INDE XDURING DR AWDOWNS OF 5% OR MORE IN THE MSCI WORLD INDEX, JANUARY 2006 – DECEMBER 2018MSCIWORLDINDEXPeakTroughFTSE GLOBALCOREINFRASTRUCTURE50/50 INDEXDrawdown DrawdownDOW JONESBROOKFIELD GLOBALINFRASTRUCTURECOMPOSITE INDEXRelativeDrawdownS&P 8%5/10/2006 5%7/20/2007 -56.7%0.7%-51.4%6.0%5/22/2013 .9%5.7%-24.6%-7.0%-18.6%-1.0%-18.5%-0.9%1/29/2018 2.6%2.9%INFRASTRUCTUREEQUITIES HAVE BEENSHOWN TO MITIGATEDOWNSIDE RISKDURING PERIODSOF MEANINGFULDRAWDOWNSAs of December 31, 2018. Source: Bloomberg. The index data presented above include back-tested performance. Please see the disclosures for additionalinformation on hypothetical performance. Brookfield has no direct role in the day-to-day management of the Dow Jones Brookfield Global InfrastructureComposite Index. Past performance is no guarantee of future results. See index definitions at the end of this report.FOR INSTITUTIONAL USE ONLY AND NOT FOR DISTRIBUTION TO THE PUBLIC.BROOKFIELD OVERVIEW FAC T SHEET3
R E L AT I V E LY P O S I T I V E R E T U R N S V E R S U S G L O B A L E Q U I T I E S D U R I N G P E R I O D S O F H E I G H T E N E D V O L AT I L I T YLastly, we found a high frequency of infrastructureoutperformance when compared to the performance ofbroader market equities during monthly “volatility spikes.”We defined these periods to be when the average monthlyvalue of the CBOE Volatility (VIX) Index was at least onestandard deviation higher than the previous month.Exhibit 4 highlights the results. Along with the indexblend, the FTSE Global Core Infrastructure 50/50 and DowJones Brookfield Global Infrastructure Composite indexesoutperformed in more than 80% of these instances. Asin Exhibit 1, the frequency and magnitude of S&P GlobalInfrastructure Index outperformance was more moderate.E XHIBIT 4: FREQUENC Y AND AVER AGE OUTPERFORMANCE FOR LIS TED INFR A S TRUC TURE COMPAREDT O T H E M S C I W O R L D I N D E X I N M O N T H S O F H E I G H T E N E D V O L A T I L I T Y iv, J A N U A R Y 2 0 0 6 – D E C E M B E R 2 0 1 8 VFREQUENCY OFOUTPERFORMANCE OVERMSCI WORLD INDEX (%)AVERAGEOUTPERFORMANCE OVERMSCI WORLD INDEX (%)FTSE Global Core Infrastructure 50/50 Index882.5Dow Jones Brookfield Global Infrastructure Composite Index821.9S&P Global Infrastructure Index771.2Equal-Weighted Index Blend881.8INDE XWE FOUND A HIGH FREQUENCYOF INFRASTRUCTUREOUTPERFORMANCE COMPAREDTO BROADER EQUITIES DURINGMONTHLY VOLATILITY SPIKESAs of December 31, 2018. Source: Bloomberg. The index data presented above include back-tested performance. Please see the disclosures for additionalinformation on hypothetical performance. Brookfield has no direct role in the day-to-day management of the Dow Jones Brookfield Global Infrastructure Index.See index definitions at the end of this report. Past performance is no guarantee of future results.The defensive nature of global listed infrastructure returns stems largely from the inherent characteristicsof the essential services they provide in the energy, utilities, transportation and communications industries.In our view, although these groups are diversified broadly by geography, business models and industryspecific fundamentals, they also share some common structural features, which have supported a longhistory of steady and growing cash flows.COMMON FEATURES OFINFR ASTRUCTURE ASSETSHISTORICAL CASH-FLOWCHAR ACTERISTICSEssential services withinherently inelastic demand,faced with limited competitionand, generally, structures withregulated or concession-basedrevenues.These features have supportedstable streams of cash flow,which have buoyed total returnsin times of economic contraction.These trends are evidencedby infrastructure’s favorabledownside capture trendsin broader market downturnsand attractive long-termrisk-adjusted returns.The regulated or concessionbased revenue streamsof infrastructure assetsare often linked to inflation.Positive inflation sensitivity drivespricing power—the ability to passalong rising costs to customers—which in turn has supportedcash flows and driven assetvalues higher.FOR INSTITUTIONAL USE ONLY AND NOT FOR DISTRIBUTION TO THE PUBLIC.BROOKFIELD OVERVIEW FAC T SHEET4
Better Income Returns Than Global EquitiesIn addition to downside protection, the income generation oflisted infrastructure has been another primary driver of itsattractive relative long-term returns. In some cases, equitymarket drawdowns have extended for protracted periods oftime. As such, the income potential should be considered asa key component of total return throughout an investmentcycle, in our view.Exhibit 5 presents annual EBITDA growth that illustratesthe attractive historical cash flows of listed infrastructure,which have been measurably higher than those of globalequities. As previously noted, we believe infrastructure’scharacteristics—essential services with inherently inelasticdemand, limited competition and the presence of regulatedor concession-based revenues—help support the stabilityof cash flow streams. Historically higher EBITDA growth haslikely been a key driver behind the better income returns oflisted infrastructure, compared with broader global equities.We show these results in Exhibit 6.E X HIBIT 5: COMPA RISON OF EBITDA GROW TH: 20 0 6 –2018Global InfrastructureGlobal %AVERAGE0-5-8.9-10-158.2%-1.6Annual EBITDA Growth 0172018As of December 31, 2017. Source: Brookfield Public Securities Group LLC research and estimates; FactSet; S&P Dow Jones Indices; Merrill Lynch Global QuantitativeStrategy; MSCI; IBES; Worldscope. Global Infrastructure and Global Equities represented by the Dow Jones Brookfield Global Infrastructure Composite Index andMSCI ACWI Index, respectively. Brookfield has no direct role in the day-to-day management of the Dow Jones Brookfield Global Infrastructure Index. The indexdata presented above include back-tested performance. Please see the disclosures for additional information on hypothetical performance. Global InfrastructureEBITDA growth is derived using the constituents of the Dow Jones Brookfield Global Infrastructure Composite Index. Brookfield does not have direct responsibilityin managing the Dow Jones Index. Note: Median EBITDA (Earnings Before Interest, Taxes, Depreciation and 2.62.82.23.25.73.82013-YEAR AVERAGE –GLOBAL INFRASTRUCTURE1.72.53.443.6%3.53.364.0Global Equities4.2Global Infrastructure2.7Income Return (%)E X HIBIT 6: COMPA RISON OF INCOME RE TURN: 20 0 6 620172.8%13-YEAR AVERAGE –GLOBAL EQUITIES2018As of December 31, 2018. Source: Bloomberg. Global Infrastructure are represented by the Dow Jones Brookfield Global Infrastructure Composite Index and GlobalEquities are represented by the MSCI World Index. The index data presented above include back-tested performance. Please see the disclosures for additionalinformation on hypothetical performance. Past performance is no guarantee of future results.Income generation is a key component of total return—not just when markets are moving higher but, perhaps more importantly, whenthey reverse course. Over the course of our study period, we found the income return component was consistently higher for globalinfrastructure. In our view, the historically higher income returns are an essential element helping to drive the attractive risk-adjustedreturns of listed infrastructure securities.FOR INSTITUTIONAL USE ONLY AND NOT FOR DISTRIBUTION TO THE PUBLIC.BROOKFIELD OVERVIEW FAC T SHEET5
ConclusionOur analysis has demonstrated the relative resiliency of listed infrastructure over multiple marketdownturns and periods of elevated volatility, based on favorable market capture statistics and highincome returns relative to global equities. We deem this combination to be a key driver behindinfrastructure’s attractive risk-adjusted returns shown in Exhibit 7.In closing, we maintain that these long-standing results are inherently tied to the stable, inflation-linkedcash flows for which essential infrastructure services are known. These are enduring themes for theasset class, which can add value to investors seeking income-oriented alternatives with attractiverisk-adjusted returns.E X HIBIT 7: RIS K / R E WA R D S TATIS TIC S , J A N UA RY 20 0 6 – DECE M B E R 201810FTSE Global Core Infrastructure 50/50 IndexDow Jones Brookfield GlobalInfrastructure Composite IndexAnnual Total Return (%)Equal-Weighted Index BlendS&P Global Infrastructure IndexGlobal Equities5Risk Free Rate005101520Annualized Standard Deviation (%)ANNUALIZEDRETURN (%)ANNUALIZED STANDARDDEVIATION (%)SHARPERATIOFTSE Global Core Infrastructure 50/50 Index8.312.20.58Dow Jones Brookfield Global Infrastructure Composite Index8.312.90.55S&P Global Infrastructure Index6.215.00.33INDE XEqual-Weighted Index Blend7.613.10.49MSCI World Index5.915.20.31Global Equities defined as the MSCI World Total Return Index. Risk Free Rate defined as the ICE BofA Merrill Lynch 3-Month Treasury Index. The indexdata presented above include back-tested performance. Please see the disclosures for additional information on hypothetical performance. Brookfieldhas no direct role in the day-to-day management of the Dow Jones Brookfield Global Infrastructure Composite Index. Past performance is not indicativeof future results. See index definitions at the end of this report.FOR INSTITUTIONAL USE ONLY AND NOT FOR DISTRIBUTION TO THE PUBLIC.BROOKFIELD OVERVIEW FAC T SHEET6
IMPORTA NT DISCLOSURESBrookfield Public Securities Group LLC (“PSG” or “the Firm”), which priorto January 4, 2019 was known as Brookfield Investment Management Inc.,is an SEC-registered investment adviser and represents the Public SecuritiesGroup of Brookfield Asset Management Inc., providing global listed real assetsstrategies including real estate equities, infrastructure equities, multi-strategyreal asset solutions and real asset debt. PSG manages separate accounts,registered funds and opportunistic strategies for institutional and individualclients, including financial institutions, public and private pension plans,insurance companies, endowments and foundations, sovereign wealthfunds and high net worth investors. PSG is an indirect, wholly-ownedsubsidiary of Brookfield Asset Management, Inc., a leading global alternativeasset manager with approximately 350 billion of assets under managementas of December 31, 2018. PSG manages approximately 18 billion of assetsas of January 31, 2019.indicative of future results. In particular, they do not reflect actual tradingin an account or fund, so there is no guarantee that an actual account or fundwould have achieved the hypothetical or back-tested results shown. There maybe material factors relevant to any such comparison, such as differences involatility and the regulatory and legal restrictions between the indexes shownand a Brookfield investment strategy. Past performance is not indicative offuture returns.The information in this presentation is not intended as investment advice,an indication of trading intent or holdings or the prediction of investmentperformance. Views and information expressed herein are subject to changeat any time. Brookfield Public Securities Group LLC disclaims any responsibilityto update such views and/or information. This information is deemed to befrom reliable sources; however, Brookfield Public Securities Group LLC doesnot warrant its completeness or accuracy. This presentation is not intended toconstitute and does not constitute an offer or solicitation to sell or a solicitationof an offer to buy any security, product, investment advice or service; nor shallany security, product, investment advice or service be offered or sold in anyjurisdiction in which Brookfield Public Securities Group LLC is not licensedto conduct business and/or an offer, solicitation, purchase or sale would beunavailable or unlawful. Opinions expressed herein are current opinions ofBrookfield Public Securities Group LLC, including its subsidiaries and affiliates,and are subject to change without notice. Brookfield Public Securities GroupLLC and its subsidiaries and affiliates assume no responsibility to updatesuch information or to notify clients of any changes. Any outlooks, forecastsor portfolio weightings presented herein are as of the date appearing on thismaterial only and are also subject to change without notice.Past performance is not indicative of future performance.FORWA RD - LOOKING S TATEMENT SInformation herein contains, includes or is based upon forward-lookingstatements within the meaning of the federal securities laws, specificallySection 21E of the Securities Exchange Act of 1934, as amended. Forwardlooking statements include all statements, other than statements of historicalfact, that address future activities, events, or developments, including,without limitation, business or investment strategy or measures to implementstrategy, competitive strengths, goals, expansion and growth of our business,plans, prospects and references to our future success. You can identify thesestatements by the fact that they do not relate strictly to historical or currentfacts. Words such as “anticipate,” “estimate,” “expect,” “project,” “intend,” “plan,”“believe” and other similar words are intended to identify these forwardlooking statements. Forward-looking statements can be affected by inaccurateassumptions or by known or unknown risks and uncertainties. Many suchfactors will be important in determining our actual future results or outcomes.Consequently, no forward-looking statement can be guaranteed. Our actualresults or outcomes may vary materially. Given these uncertainties, you shouldnot place undue reliance on these forward-looking statements.HYPOTHETICAL PERFORMANCEThe information and data included in this publication constitute hypotheticaland/or back-tested information, and do not represent the investmentperformance of any actual investor account, investment product or strategy.The hypothetical and/or back-tested simulated results are net of estimatedadvisory fees and transaction costs for private index returns and gross of feesand transaction costs for public index returns; all dividends are assumed tobe reinvested. Although the information and data in this publication providebackground information and data relevant to considering prior events andrisks, past hypothetical or back-tested performance is not a guarantee of futurereturns. It is possible that the markets will perform better or worse than shownin the hypothetical and back-tested simulation results; that the actual results ofan investor who invests in the manner these simulations suggest will be betteror worse than the simulations; and that an investor may lose money by investingin the manner the simulations suggest. Although the information containedherein has been obtained from sources believed to be reliable, its accuracyand completeness cannot be guaranteed. While the simulation results reflectrigorous application of the methodology selected, the hypothetical and backtested simulation results have certain limitations and should not be consideredPerformance back-tested by an index provider, prior to the launch date ofindexes used in this report, are highlighted below:IndexLaunch DateBack-tested PerformanceDow Jones Brookfield GlobalInfrastructure Composite Index7/14/0812/31/2003 – 7/31/2008FTSE Global Core infrastructure50/50 Total Return Index3/2/201512/31/2003 – 3/31/2005S&P Global Infrastructure Index2/22/20072/31/2003 – 2/28/2007INDEX DEFINITIONSThe CBOE Volatility Index, or VIX, is a real-time market index that represents themarket’s expectation of 30-day forward-looking volatility.The Dow Jones Brookfield Global Infrastructure Composite Index is calculatedand maintained by S&P Dow Jones Indices and comprises infrastructurecompanies with at least 70% of their annual cash flows derived from owning andoperating infrastructure assets, including master limited partnerships (“MLPs”).Brookfield has no direct role in the day-to-day management of the Dow JonesBrookfield Global Infrastructure Composite Index.The FTSE Global Core Infrastructure 50/50 Index gives participants an industrydefined interpretation of infrastructure and adjusts the exposure to certaininfrastructure sub-sectors. The constituent weights are adjusted as part of thesemi-annual review according to three broad industry sectors: 50% utilities;30% transportation, including capping of 7.5% for railroads/railways; and a20% mix of other sectors, including pipelines, satellites and telecommunicationtowers. Company weights within each group are adjusted in proportion to theirinvestable market capitalization.The ICE BofA Merrill Lynch 3-Month Treasury Index measures short-term U.S.Treasury Bills.The MSCI World Index is a free float-adjusted market capitalization-weightedindex that is designed to measure the equity market performance of developedmarkets.The MSCI ACWI Index is a free float-adjusted market capitalization-weightedindex that is designed to measure the equity market performance of developedand emerging markets.The S&P Global Infrastructure Index provides liquid and tradable exposureto 75 companies from around the world that represent the listed infrastructureuniverse with weights across three infrastructure clusters: utilities,transportation and energy.The above-mentioned indices do not reflect deductions for fees, expensesor taxes. The indexes are unmanaged and cannot be purchased directly byinvestors. Index performance is shown for illustrative purposes only and doesnot predict or depict the performance of any investment.INDEX PROVIDER DISCLOSUREBrookfield Public Securities Group LLC, formerly Brookfield InvestmentManagement Inc., does not own or participate in the construction or day-to-daymanagement of the indices referenced in this document. The index informationprovided is for your information only and does not imply or predict that aBrookfield Public Securities Group product will achieve similar results. Thisinformation is subject to change without notice.The indices referenced in this document do not reflect any fees, expenses,sales charges or taxes. It is not possible to invest directly in an index. The indexsponsors permit use of their indices and related data on an “as is” basis; makeno warranties regarding same; do not guarantee the suitability, quality, accuracy,timeliness, and/or completeness of their index or any data included in, related toor derived therefrom; and assume no liability in connection with the use of theforegoing. The index sponsors have no liability for any direct, indirect, special,incidental, punitive, consequential or other damages (including loss of profits).The index sponsors do not sponsor, endorse or recommend Brookfield PublicSecurities Group or any of its products or services.FOR INSTITUTIONAL USE ONLY AND NOT FOR DISTRIBUTION TO THE PUBLIC.BROOKFIELD OVERVIEW FAC T SHEET7
DEFINITIONS OF TERMSAnnualized Return is periodic returns rescaled to a period of one year.Sharpe Ratio is a measure of the excess return (or risk premium) per unit of risk(measured by standard deviation) in an investment asset or a trading strategy.Standard Deviation measures the degree to which an investment’s return variesfrom its mean return.ENDNOTESi . Brookfield Public Securities Group LLC (“PSG” or “the Firm”) is an indirect,wholly owned subsidiary of Brookfield Asset Management.i i. Regression analyses of MSCI World Index returns during these periodscompared to the relative performance of the FTSE Global Core Infrastructure50/50 Index, Dow Jones Brookfield Global Infrastructure CompositeIndex and Equal-Weighted Infrastructure Index Blend were found tobe statistically significant at a p-value of 0.01; but not for the S&P GlobalInfrastructure Index.i i i. While we acknowledge the VIX Index is designed to measure expectedvolatility of the U.S. stock market, we believe it serves as a barometer forvolatility in global equity markets as well; markets on which our studywas based.i v. We defined those months when the average value of the CBOE Volatility (VIX)Index was at least one standard deviation higher compared to the prior(rolling) 12-month period.v. Regression analyses of MSCI World Index returns during these periodscompared to the relative performance of the FTSE Global Core Infrastructure50/50 Index, Dow Jones Brookfield Global Infrastructure CompositeIndex and Equal-Weighted Infrastructure Index Blend were found tobe statistically significant at a p-value of 0.01; but not for the S&P GlobalInfrastructure Index.CONTAC T USbro
FTSE Global Core Infrastructure 50/50 Index 87 4.1 Dow Jones Brookfield Global Infrastructure Composite Index 87 3.4 S&P Global Infrastructure Index 73 2.0 Equal-Weighted Index Blend 80 3.2 As of December 31, 2018. Source: Bloomberg. The index data presented above include back-tested performance. Please see the disclosures for additional