Transcription
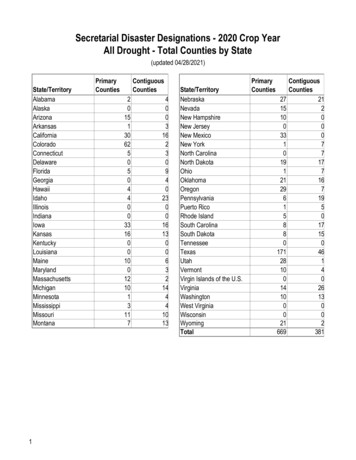
Texas QuarterlyStatewideFirst quarter 2018Price Distribution 0 - 99,999 224,500Up5.72.932.0%29.7% 100,000 - 199,999% 200,000 - 299,9996.8% 500,000 - 749,9995.2% 750,000 - 999,999 1.4% 1,000,000 1.3% 400,000 - 499,999%Up93,151 in 2018 Q1Days on marketDays to closeTotalUnchanged from 2017 Q114.4% 300,000 - 399,999Compared to same quarter last yearDown9.3%2.2%70,292 in 2018 Q16633993.3Compared to 3.5 in 2017 Q1
Texas QuarterlyAbilene MSAFirst quarter 2018Price Distribution 154,000Up1.37.949.1% 100,000 - 199,999% 300,000 - 399,999 400,000 - 499,999 500,000 - 749,999 750,000 - 999,999 1,000,000 %Down599 in 2018 Q1Days on marketDays to closeTotal7 days less than 2017 Q118.5% 200,000 - 299,999Compared to same quarter last yearDown24.9% 0 - 99,9995.7%0.7%1.1%0.0%0.0%6.5%459 in 2018 Q16038983.1Compared to 3.5 in 2017 Q1
Texas QuarterlyAmarillo MSAFirst quarter 2018Price Distribution 160,000Up3.22.546.7% 100,000 - 199,999% 300,000 - 399,999 400,000 - 499,999 500,000 - 749,999 750,000 - 999,999 1,000,000 %Down953 in 2018 Q1Days on marketDays to closeTotal2 days more than 2017 Q122.2% 200,000 - 299,999Compared to same quarter last yearUp19.7% 0 - 99,9996.4%1.9%2.6%0.3%0.2%%6622 in 2018 Q15734913.6Compared to 3.4 in 2017 Q1
Texas QuarterlyAustin-Round Rock MSAFirst quarter 2018Price Distribution 295,000Up 100,000 - 199,9993.5%2.8 400,000 - 499,999 500,000 - 749,999 750,000 - 999,999 1,000,000 Up6,414 in 2018 Q15 days more than 2017 Q138.9%21.3% 300,000 - 399,999%Days on marketDays to closeTotal11.8% 200,000 - 299,999Compared to same quarter last yearDown0.7% 0 - 99,99911.9%10.1%2.7%2.6%7.7%7,115 in 2018 Q166361022.2Compared to 2.4 in 2017 Q1
Texas QuarterlyBeaumont-Port Arthur MSAFirst quarter 2018Price Distribution 137,500Up1.9 100,000 - 199,999%33.3 300,000 - 399,999 400,000 - 499,999 500,000 - 749,999 750,000 - 999,999 1,000,000 %832 in 2018 Q1Days on marketDays to closeTotal8 days less than 2017 Q117.1% 200,000 - 299,999Compared to same quarter last yearDown34.0%37.3% 0 - 99,999Up7.8%2.5%1.2%0.1%0.0%5.1%811 in 2018 Q18313962.6Compared to 4.4 in 2017 Q1
Texas QuarterlyBrownsville-Harlingen MSAFirst quarter 2018Price Distribution 140,000Up%14.810.8%1,643 in 2018 Q1Days on marketDays to closeTotal7 days less than 2017 Q146.8% 100,000 - 199,999Compared to same quarter last yearDown28.6% 0 - 99,999 200,000 - 299,999 300,000 - 399,999 400,000 - 499,999 500,000 - 749,999 750,000 - 999,999 1,000,000 Down15.4%5.8%2.0%0.7%0.5%0.2%3.8%479 in 2018 Q1126291559.0Compared to 10.1 in 2017 Q1
Texas QuarterlyCollege Station-Bryan MSAFirst quarter 2018Price Distribution 0 - 99,999 215,950Up4.8%37.4 200,000 - 299,9995 days more than 2017 Q114.1% 300,000 - 399,9996.4% 500,000 - 749,9995.2% 750,000 - 999,999 1.5% 1,000,000 0.3% 400,000 - 499,999%1,160 in 2018 Q1Days on marketDays to closeTotal34.1%31.5% 100,000 - 199,999Compared to same quarter last yearUp6.9%Down9.2%671 in 2018 Q16531964.2Compared to 3.0 in 2017 Q1
Texas QuarterlyCorpus Christi MSAFirst quarter 2018Price Distribution 0 - 99,999 186,700Down0.2%20.43 days more than 2017 Q1 300,000 - 399,999 500,000 - 749,999 750,000 - 999,999 1,000,000 %30.4% 200,000 - 299,999 400,000 - 499,9992,348 in 2018 Q1Days on marketDays to closeTotal42.6% 100,000 - 199,999Compared to same quarter last yearDown13.9%Up8.2%2.6%1.4%0.7%0.2%3.9%1,179 in 2018 Q192371295.4Compared to 6.6 in 2017 Q1
Texas QuarterlyDallas-Fort Worth-Arlington MSAFirst quarter 2018Price Distribution 0 - 99,999 258,000Up6.22.625.2%33.9%18.7% 100,000 - 199,999% 200,000 - 299,999 300,000 - 399,9998.9% 500,000 - 749,9996.6% 750,000 - 999,999 1.7% 1,000,000 1.6% 400,000 - 499,999Compared to same quarter last yearUp3.5%%Up18,269 in 2018 Q1Days on marketDays to closeTotal3 days more than 2017 Q10.7%20,660 in 2018 Q14832802.1Compared to 2.2 in 2017 Q1
Texas QuarterlyEl Paso MSAFirst quarter 2018Price Distribution 0 - 99,999 147,000Up1.45.361.9% 100,000 - 199,999% 200,000 - 299,999 300,000 - 399,999 400,000 - 499,999 500,000 - 749,999 750,000 - 999,999Compared to same quarter last yearDown18.5% 1,000,000 %Up3,233 in 2018 Q1Days on marketDays to closeTotal10 days less than 2017 Q114.5%3.3%1.1%0.6%0.1%0.1%5.8%1,709 in 2018 Q199351344.9Compared to 5.6 in 2017 Q1
Texas QuarterlyHouston-The Woodlands-Sugar Land MSAFirst quarter 2018Price Distribution 0 - 99,999 225,000Up2.31.233.4%29.9% 100,000 - 199,999% 200,000 - 299,9996.6% 500,000 - 749,9995.2% 750,000 - 999,999 1.6% 1,000,000 1.5% 400,000 - 499,999%Up24,491 in 2018 Q1Days on marketDays to closeTotal1 day more than 2017 Q115.0% 300,000 - 399,999Compared to same quarter last yearDown6.8%1.7%17,652 in 2018 Q16435993.5Compared to 3.6 in 2017 Q1 2018 Houston Realtors Information Service, Inc. - Certain information contained herein is derivedfrom information which is the licensed property of, and copyrighted by, Houston Realtors Information Service, Inc.
Texas QuarterlyKilleen-Temple MSAFirst quarter 2018Price Distribution 0 - 99,999 150,000Up4% 200,000 - 299,999 300,000 - 399,999 400,000 - 499,999 500,000 - 749,999 750,000 - 999,999 1,000,000 %14Down1,610 in 2018 Q1Days on marketDays to closeTotal9 days less than 2017 Q153.9% 100,000 - 199,999Compared to same quarter last yearDown21.0%17.7%5.0%0.8%1.3%0.2%0.1%2.6%1,254 in 2018 Q169331023.1Compared to 3.6 in 2017 Q1
Texas QuarterlyLaredo MSAFirst quarter 2018Price Distribution 0 - 99,999 158,000Up2.1%21.6% 200,000 - 299,999 300,000 - 399,999 400,000 - 499,999 500,000 - 749,999 750,000 - 999,999 1,000,000 10.8%Days on marketDays to closeTotal6739106535 in 2018 Q13 days less than 2017 Q159.3% 100,000 - 199,999Compared to same quarter last yearUp11.4%Down5.5%0.4%1.3%0.0%0.4%%6253 in 2018 Q15.2Compared to 4.5 in 2017 Q1
Texas QuarterlyLongview MSAFirst quarter 2018Price Distribution 0 - 99,999 148,950Up4.2%18.7 200,000 - 299,999 300,000 - 399,999 400,000 - 499,999 500,000 - 749,999 750,000 - 999,999 1,000,000 %1,062 in 2018 Q1Days on marketDays to closeTotal2 days more than 2017 Q150.5% 100,000 - 199,999Compared to same quarter last yearDown23.4%Up17.9%6.0%1.0%1.0%0.2%0.0%10.3451 in 2018 Q1110361466.3Compared to 8.5 in 2017 Q1%
Texas QuarterlyLubbock MSAFirst quarter 2018Price Distribution 159,900Up%12.4%205 days less than 2017 Q118.8% 200,000 - 299,999 300,000 - 399,999 400,000 - 499,999 500,000 - 749,999 750,000 - 999,999 1,000,000 Up943 in 2018 Q1Days on marketDays to closeTotal49.1% 100,000 - 199,999Compared to same quarter last yearUp19.5% 0 - 99,9998.6%2.5%1.2%0.2%0.1%%10882 in 2018 Q15032822.9Compared to 2.4 in 2017 Q1
Texas QuarterlyMcAllen-Edinburg-Mission MSAFirst quarter 2018Price Distribution 0 - 99,999 142,500Up5.66.156.4% 100,000 - 199,999% 200,000 - 299,999 300,000 - 399,999 400,000 - 499,999 500,000 - 749,999 750,000 - 999,999Compared to same quarter last yearUp23.8% 1,000,000 %Down2,149 in 2018 Q1Days on marketDays to closeTotal3 days more than 2017 Q114.8%3.4%1.0%0.6%0.0%0.0%0.9%669 in 2018 Q1108321408.5Compared to 8.6 in 2017 Q1
Texas QuarterlyMidland MSAFirst quarter 2018Price Distribution 0 - 99,999 269,500Up 100,000 - 199,999%12.3Compared to same quarter last yearDown43.6%230 in 2018 Q1Days on marketDays to closeTotal20 days less than 2017 Q16.3%20.2%33.3% 200,000 - 299,999 300,000 - 399,999 400,000 - 499,999 500,000 - 749,999 750,000 - 999,999 1,000,000 Down20.0%11.8%5.6%2.5%0.4%3.8%604 in 2018 Q14540851.0Compared to 2.1 in 2017 Q1
Texas QuarterlyOdessa MSAFirst quarter 2018Price Distribution 0 - 99,999 187,000Up%10.160.4%164 in 2018 Q1Days on marketDays to closeTotal19 days less than 2017 Q144.7%33.6% 100,000 - 199,999Compared to same quarter last yearDown11.0% 200,000 - 299,999 300,000 - 399,999 400,000 - 499,999 500,000 - 749,999 750,000 - 999,999 1,000,000 Up5.7%3.3%1.8%0.0%0.0%%33351 in 2018 Q15440941.4Compared to 4.3 in 2017 Q1
Texas QuarterlySan Angelo MSAFirst quarter 2018Price Distribution 163,500Up6.39.347.4% 100,000 - 199,999% 300,000 - 399,999 400,000 - 499,999 500,000 - 749,999 750,000 - 999,999 1,000,000 %Up428 in 2018 Q1Days on marketDays to closeTotal7 days less than 2017 Q124.4% 200,000 - 299,999Compared to same quarter last yearDown18.8% 0 - 99,9996.2%2.3%0.7%0.3%0.0%11.2319 in 2018 Q183351183.5Compared to 4.0 in 2017 Q1%
Texas QuarterlySan Antonio-New BraunfelsMSAFirst2018PricequarterDistribution 0 - 99,999 214,000Up7.31.537.4%32.5% 100,000 - 199,999% 200,000 - 299,999 300,000 - 399,999 400,000 - 499,999 500,000 - 749,999 750,000 - 999,999Compared to same quarter last yearUp6.9% 1,000,000 %Up8,740 in 2018 Q1Days on marketDays to closeTotal1 day more than 2017 Q111.9%6.2%3.8%0.8%0.5%%56,928 in 2018 Q166341003.2Compared to 3.3 in 2017 Q1
Texas QuarterlySherman-Denison MSAFirst quarter 2018Price Distribution 161,000Up6.6%12.48 days more than 2017 Q123.2% 200,000 - 299,999 300,000 - 399,999 400,000 - 499,999 500,000 - 749,999 750,000 - 999,999 1,000,000 %474 in 2018 Q1Days on marketDays to closeTotal44.9% 100,000 - 199,999Compared to same quarter last yearDown18.6% 0 - 99,999Up8.0%2.1%1.6%0.5%1.2%5.7%443 in 2018 Q172341062.8Compared to 3.4 in 2017 Q1
Texas QuarterlyTexarkana MSAFirst quarter 2018Price Distribution 127,250Down4.6 100,000 - 199,999% 750,000 - 999,999 1,000,000 37Up1,044 in 2018 Q1Days on marketDays to closeTotal11 days less than 2017 Q1 300,000 - 399,999 500,000 - 749,999%19.9% 200,000 - 299,999 400,000 - 499,999Compared to same quarter last yearUp38.4%39.7% 0 - 99,9991.4%0.7%0.0%0.0%0.0%3.5%149 in 2018 Q1963613217.3Compared to 13.0 in 2017 Q1
Texas QuarterlyTyler MSAFirst quarter 2018Price Distribution 0 - 99,999 198,950Up% 300,000 - 399,999 400,000 - 499,999 500,000 - 749,999 750,000 - 999,999 1,000,000 %930 in 2018 Q1Days on marketDays to closeTotal2 days less than 2017 Q128.1% 200,000 - 299,9991315.441.5% 100,000 - 199,999Compared to same quarter last yearDown10.2%Down10.6%5.2%3.9%0.4%0.2%10.8551 in 2018 Q110051053.9Compared to 4.7 in 2017 Q1%
Texas QuarterlyVictoria MSAFirst quarter 2018Price Distribution 162,183Up2%35.97 days less than 2017 Q123.2% 200,000 - 299,999 300,000 - 399,999 400,000 - 499,999 500,000 - 749,999 750,000 - 999,999 1,000,000 %238 in 2018 Q1Days on marketDays to closeTotal47.0% 100,000 - 199,999Compared to same quarter last yearDown19.6% 0 - 99,999Down8.3%1.8%0.0%0.0%0.0%3.4%169 in 2018 Q194231173.5Compared to 5.5 in 2017 Q1
Texas QuarterlyWaco MSAFirst quarter 2018Price Distribution 175,000Up9.4% 300,000 - 399,999 400,000 - 499,999 500,000 - 749,999 750,000 - 999,999 1,000,000 29Up650 in 2018 Q16 days more than 2017 Q124.3% 200,000 - 299,999%Days on marketDays to closeTotal41.5% 100,000 - 199,999Compared to same quarter last yearUp21.6% 0 - 99,9998.5%2.3%1.9%0.0%0.0%3.2%551 in 2018 Q163381012.8Compared to 2.2 in 2017 Q1
Texas QuarterlyWichita Falls MSAFirst quarter 2018Price Distribution 105,000Up5.1 100,000 - 199,999% 200,000 - 299,999 300,000 - 399,999 400,000 - 499,999 500,000 - 749,999 750,000 - 999,999Compared to same quarter last yearDown 1,000,000 %10Up516 in 2018 Q1Days on marketDays to closeTotal5 days less than 2017 Q147.4%36.7% 0 - 99,99911.7%2.1%0.8%1.0%0.3%0.0%4.6%390 in 2018 Q171301013.5Compared to 3.9 in 2017 Q1
from information which is the licensed property of, and copyrighted by, Houston Realtors Information Service, Inc. Texas Quarterly Houston-The Woodlands-Sugar Land MSA First quarter 2018. Compared to same quarter last year 150,000 Up 4 % Price Distribution 0 - 99,999 21.0%