Transcription
MIDTERM REVIEW INDU 421 (Fall 2013)Problem #1:A job shop has received on order for high-precision formed parts. The cost of producing eachpart is estimated to be 65,000. The customer requires that 8, 9 or 10 parts be supplied. Eachgood part sold will produce revenue of 100,000. However, if fewer than 8 good parts areproduced, the customer cannot use them for their original purpose, but can make use of somemajor components. In this case he agrees to buy all of them (good or bad) for the price of theproduction cost. The manufacturer however needs to make some adjustments on each part whichwill cost him 475 per part. If 8 or more good parts are produced, the customer will buy only thegood ones and will not make the purchase of the bad ones. If more than 10 good parts areproduced, the excess will not be purchased for any value. Based on the historical records, theprobability distributions have been estimated below. Determine the optimal batch size andexpected profit. For the quantities of 10, 11 and 12, determine the probability of losing money onthe transaction. Of these three choices, which one is most preferred?Probability mass 010.00060.0040.01930.06830.1720.29240.30120.144220
Q 475*Q65000*Q65000*QX 8X 8, 9 or 10X 10710x 0x 8E P(Q) (65000Q (65000Q 475Q) p( x) 100000 X 65000Q p( x) Q 100000 *10 65000Q p( x)x 11710Qx 0x 8x 11E P(Q) 475Q * p( x) 100000 X 65000Q p( x) 1000000 65000Q p( x)Net incomeProbability mass 720.29240.30120.144220
Expected LProbability of losing money if 7 or less parts are produced:1011120.17970.06940.024The most preferred Q:- if we want to earn most Q 11- if we don't want to lose money Q 12196296.4 205801.4 184189.6Problem #2:A market estimate for a product is 550,000 pieces. In order to produce the product threeoperations are required (A, B and C) having scrap estimates PA 0.03, PB 0.06 and PC 0.02.a) What is the total input into the production in order to satisfy the market?b) What is the production quantity scheduled for each operation?Solution:Input FinalOutpu t550000 615513(1 Ps1 )(1 Ps2 ).(1 Psn ) (1 0.03)(1 0.06)(1 0.02)a)Total input to satisfy the market is 615 512 units.
b)Process C:550000 561225(1 0.02)Process B:561225 597047(1 0.06)Process A:597048 615513(1 0.03)Production quantity scheduled for operation A is 615 513 units, for operation B it is 597 047units and for operation C it is 561 225 units.Problem #3:A part requires operations A and B on a milling machine. It was calculated that in order toproduce sufficient number of these parts to satisfy the demand, the production quantity of 5000parts per week should be scheduled. The milling machine requires tool changes and preventivemaintenance after every lot of 500 parts. These changes require 30 minutes. Find the number ofmachines required assuming that the company will be operating 5 days per week, 18 hours perday. The following information is known:Operation Standard time Efficiency ReliabilityA5 min95%85%B10 min95%90%Solution:Q 50005000/500 10 times per week maintenanceRepair time: 30min * 10 300 minAvailable time: 18hr *60*5 5400 minH 5400-300 5100 minA:F SQ / EHR (5*5000)/(0.95*5100*0.85) 6.07B:F SQ / EHR (10*5000)/(0.95*5100*0.9) 11.47Total number of machines needed 6.07 11.47 17.54Minimum of 18 machines are needed to ensure that weekly demand is met.
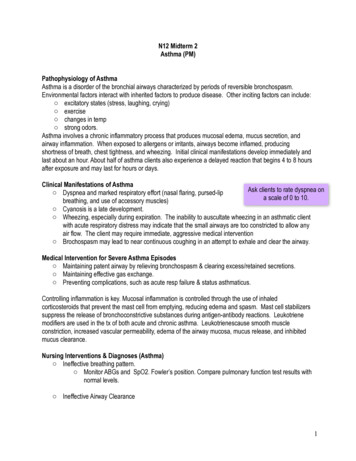
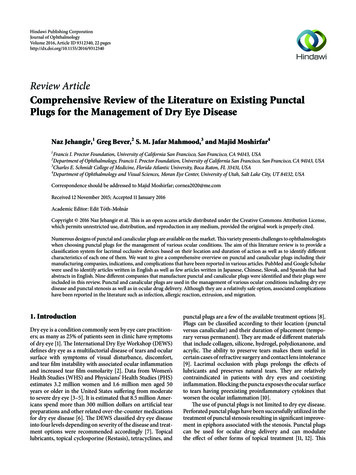
Problem #4:Multiple activity chart on the right shows theactivities of 3 identical machines and 1operator.a) Determine the length of independentmachine activity, independent operatoractivity and their concurrent activity.b) Estimate the minimum cycle length.a) Determine the ideal number ofmachines per operator.Solution:a) Concurrent activity: a 1 1 2Independent operator: b 0.5 0.5 1Independent machine: t 6b) Min cycle length is the maximum of:a t 2 6 8and3*(a b) 3* (2 1) 9Min cycle length is 9c) n’ (a t) /(a b) (2 6)/(2 1) 2.67L. LoadingT .WalkingUL UnloadingI&P Inspection & Packing
Problem #5:XYZ Inc. has a facility with six departments (A, B, C, D, E and F). A summary of the processingsequence for 10 products and the weekly production forecasts for the products are given in the tablebelow.a) Develop the From-To Chart based on the expected weekly productionb) Develop Relationship Diagram using Method II. Indicate the sequence in which the departmentsare placed into the diagram.c) Develop a block layout based on the given dimensionsProduct12345678910Processing BFABDECBFABCDFABDEFDepartmentABCDEFWeekly 00Dimensions (ft.xft.)40x4040x4030x3050x5060x6050x50Solution:a) From-To 40036009605160---
Frequency TableDepartment 8410312Ordered D4320BE3600CF3600AC18007DF960b) Development of relationship diagram – Method II.Relationship diagram worksheetAEIOUStep 1.AEIOUABBA,CD, FECCBEDFADEEB,CD,CFBFFB,ECDB is selected – more A relationshipsABBA,CD, FECCBEDFADEEB,CD,CFBFFB,ECDAEIOU
Step 2.AEIOUStep 3.AEIOUStep 4.AEIOUStep 5.AEIOUC is selected – more E relationshipsABBA,CD, FECCBEDFADEEB,CD,CFBFFB,ECDA is selected – A* with othersABBA,CD, FECCBEDFADEEB,CD,CFBFFB,ECDE is selected – E* with othersABBA,CD, FECCBEDFADEEB,CD,CFBFFB,ECDD is selected – EII with others (F has II*)ABBA,CD, FECCBEDFADEEB,CD,CFBFFB,ECD
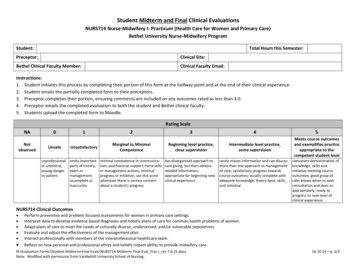
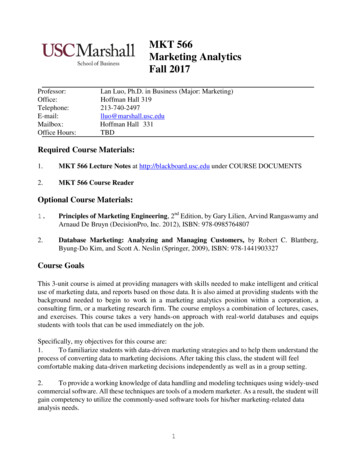
Step 6.AEIOUF is selectedABBA,CD, FECCBEDFASequence: B – C – A – E – D – FRelationship diagramStep 1:Step 2:Step 3:Step 4:DEEB,CD,CFBFFB,ECD
Step 5:Step 6:c) Block layoutDepartmentABCDEFDimensions (ft.xft.)40x4040x4030x3050x5060x6050x50BACDFE
Block layout for the diagram:CBAEDFAlternative block layout for the diagram:CDBAEF
Problem #6:A manufacturing facility produces 5 components. The components 1, 2 and 3 are of equivalentsize and weight. The component 4 is three times bigger and heavier than the components 1, 2 and3, whereas the component 5 is just half size of the components 1, 2 and 3. Facility includesdepartments A, B, C, D, E and F and the overall flow path is A-B-C-D-E-F. The quantities to beproduced and the routing for each component are given below. Develop a From-To Chart for thisfacility while taking the factor of ease of handling into consideration.Component :Component Productionquantity14002200310043005200AABB300 200 A-B-C-E-FA-B-C-D-E-FCD400400 300 200 900200100400 200 600EF400 300 700200 100 200 500200 300 200 700
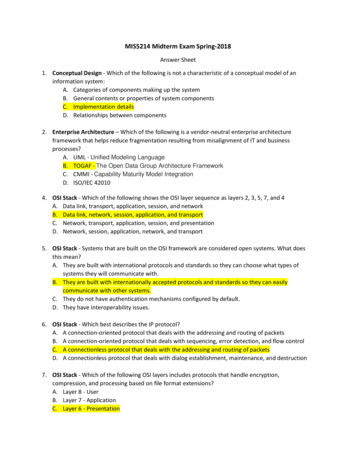
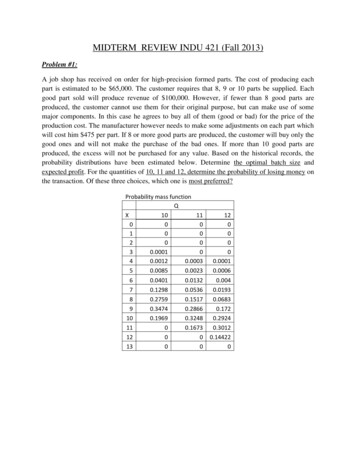
Question #7:Two layouts below have been recommended for a new facility. Evaluate them based onadjacency-based scorings and decide which one corresponds better to the requirements of thefacility, given the Relationship Chart below.a) Use these weights: A 64, E 16, I 4, O 1, U 0 and X -1024b) Use these weights: A 8, E 4, I 2, O 1, U 0 and X 8Layout 1:1043111761385212914Layout 2:4810133571296142111Relationship ID6IIEAID7IIID8 D9EOAOIID10 D11 D12 D13 D14OEOIOIUOEEUIIOEIUIIUOOOAUOO
Solution:m 1mmax z f ij xiji 1 j i 1a)Layout 1:1043111761385212914a) A 64, E 16, I 4, O 1, U 0 and X -1024b) A 8, E 4, I 2, O 1, U 0 and X 8D1 D2 D3 D4 D5 D6 D7 D8 D9 D10 D11 D12 D13 0D140024539D11D12IAUOOTotaladjacencyscore
Layout 2:4810133571296142111a) A 64, E 16, I 4, O 1, U 0 and X -1024b) A 8, E 4, I 2, O 1, U 0 and X 2UOOTotaladjacencyscoreLayout 1 corresponds better to the requirements of the facility based on the closeness valuesgiven in a)Layout 2 corresponds better to the requirements of the facility based on the closeness valuesgiven in b)
Question #8:Two layouts below have been recommended for a new facility. Evaluate them based ondistance-based scorings and decide which one corresponds better to the requirements of thefacility, given the Relationship Chart and the Distance Matrices for each of them below.From-To ChartD1D2 D3D1D4D5200D255D6D7 D81105539560D415065105D6D10 D11 D12 D13 50D14Distance matrix forD1D1D2D3D4D5D6D7D8D9D10D11D12D13D14D2 D3D4201002020Layout 1D5D6D7D8D9D10 D11 D12 D13 D14120606020801404010016018018060140 140 1004080140208040802002040201106020016020140 110 100 14018020401402018020040204040801801106012080140 01401202012011020801102001604040120160
Distance matrix -Layout 2D1D1D2D2 D3 D4 D5D6D7 D8 D935D10 D11 D12 D13 D5D6D7D8D9D10D11D12D1376D14mmmin z f ij cij dijSolution:i 1 j 1Flow-between ChartD1D1D2D2 D3D4D520055D6D7 D8D945110553D10 D11D12 0316515153
Cost matrix - Layout l cost327070Cost matrix-Layout 040D111779837059720076200D12D13D14Total cost205027285
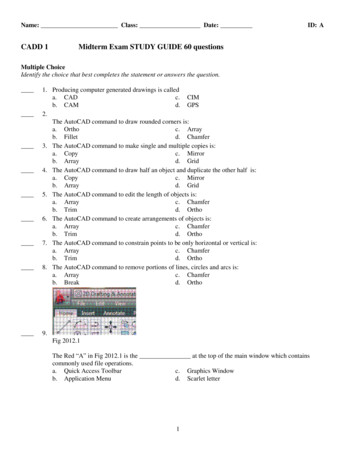
Total cost of Layout 2 is lower ( 205,027) than total cost of Layout 1 ( 327,070). Layout 2 corresponds better to the requirements of the facility.Problem #9:Create manufacturing cells based on the machine-part matrix below.a) Use Cluster Identification Algorithmb) Use Cost Analysis Algorithm. The maximum number of machines in one cell is 3.c) If conflicts or exceptional parts exist, propose alternative approaches.Solution:a) Cluster Identification AlgorithmP1M1P2P3P10 P11111111111111111M11P2P3P4P5P6P7P8P91111M4P10 1M4M5P51M2M3P411111
P1M1P2P31111111P2P3P4P5P6P7P8P91P10 111M4P10 P111M211111111M611111M7M8111M4M5111M2M3P10 1111
P1M1P2P31111111P2P3P4P5P6P7P8P91P10 111M4P10 P111M211111111M611111M7M8111M4M5111M2M3P10 1111
P1M1P2P31111111P2P3P4P5P6P7P8P91P10 111M4P10 P111M211111111M611111M7M8111M4M5111M2M3P10 1111
P1M1P2P3P7P8P9P10 P11111111111111M61111M7M8P61M4M5P51M2M3P411111All the machines and all the parts ended up in the same cell! This is not an efficient algorithm tosolve this problem.b) Cost Analysis Algorithm with the maximum number of 3 machines in one cellP1 P2 P31M1M2M31M41M51M6M7M81cost 22 15P61P7P8 P9 P10 P11111111111111111185 24P1 P2 P31M1M2M31M41M51M6M7M81cost 22 15P4 P53530P4 P5P61132 25 107P7P8 P9 P10 P11111111111111185 24171113530132 25 10717
P1 P2 P31M1M2M31M41M51M6M7M81cost 22 15P7P8 P9 P10 P11111111111111111185 243530P4 P5P61132 25 107P8 P9 P10 P1111111111117P7111111185 24P1 P2 P31M1M2M31M41M51M6M7M81cost 22 15P61P1 P2 P31M1M2M31M41M51M6M7M81cost 22 15P4 P53530P4 P5P61132 25 107P7P8 P9 P10 P11111111111111185 24171113530132 25 10717P2 addedP10 addedM1 added
P1 P2 P31M1M2M31M41M51M6M7M81cost 22 15P7P8 P9 P10 P11111111111111111185 243530P4 P5P61132 25 107P8 P9 P10 P11111111P9 is an exception11117P7111111185 24P1 P2 P31M1M2M31M41M51M6M7M81cost 22 15P61P1 P2 P31M1M2M31M41M51M6M7M81cost 22 15P4 P53530P4 P5P61132 25 107P7P8 P9 P10 P11111111111111185 241711135Cell #1: Machines M1, M4, M730132 25 10717
Parts: P2,P3 and P10P9 an exceptionP1 P4 P5 P6 P7 P8 P11M211M3111M511111M611M811cost 22 24 35 30 32 25 17P1 P4 P5 P6 P7 P8 P11M211M3111M511111M611M811cost 22 24 35 30 32 25 17P1 P4 P5 P6 P7 P8 P11M211M3111M511111M611M811cost 22 24 35 30 32 25 17P1 P4 P5 P6 P7 P8 P11M211M3111M511111M611M811cost 22 24 35 30 32 25 17
P1 P4 P5 P6 P7 P8 P11M211M3111M511111M611M811cost 22 24 35 30 32 25 17P1 P4 P5 P6 P7 P8 P11M211M3111M511111M611M811cost 22 24 35 30 32 25 17P7 addedP4 addedM2 addedP1 P4 P5 P6 P7 P8 P11M211M3111M511111M611M811cost 22 24 35 30 32 25 17P1 P4 P5 P6 P7 P8 P11M211M3111M511111M611M811cost 22 24 35 30 32 25 17P1 P4 P5 P6 P7 P8 P11M211M3111M511111M611M811cost 22 24 35 30 32 25 17P1 is an exception
P1 P4 P5 P6 P7 P8 P11M211M3111M511111M611M811co
good part sold will produce revenue of 100,000. However, if fewer than 8 good parts are produced, the customer cannot use them for their original purpose, but can make use of some major components. In this case he agrees to buy all of them (good or bad) for the price of the production cost. The manufacturer however needs to make some adjustments on each part which will cost him 475 per part .