Transcription
thPharmaSUG China 4 Conference, 2015Clinical trials optimization: Monte Carlo Simulation modeling and SASapplicationsYe Meng, PPD Inc., BeijingABSTRACTModeling and clinical trial simulation is a tool that is being used by pharmaceutical companies and FDAto improve the efficiency of drug development. Monte Carlo Simulation is a modern and computationallyefficient algorithm. Therefore it is a brilliant technique in terms of patient recruitment process and dosecalculation in clinical design. The purpose of this paper is to describe how Monte Carlo simulations aretasked with evaluating parameter distributions and its applications in PROC MI. Here we also describetwo approaches, BY command / Proc IML each with a presented example in SAS that leads to short andfast simulation programs that can be used in many practically situations.The SAS V9 products used in this paper are SAS BASE , SAS/STAT , and SAS/GRAPH on a PCWindows platform.INTRODUCTIONDrug development is not without risk, in fact many drug candidates are failing. Modeling and simulation isa risk management tool that could help to predict potential efficacy and safety outcome of clinical trials.The simulation explores how different trial designs will perform to detect expected drug effect. Fathermore, it shows the impact of differences of dose regiment, patient profile, sample size, drug durationunder a multitude of uncertainties[1]. In the context of available scientific data, this can assess andevaluate potential risks and outcomes of trials before making huge investments. Modeling and simulationcan be applied throughout the many phases of drug development. Therefore it can help provide guidancein decision making by quantifying and evaluating potential choices in clinical trials.Monte Carlo methods, are sampling techniques that draw pseudo-random samples from specifiedprobability distribution. In other words, Monte Carlo methods are numerical methods that utilizesequence numbers of random numbers to perform statistical simulations.[2]
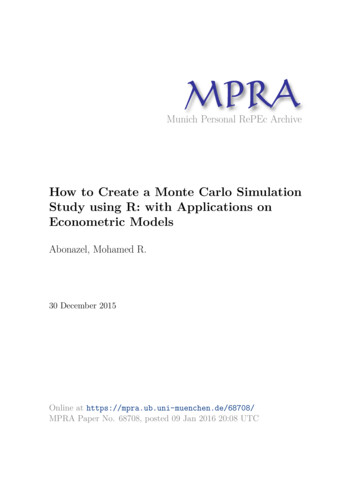
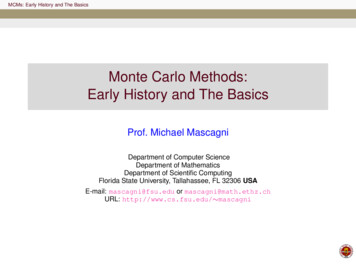
Figure 1. Clinical Trial Simulation (CTS) explores how different trial designs performance todetect the expected drug effect. Optimization including dose regiment, patient profile, samplesize, trial duration and current standard of care (SOC) of patients in clinical trial simulation.SIMULATING UNIVARIATE DATA IN DATA STEP:In Principle, the simulation progress includes the following steps:Step 1: Create a parametric model, y f(X1, X2, , Xq)Step 2: Generate a set of random inputs, Xj1, Xj2, , XjqStep 3: Evaluate the model and store the results as YjStep 4: Repeat steps 2 and 3 for i 1 to nStep 5: Analyze the results using histograms, summary statistics, confidence intervals.There are different ways of organizing simulations in SAS. Take simulating univariate data for a quickexample. A simple simulation might investigate the distribution of the sample mean of a sample of size 10that is drawn randomly from the normal distribution on [5, 3]. First approach shows how DATA stepestimates the mean 1000 times for sample size of 10 per iteration, as shown in the following example./* prevents log window from overflowing */options nonotes;/* set the parameters */%let N 10;%let NumSamples 1000;%let mu 5;%let sigma 3;%let seed 12345;/******BY STATMENT APPROACH *****/data Simulation(keep SampleID x);do SampleID 1 to &NumSamples;do i 1 to &N;/* 1. create many samples */‘x rand("Normal", &mu, &sigma);/* sample of size &N *//* X N(5, 3) */output;end;end;run;proc means data Simulation noprint;by SampleID;/* 2. compute many statistics */var x;output out OutStats mean SampleMean stderr se tm;run;proc univariate data OutStats;distribution of the statistics */histogram SampleMean;/* 3. analyze the sampling
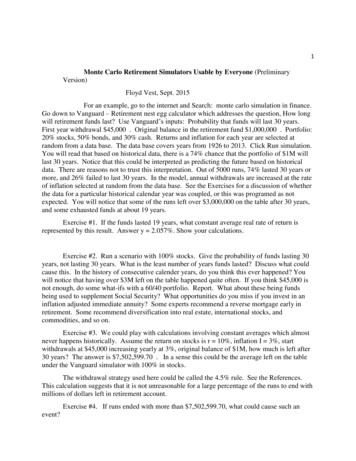
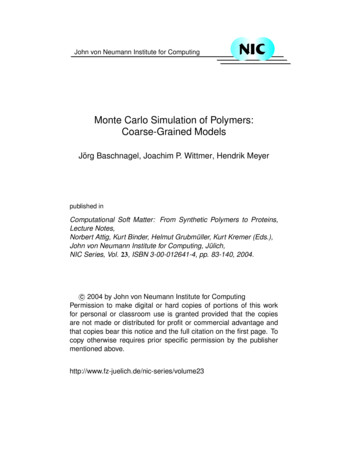
run;data summ;/* 4. summarizing calculation */file print;set OutStats end eof;retain coverage 0;coverage coverage SampleMean/&NumSamples;if eof then do;put 'coverage ' coverage 8.5;time time();put 'END BY PROCESSING:' time time 16.6;end;run;Note: The first step simulates one random sample with a Do Loop around. The second step is to computethe statistics for each sample. Then use BY statement in the procedure and performing statisticscalculation.The BY processing restructure the above simulation algorithm a little as the schema below:1. Simulate many random samples of size N from a statistical model.2. Compute a statistic for each sample.3. Examine the union of the statistics, which approximates the sampling distribution of the statistic andtells you how the statistic varies due to sampling variation.Result 1. Coverage mean and time on distribution X N(5, 3) after repeating 1000 timesThe Mean finally converges to 5.05619 after 1000 times sampling. The programs were run in SAS 9.2 oncomputer with 200 GHz processor and 2.00 GB of RAM, operating under Windows XP.SIMULATING UNIVARIATE DATA IN SAS/IML SOFTWARE:The SAS/IML language made the simulation steps simple and easy. The following sample code is anexample. [3]/******SIMULATING UNIVARIATE DATA IN SAS/IML *****/proc iml;call randseed(&seed);x j(1, &NumSamples);/* allocate vector or matrix */call randgen(x, "Normal", &mu, &sigma);The sample code calls two functions – RANDSEED, RANDGEN. The idea behind is to perform a fewmatrix computations on matrices and vectors that hold a lot of data. This is much more efficient thanlooping over data and performing many scalar computations. RANDGEN subroutine, rather than a DO
loop, is used similarly as RAND function to generate random samples, but it fills an entire matrix at onceand stores the simulated data in memory in the x vector.IMPUTING MISSING DATA USING PROC MI:Missing values are an issue in a substantial number of clinical analysis studies. Some subjects drop outfrom the study. Some data are missing due to patient illness or death, invalid measurement, orforgetfulness. A statistical analysis can be biased if incomplete cases are excluded from the analysis dueto the intent-to-treat (ITT) principle. The MI procedure performs the MCMC method for missing dataimputation, model parameter simulation, and model diagnostics, and to use SAS to perform a Bayesiananalysis of data commonly encounter in clinical trials. One may find more details in Scott D Patterson’spaper.[4] A clinical efficacy data set is used for this example. The data set contains 293 subjects with 3treatments. The variables are listed as follows:Variable NameDescriptionValid Valueresponsea derived ‘change from baseline’numeric valuevariablevisit5 levels of clinical visit4,6,8,12,16,20trt5 levels of treatment including a1 Dose A, 2 Dose B, 3 Dose C,placebo4 Dose D, 5 Dose E.sexsubject’s gender1 male, 2 femalerace4 levels of racial group1 white,2 blackorAfricanAmerican, 3 Asian, 4 Otherbasestandardized baseline valuenumeric valueagestandardized agenumeric valuesubjidsubject IDnumeric valueTable 1. Description of Sample Clinical DataUsually PROC MIXED procedure is selected for repeated measures analysis, but SAS MIXED procedureexcludes observations with any missing values from the analysis, which will affect the estimates.Suppose that the data are multivariate normally distributed and the missing data are missing at random.Thus PROC MI is necessary for filling arbitrary missing data to obtain more accurate estimates andresult.The following statements invoke the MI procedure and impute missing values using MCMC method.proc mi data eff out outmi seed 54321 nimpute 1000;mcmc impute monotone chain multiple;var trt base response;run;
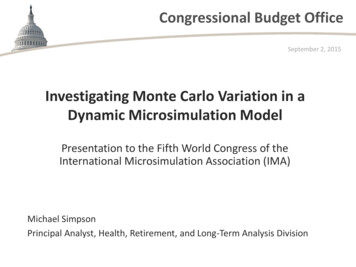
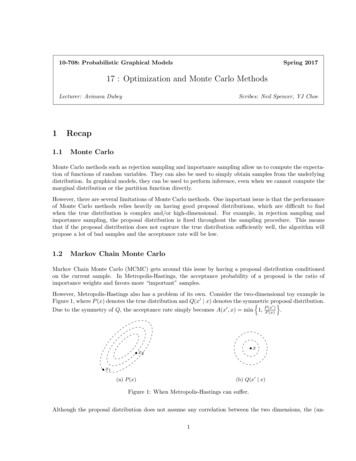
Output 1.1EM (Posterior Mode) EstimatesAbove table display the starting mean and covariance estimates used in each imputation. MonteCarlo Simulation (MCMC statement) use existing values as prior information to construct theimputed dataset(outmi). By default, the MI procedure uses the parameter estimates for aposterior mode, that is, the parameter estimates with the highest observed-data posteriordensity.In summary SAS MI procedure is very easy to use, only three SAS statements are needed. Itprovides two optional output datasets, for further analysis.CONCLUSIONBased on the three simulation/sampling methods we discussed above. DATA step BY-process ismost intuitive but time consuming, whereas SAS/IML language is compact and worthy use widely.MI procedure can do missing data imputation meanwhile provide the simulated estimators tohave the greatest chance of “success” in a clinical trial.REFERENCES[1] Melvin Munsaka. Using SAS for Modeling and Simulation in Drug Development – A Review andAssessment of Some Available Tools, 2011[2] Peter L. Bonate. Clinical Trial Simulation in Drug Development, 2000[3] SAS online document: SIMULATING DATA with SAS by Rick Wicklin, 2013[4] Scott D Patterson. SAS Markov Chain Monte Carlo (MCMC) Simulation in Practice, 2007CONTACT INFORMATIONYour comments and questions are valued and encouraged. Contact the author at:Name: Ye MengEnterprise: PPD Inc.Address: 25F, Raffles Bussiness Center, No. 1 Dongzhimen South Avenue,Dongcheng District, BeijingCity, State ZIP: Beijing, 100007Work Phone: 86(0) 10 5763 6125E-mail: Ye.Meng@ppdi.comWeb: www.ppdi.comSAS and all other SAS Institute Inc. product or service names are registered trademarks ortrademarks of SAS Institute Inc. in the USA and other countries. indicates USA registration.Other brand and product names are trademarks of their respective companies.
Clinical trials optimization: Monte Carlo Simulation modeling and SAS applications Ye Meng, PPD Inc., Beijing ABSTRACT Modeling and clinical trial simulation is a tool that is being used by pharmaceutical companies and FDA to improve the efficiency of drug development. Monte Carlo Simulation is a modern and computationally efficient algorithm.