Transcription
Ensemble Subsampling for Imbalanced Multivariate Two-SampleTestsLisha ChenDepartment of StatisticsYale University, New Haven,CT 06511email: lisha.chen@yale.eduWinston Wei DouDepartment of Financial EconomicsMIT, Cambridge, MA 02139email: wdou@mit.eduZhihua QiaoModel Risk and Model DevelopmentJPMorgan Chase, New York, NY 10172email: zhihua.qiao@gmail.com22 April 2013Author’s Footnote:Lisha Chen (Email: lisha.chen@yale.edu) is Assistant Professor, Department of Statistics, YaleUniversity, 24 Hillhouse Ave, New Haven, CT 06511. Winston Wei Dou (Email: wdou@mit.edu)is PhD candidate, Department of Financial Economics, MIT, 100 Main St, Cambridge,MA, 02139.Zhihua Qiao (Email: zhihua.qiao@gmail.com) is associate, Model Risk and Model Development,JPMorgan Chase, New York, 277 Park Avenue, New York, NY, 10172. The authors thank JosephChang and Ye Luo for helpful discussions. Their sincere gratitude also goes to three anonymousreviewers, an AE and the co-editor Xuming He for many constructive comments and suggestions.1
AbstractSome existing nonparametric two-sample tests for equality of multivariate distributions performunsatisfactorily when the two sample sizes are unbalanced. In particular, the power of these teststends to diminish with increasingly unbalanced sample sizes. In this paper, we propose a newtesting procedure to solve this problem. The proposed test, based on a nearest neighbor methodby Schilling (1986a), employs a novel ensemble subsampling scheme to remedy this issue. Morespecifically, the test statistic is a weighted average of a collection of statistics, each associated witha randomly selected subsample of the data. We derive the asymptotic distribution of the teststatistic under the null hypothesis and show that the new test is consistent against all alternativeswhen the ratio of the sample sizes either goes to a finite limit or tends to infinity. Via simulateddata examples we demonstrate that the new test has increasing power with increasing sample sizeratio when the size of the smaller sample is fixed. The test is applied to a real data example in thefield of Corporate Finance.Keywords: Corporate Finance, ensemble methods, imbalanced learning, Kolmogorov-Smirnovtest, nearest neighbors methods, subsampling methods, multivariate two-sample tests.2
1.INTRODUCTIONIn the past decade, imbalanced data have drawn increasing attention in the machine learning community. Such data commonly arise in many fields such as biomedical science, financial economics,fraud detection, marketing, and text mining. The imbalance refers to a large difference betweenthe sample sizes of data from two underlying distributions or from two classes in the setting ofclassification. In many applications, the smaller sample or the minor class is of particular interest.For example, the CoIL Challenge 2000 data mining competition presented a marketing problemwhere the task is to predict the probability that a customer will be interested in buying a specificinsurance product. However, only 6% of the customers in the training data actually owned the policy. A more extreme example is the well-cited Mammography dataset (Woods et al. 1994), whichcontains 10,923 healthy patients but only 260 patients with cancer. The challenge in learning fromthese data is that conventional algorithms can obtain high overall prediction accuracy by classifyingall data points to the majority class while ignoring the rare class that is often of greater interest.For the imbalanced classification problem, two main streams of research are sampling methods andcost-sensitive methods. He and Garcia (2009) provide a comprehensive review of existing methodsin machine learning literature.We tackle the challenges of imbalanced learning in the setting of the long-standing statisticalproblem of multivariate two-sample tests. We identify the issue of unbalanced sample sizes in thewell-known multivariate two-sample tests based on nearest neighbors (Henze 1984; Schilling 1986a)as well as in two other nonparametric tests. We propose a novel testing procedure using ensemblesubsampling based on the nearest neighbor method to handle the unbalanced sample sizes. Wedemonstrate the strong power of the testing procedure via simulation studies and a real dataexample, and provide asymptotic analysis for our testing procedure.We first briefly review the problem and existing works. Two-sample tests are commonly usedwhen we want to determine whether the two samples come from the same underlying distribution,which is assumed to be unknown. For univariate data, the standard test is the nonparametricKolmogorov-Smirnov test. Multivariate two-sample tests have been of continuous interest to thestatistics community. Chung and Fraser (1958) proposed several randomization tests. Bickel (1969)constructed a multivariate two-sample test by conditioning on the empirical distribution function3
of the pooled sample. Friedman and Rafsky (1979) generalized some univariate two-sample tests,including the runs test (Wald and Wolfowitz 1940) and the maximum deviation test (Smirnoff 1939),to the multivariate setting by employing the minimal spanning trees of the pooled data. Severaltests were proposed based on nearest neighbors, including Weiss (1960), Henze (1984) and Schilling(1986a). Henze (1988) and Henze and Penrose (1999) gave insights into the theoretical propertiesof some existing two-sample test procedures. More recently Hall and Tajvidi (2002) proposeda nearest neighbors-based test statistic that is particularly useful for high-dimensional problems.Baringhaus and Franz (2004) proposed a test based on the sum of interpoint distances. Rosenbaum(2005) proposed a cross-match method using distances between observations. Aslan and Zech (2005)introduced a multivariate test based on the energy between the observations in the two samples. Zuoand He (2006) provided theoretical justification for the Liu-Singh depth-based rank sum statistic(Liu and Singh 1993). Gretton et al. (2007) proposed a powerful kernel method for two-sampleproblem based on the maximum mean discrepancy.Some of these existing methods for multivariate data, particularly including the tests based onnearest neighbors, the multivariate runs test, and the cross-match test, are constructed using theinterpoint closeness of the pooled sample. The effectiveness of these tests assumes the two samplesto be comparable in size. When the sample sizes become unbalanced, as is the case in manypractical situations, the power of these tests decreases dramatically (Section 4). This near-balanceassumption has also been crucial for theoretical analyses of consistency and asymptotic power ofthese tests.Our new test is designed to address the problem of unbalanced sample sizes. It is built upon thenearest neighbor statistic (Henze 1984; Schilling 1986a), calculated as the mean of the proportionsof nearest neighbors within the pooled sample belonging to the same class as the center point.A large statistic indicates a difference between the two underlying distributions. When the twosamples become more unbalanced, the nearest neighbors tend to belong to the dominant sample,regardless of whether there is a difference between the underlying distributions. Consequently thepower of the test diminishes as the two samples become more imbalanced. In order to eliminatethe dominating effect of the larger sample, our method uses a subsample that is randomly drawnfrom the dominant sample and is then used to form a pooled sample together with the smaller4
sample. We constrain the nearest neighbors to be chosen within the pooled sample resulted fromsubsampling.Our test statistic is then a weighted average of a collection of statistics, each associated witha subsample. More specifically, after a subsample is drawn for each data point, a correspondingstatistic is evaluated. Then these pointwise statistics are combined via averaging with appropriateweights. We call this subsampling scheme ensemble subsampling. Our ensemble subsampling isdifferent from the random undersampling for the imbalanced classification problem, where onlyone subset of the original data is used and a large proportion of data is discarded. The ensemblesubsampling enables us to make full use of the data and to achieve stronger power as the databecome more imbalanced.Ensemble methods such as bagging and boosting have been widely used for regression andclassification (Hastie et al. 2009). The idea of ensemble methods is to build a model by combininga collection of simpler models which are fitted using bootstrap samples or reweighted samples ofthe original data. The composite model improves upon the base models in prediction stability andaccuracy. Our new testing procedure is another manifestation of ensemble methods, adapting to anovel unique setting of imbalanced multivariate two-sample tests.Moreover, we provide asymptotic analysis for our testing procedure, as the ratio of the samplesizes goes to either a finite constant or infinity. We establish an asymptotic normality result for thetest statistic that does not depend on the underlying distribution. In addition, we show that thetest is consistent against general alternatives and that the asymptotic power of the test increasesand approaches a nonzero limit as the ratio of sample sizes goes to infinity.The paper is organized as follows. In Section 2 we introduce notations and present the newtesting procedure. Section 3 presents the theoretical properties of the test. Section 4 providesthorough simulation studies. In Section 5 we demonstrate the effectiveness of our test using a realdata example. In Section 6 we provide summary and discussion. Proofs of the theoretical resultsare sketched in Section 7, and the detailed proofs are provided in the supplemental material.5
2.THE PROPOSED TESTIn this section, we first review the multivariate two-sample tests based on nearest neighbors proposed by Schilling (1986a) and discuss the issue of sample imbalance. Then we introduce ournew test which combines ensemble subsampling with the nearest neighbor method to resolve theissue. Lastly, we show how the ensemble subsampling can be adapted to two other nonparametrictwo-sample tests.We first introduce some notation. Let X1 , · · · , Xn and Y1 , · · · , Yñ be independent randomsamples in Rd generated from unknown distributions F and G, respectively. The distributions areassumed to be absolutely continuous with respect to Lebesgue measure. Their densities are denotedas f and g, respectively. The hypotheses of two-sample test can be stated as the null H : F Gversus the alternative K : F 6 G.We denote the two samples by X : {X1 , · · · , Xn } and Y : {Y1 , · · · , Yñ }, and the pooledsample by Z X Y. We label the pooled sample as Z1 , · · · , Zm with m n ñ where Xi ,if i 1, · · · , n;Zi Yi n , if i n 1, · · · , m.For a finite set of points A Rd and a point x A, let N Nr (x, A) denote the r-th nearestneighbor (assuming no ties) of x within the set A \ {x}. For two mutually exclusive subsets A1 , A2and a point x A1 A2 , we define an indicator function 1, if x Ai and N Nr (x, A1 A2 ) Ai , i 1 or 2Ir (x, A1 , A2 ) 0, otherwise.The function Ir (x, A1 , A2 ) indicates whether x and its r-th nearest neighbor in A1 A2 belong tothe same subset.2.1Nearest Neighbor Method and the Problem of Imbalanced SamplesSchilling (1986a) proposed a class of tests for the multivariate two-sample problem based on nearestneighbors. The tests rely on the following quantity and its generalizations:Sk,n"m k#1 XXIr (Zi , X, Y) . mki 1 r 16(1)
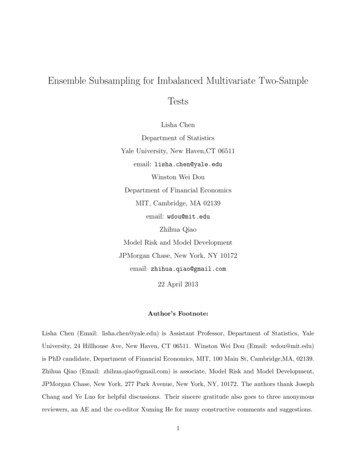
The test statistic Sk,n is the proportion of pairs containing two points from the same sample, amongall pairs formed by a sample point and one of its nearest neighbors in the pooled sample. IntuitivelySk,n is small under the null hypothesis when the two samples are mixed well, while Sk,n is largewhen the two underlying distributions are different. Under near-balance assumptions, Schilling(1986a) derived the asymptotic distribution of the test statistic under the null and showed thatthe test is consistent against general alternatives. The test statistic Sk,n was further generalized byweighting each point differently based on either its rank or its value in order to improve the powerof the test.We consider the two-sample testing problem when the two sample sizes can be extremely imbalanced with n ñ. We observe that the power of the test based on Sk,n diminishes dramaticallyas the two sample sizes become disparate. In Figure 1, we show the numerical study of the powerof the test for different sample size ratios and neighborhood sizes k in various simulation settingsdiscussed in Section 4. We observe that the power of the test decreases as the sample size ratioincreases while holding the size of X constant. This is obviously an undesirable property of thetest because the power of a test should ideally increase with sample size. The decrease in powerassociated with unbalanced sample sizes can also be observed in other two-sample tests such as therun test (Friedman and Rafsky 1979) and the cross-match test (Rosenbaum 2005) (Section 4). Thisphenomenon can be explained by the dominance of the larger sample in the common support of thetwo samples. More specifically for the test based on Sk,n , when the pooled sample Z is dominatedP Pby the sample Y, the summand over the sample X, ni 1 kr 1 Ir (Zi , X, Y), tends to be small, andPPkthe summand over the sample Y, mr 1 Ir (Zi , X, Y), tends to be large, under both the nulli n 1H and the alternative K. Therefore the test has weak power in detecting the difference betweenthe two underlying distributions.2.2Ensemble Subsampling for the Imbalanced Multivariate Two-Sample Test Based on NearestNeighborsIn order to solve the problem of unbalanced sample sizes, one could consider two simple approachesto balance the samples: one is to randomly subsample n points from Y to match the size of X,and the other is to oversample ñ points from X to match the size of Y. In the simple subsampling,a large proportion of data points are discarded and some data information is lost. In the simple7
10 4035 20 power25 30 power15power15 1520 10Model 3.1 q 1q 4q 16q 64 Model 2.12025Model 1.1 5510 13579152013579kModel 1.22520 205 0102020 60 1520 30power1015power60 15 99 77Model 3.2 55 33k 11power405080 4020Model 2.2 15k13579k15k20135791520kFigure 1: Simulation results representing the decreasing power of the original nearest neighbor test(1) as the ratio of the sample sizes q increases, q 1, 4, 16, 64. The two samples are generated fromthe six simulation settings in Section 4. Power is approximated by the proportion of rejections over400 runs of the testing procedure. A sequence of different neighborhood sizes k are used.oversampling, the data is augmented with repeated data points and the augmented data no longercomprises of an i.i.d. sample from the true underlying distribution. There is a large amount ofliterature in the area of imbalanced classification regarding subsampling, oversampling and theirvariations (He and Garcia 2009). More sophisticated sampling methods have been proposed toimprove the simple subsampling and oversampling methods, specifically for classification. However,there is no research on sampling methods for the two-sample test problem in the existing literature.We propose a new testing procedure for multivariate two-sample tests that is immune to theunbalanced sample sizes. We use an ensemble subsampling method to make full use of the data.The idea is that for each point Zi , i 1, · · · , m, a subsample is drawn from the larger sample Y andforms a pooled sample together with the smaller sample X. We then evaluate a pointwise statistic,8
the proportion of Zi ’s nearest neighbors in the formed sample that belong to the same sample asZi . Lastly, we take average of the pointwise statistics over all Zi ’s with appropriate weights. Morespecifically, for each Zi , i 1, · · · , m, let Si be a random subsample of Y of size ns , which mustSScontain Zi if Zi Y. By constructions Zi belongs to the pooled sample X Si , where X Si is ofsize n ns . The pointwise statistic regarding Zi is defined ask1XIr (Zi , X, Si ).tk,ns (Zi , X, Si ) kr 1The statistic tk,ns (Zi , X, Si ) is the proportion of Zi ’s nearest neighbors in XSSi that belong to thesame sample as Zi . The new test statistic is a weighted average of the pointwise statistics:Tk,ns" n#m1 X1 X tk,ns (Zi , X, Si ) tk,ns (Zi , X, Si )2nqi 1i n 1" n k#mk1 XX1 X X Ir (Zi , X, Si ) Ir (Zi , X, Si ) ,2nkqi 1 r 1(2)i n 1 r 1where q ñ/n is the sample size ratio.Compared with the original test statistic Sk,n (1), this test statistic has three new features.First and most importantly, for each data point Zi , i 1, · · · , m, a subsample Si is drawn from YSand the nearest neighbors of Zi are obtained in the pooled sample X Si . The size of subsample nsis set to be comparable to n to eliminate the dominating effect of the larger sample Y in the nearestneighbors. A natural choice is to set ns n, which is the case we focus on in this paper. Thesecond new feature is closely related to the first one, that is, a subsample is drawn separately andindependently for each data point and the test statistic depends on an ensemble of all pointwisestatistics corresponding to these subsamples. This is in contrast to the simple subsampling methodin which only one subsample is drawn from Y and a large proportion of points in Y are discarded.The third new feature is that we introduce a weighting scheme so that the two samples contributeequally to the test. More specially, we downweight each pointwise statistic tk,ns (Zi , X, Si ) for Zi Yby a factor of 1/q ( n/ñ) to balance the contributions of the two samples. The combination of thesethree features helps to resolve the issue of diminishing power due to the imbalanced sample sizes.We call our new test the ensemble subsampling based on the nearest neighbor method (ESS-NN).9
Effect of Weighting and Subsampling The weighting scheme is essential to the nice propertiesof the new test. Alternatively, we could weigh all points equally and use the following unweightedstatistic, i.e. the nearest neighbor statistic (NN) combined with subsampling without modification," n k#m XkXXX1u Tk,nIr (Zi , X, Si ) Ir (Zi , X, Si ) .smki 1 r 1i n 1 r 1uHowever our simulation study shows that, compared with Tk,ns , the unweighted test Tk,nis lesssrobust to general alternatives and to the choice of neighborhood sizes.In Figure 2, we compare the power of the unweighted test (Column 3, NN Subsampling)and the new (weighted) test (Column 4, ESS-NN) in three simulation settings (Models 1.2, 2.2,3.2 in Section 4), where the two samples are generated from the same family of distributions withdifferent parameters. Both testing procedures are based on the ensemble subsampling and thereforedifferences in results, if any, are due to the different weighting schemes. Note that the two statisticsbecome identical when q 1. The most striking contrast is in the middle row, representing the casein which we have two distributions generated from multivariate normal distributions differing onlyin scaling and the dominant sample has larger variance (Model 2.2). The test without weightinghas nearly no power for q 4, 16, and 64, while the new test with weighting improves on the powerconsiderably. In this case the pointwise statistics of the dominant sample can, on average, have muchlower power in detecting the difference between two distributions, and therefore downweightingthem is crucial to the test. For the other two rows in Figure 2, even though the unweighted testseems to do well for smaller neighborhood sizes k, the weighted test outperforms the unweighted testfor larger k’s. Moreover, for the weighted test, the increasing trend of power versus k is consistentfor all q in all simulation settings. In contrast, for the unweighted test, the trend of power versusk depends on q and varies in different settings.Naturally, one might question the precise role played by weighting alone in the original nearestneighbor test without random subsampling. We compare NN (Column 1) with NN Weighting(Column 2), without incorporating subsampling. The most striking difference is observed in themodel 2.2 and 3.2, where the power of the weighted test improves from the original unweighted NNtest. In particular, the power at q 4 is smaller than that at q 1 for the unweighted test butthe opposite is true for the weighted test. This again indicates that the pointwise statistics of the10
dominant sample on average have lower power in detecting the difference and downweighting themin the imbalanced case makes the test more powerful. However, weighting alone cannot correctthe effect of the dominance of the larger sample on the pointwise statistics, which becomes moreproblematic at larger q’s. We can see that the power of the test at q 16 and 64 is lower thanat q 4 for NN Weighting (Column 2). We can overcome this problem by subsampling fromthe larger sample and calculating pointwise statistics based on the balanced pooled sample. Therole played by random subsampling alone is clearly demonstrated by comparing NN Weighting(Column 2) and ESS-NN (Column 4).The Size of Random Subsample The size of subsample ns should be comparable to the smallersample size n so that the power of the pointwise statistics (and consequently the power of thecombined statistic) does not diminish as the two samples become increasingly imbalanced. Mostof the work in this paper is focused on the perfectly balanced case where the subsampling size nsis equal to n. As we will see in Section 3, the asymptotic variance formula of our test statisticis significantly simplified in this case. When ns 6 n, the probability of sharing neighbors will beinvolved and the asymptotic variance will be more difficult to compute. Hence, ns n seems to bethe most natural and convenient choice. However, it is sensible for a practitioner to ask whether nscan be adjusted to make the test more powerful. To answer this question, we perform simulationstudy for ns n, 2n, 3n, and 4n in the three multivariate settings (Models 1.2, 2.2, 3.2) consideredin Section 4. See Figure 3. The results show that ns n produces the strongest power on averageand ns 4n is the least favorable choice.2.3Ensemble Subsampling for Runs and Cross-matchThe unbalanced sample sizes is also an issue for some other nonparametric two-sample tests such asthe multivariate runs test (Friedman and Rafsky 1979) and the cross-match test (Rosenbaum 2005).In Section 4, we demonstrate the diminishing power of the multivariate runs test and the problemof over-rejection for the cross-match test as q increases. These methods are similar in that theirtest statistics rely on the closeness defined based on interpoint distances of the pooled sample. Thedominance of the larger sample in the common support of the two samples makes these tests lesspowerful in detecting potential differences between the two distributions.11
The idea of ensemble subsampling can also be applied to these tests to deal with the issue ofimbalanced sample sizes. Here, we briefly describe how to incorporate the subsampling idea intoruns and cross-match tests. The univariate runs test (Wald and Wolfowitz 1940) is based on thetotal number of runs in the sorted pooled sample where a run is defined as a consecutive sequenceof observations from the same sample. The test rejects H for a small number of runs. Friedmanand Rafsky (1979) generalized the univariate runs test to the multivariate setting by employing theminimal spanning trees of the pooled data. The analogous definition of number of runs proposed isthe total number of edges in the minimal spanning tree that connect the observations from differentsamples, plus one. By omitting the constant 1, we can re-express the test statistic as follows,m1XE (Zi , T (X Y)) ,2i 1where T (X Y) denotes the minimal spanning tree of the data X Y, and E(Zi , T (X Y)) denotesthe number of observations that link to Zi in T (X Y) and belong to the different sample fromZi . The 1/2 is a normalization constant because every edge is counted twice as we sum over theobservations. As in Section 2.2, let Si be a Zi associated subsample of size ns from Y, whichcontains Zi if Zi Y. Subsampling can be incorporated into the statistic by constructing theminimal spanning trees of the pooled sample formed by X and Si . The modified runs statistic withthe ensemble subsampling can be expressed as follows:#"mn1 X1 XE(Zi , T (X Si )) .E(Zi , T (X Si )) 2qi m 1i 1The cross-match test first matches the m observations into non-overlapping m/2 pairs (assumingthat m is even) so that the total distance between pairs is minimized. This matching procedureis called “minimum distance non-bipartite matching”. The test statistic is the number of crossmatches, i.e., pairs containing one observation from each sample. The null hypothesis would berejected if the cross-match statistic is small. The statistic can be expressed asm1XC(Zi , B(X Y)),2i 1where B(X Y) denotes the minimum distance non-bipartite matching of the pooled sample X Y,and C(Zi , B(X Y)) indicates whether Zi and its paired observation in B(X Y) are from different12
samples. Similarly the cross-match statistic can be modified as follows to incorporate the ensemblesubsampling:" n#m1 X1 XC(Zi , B(X Si )) C(Zi , B(X Si )) .2qi 1i n 1In this subsection we have demonstrated how the ensemble subsampling can be adapted to othertwo-sample tests to potentially improve their power for imbalanced samples. Our theoretical andnumerical studies in the rest of the paper remain focused on the ensemble subsampling based onthe nearest neighbor method.3.THEORETICAL PROPERTIESThere are some general desirable properties for an ideal two-sample test (Henze 1988). First, theideal test has a type I error that is independent of the distribution F . Secondly, the limitingdistribution of the test statistic under H is known and is independent of F . Thirdly, the ideal testis consistent against any general alternative K : F 6 G.In this section, we discuss these theoretical properties of our new test in the context of imbalanced two-sample tests with possible diverging sample size ratio q. As we mentioned in Section2.2, we focus on the case in which the subsample is of the same size as the smaller sample, that is,ns n. In the first theorem, we establish the asymptotic normality of the new test statistic (2)under the null hypothesis, which does not depend on the underlying distribution F , and we provideasymptotic values for mean and variance. In the second theorem, we show the consistency of ourtesting procedure.We would like to emphasize that our results include two cases, in which the ratio of the samplesizes q(n) ñ/n goes to either a finite constant or infinity as n . Let λ be the limit of thesample size ratio, λ limn q(n), with λ and λ representing the two cases respectively.The asymptotic power of the new testing procedure can be measured by an efficacy coefficient. Weshow that this coefficient increases as λ becomes larger, and approaches a nonzero limit as λ tendsto infinity. This is in contrast to the original test based on Sk,n (1) whose efficacy coefficientdecreases to zero as λ goes to infinity. In the following, we first present the asymptotic mean andvariance of our test statistic. In order to derive these quantities, we introduce three types of mutualand shared neighbors probabilities, and then derive two propositions regarding their relationship.13
3.1Mutual and Shared NeighborsWe consider three types of events characterizing mutual neighbors. All three types are needed herebecause the samples X and Y play asymmetric roles in the test and therefore need to be treatedseparately.(i) mutual neighbors in X : N Nr (Z1 , X S1 ) Z2 , N Ns (Z2 , X S2 ) Z1 ;(ii) mutual neighbors in Y : N Nr (Zn 1 , X Sn 1 ) Zn 2 , N Ns (Zn 2 , X Sn 2 ) Zn 1 ;(iii) mutual neighbors between X and Y : N Nr (Z1 , X S1 ) Zn 1 , N Ns (Zn 1 , X Sn 1 ) Z1 .Similarly we consider three types of events indicating neighbor-sharing:(i) neighbor-sharing in X : N Nr (Z1 , X S1 ) N Ns (Z2 , X S2 );(ii) neighbor-sharing in Y : N Nr (Zn 1 , X Sn 1 ) N Ns (Zn 2 , X Sn 2 );(iii) neighbor-sharing between X and Y : N Nr (Z1 , X S1 ) N Ns (Zn 1 , X Sn 1 ).The null probabilities for the three types of mutual neighbors are denoted by px,1 (r, s), py,1 (r, s),and pxy,1 (r, s) and those for neighbor-sharing are denoted by px,2 (r, s), py,2 (r, s), and pxy,2 (r, s).The following two propositions describe the values of these probabilities for large samples.Proposition 1. We have the following relationship between the null mutual neighbor probabilities,p1 (r, s) : lim npx,1 (r, s) lim q(n)npxy,1 (r, s) lim q(n)2 npy,1 (r, s),n n n where the analytical form of limit p1 (r, s) (4) is given at the beginning of Section 7.The proof is given in Section 7. The relationship between the mutual neighbor probabilitiespxy,1 and px,1 can be easily understood by noting that pxy,1 involves the additional subsamplingof Y, and the probability of Zi (i n 1 · · · m) being chosen by subsampling is 1/q(n). Similararguments apply to py,1 and pxy,1 . The limit p1 (r, s) depends on r and s, as well as the dimensiond and the limit of sample size ratio λ. λ 1 is a special case of Schilling (1986a), where there isno subsampling involved and the three mutual neighbor probabilities are all equal. With λ 1,14
subsampling leads to the new mutual neighbor probabilities. Please note that n here is the sizeof X, rather than the size of the pooled sample Z. Therefore our limit p1 (r, s) ranges fro
MIT, Cambridge, MA 02139 email: wdou@mit.edu Zhihua Qiao . New Haven, CT 06511. Winston Wei Dou (Email: wdou@mit.edu) is PhD candidate, Department of Financial Economics, MIT, 100 Main St, Cambridge,MA, 02139. Zhihua Qiao (Email: zhihua.qiao@gmail.com) is associate, Model Risk and Model Development, . marketing, and text mining. The .