Transcription
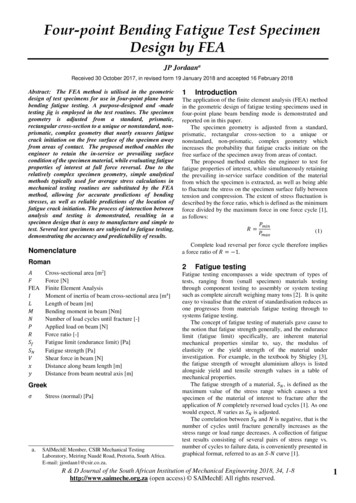
Four-point Bending Fatigue Test SpecimenDesign by FEAJP JordaanaReceived 30 October 2017, in revised form 19 January 2018 and accepted 16 February 2018Abstract: The FEA method is utilised in the geometricdesign of test specimens for use in four-point plane beambending fatigue testing. A purpose-designed and -madetesting jig is employed in the test routines. The specimengeometry is adjusted from a standard, prismatic,rectangular cross-section to a unique or nonstandard, nonprismatic, complex geometry that nearly ensures fatiguecrack initiation on the free surface of the specimen awayfrom areas of contact. The proposed method enables theengineer to retain the in-service or prevailing surfacecondition of the specimen material, while evaluating fatigueproperties of interest at full force reversal. Due to therelatively complex specimen geometry, simple analyticalmethods typically used for average stress calculations inmechanical testing routines are substituted by the FEAmethod, allowing for accurate predictions of bendingstresses, as well as reliable predictions of the location offatigue crack initiation. The process of interaction betweenanalysis and testing is demonstrated, resulting in aspecimen design that is easy to manufacture and simple totest. Several test specimens are subjected to fatigue testing,demonstrating the accuracy and predictability of oss-sectional area [m2]Force [N]Finite Element AnalysisMoment of inertia of beam cross-sectional area [m4]Length of beam [m]Bending moment in beam [Nm]Number of load cycles until fracture [-]Applied load on beam [N]Force ratio [-]Fatigue limit (endurance limit) [Pa]Fatigue strength [Pa]Shear force in beam [N]Distance along beam length [m]Distance from beam neutral axis [m]𝜎𝜎Stress (normal) [Pa]Greeka.SAIMechE Member, CSIR Mechanical TestingLaboratory, Meiring Naudé Road, Pretoria, South Africa.E-mail: jjordaan1@csir.co.za.1IntroductionThe application of the finite element analysis (FEA) methodin the geometric design of fatigue testing specimens used infour-point plane beam bending mode is demonstrated andreported on in this paper.The specimen geometry is adjusted from a standard,prismatic, rectangular cross-section to a unique ornonstandard, non-prismatic, complex geometry whichincreases the probability that fatigue cracks initiate on thefree surface of the specimen away from areas of contact.The proposed method enables the engineer to test forfatigue properties of interest, while simultaneously retainingthe prevailing in-service surface condition of the materialfrom which the specimen is extracted, as well as being ableto fluctuate the stress on the specimen surface fully betweentension and compression. The extent of stress fluctuation isdescribed by the force ratio, which is defined as the minimumforce divided by the maximum force in one force cycle [1],as follows:𝑃𝑃𝑚𝑚𝑚𝑚𝑚𝑚𝑅𝑅 (1)𝑃𝑃𝑚𝑚𝑚𝑚𝑚𝑚Complete load reversal per force cycle therefore impliesa force ratio of 𝑅𝑅 1.2Fatigue testingFatigue testing encompasses a wide spectrum of types oftests, ranging from (small specimen) materials testingthrough component testing to assembly or system testingsuch as complete aircraft weighing many tons [2]. It is quiteeasy to visualise that the extent of standardisation reduces asone progresses from materials fatigue testing through tosystems fatigue testing.The concept of fatigue testing of materials gave cause tothe notion that fatigue strength generally, and the endurancelimit (fatigue limit) specifically, are inherent materialmechanical properties similar to, say, the modulus ofelasticity or the yield strength of the material underinvestigation. For example, in the textbook by Shigley [3],the fatigue strength of wrought aluminium alloys is listedalongside yield and tensile strength values in a table ofmechanical properties.The fatigue strength of a material, 𝑆𝑆𝑁𝑁 , is defined as themaximum value of the stress range which causes a testspecimen of the material of interest to fracture after theapplication of 𝑁𝑁 completely reversed load cycles [1]. As onewould expect, 𝑁𝑁 varies as 𝑆𝑆𝑁𝑁 is adjusted.The correlation between 𝑆𝑆𝑁𝑁 and 𝑁𝑁 is negative, that is thenumber of cycles until fracture generally increases as thestress range or load range decreases. A collection of fatiguetest results consisting of several pairs of stress range vs.number of cycles to failure data, is conveniently presented ingraphical format, referred to as an 𝑆𝑆-𝑁𝑁 curve [1].R & D Journal of the South African Institution of Mechanical Engineering 2018, 34, 1-8http://www.saimeche.org.za (open access) SAIMechE All rights reserved.1
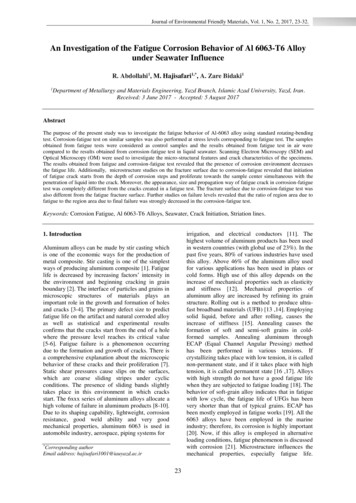
Four-point Bending Fatigue Test Specimen Design by FEAAs an example, the 𝑆𝑆-𝑁𝑁 curve of normalised SAE 4130chrome-moly steel is constructed in figure 1 from test datacontained in NACA Technical Note 3866 [4].Fatigue strength SN[MPa]900S-N curve of SAE 4130 (normalised)S 831800ufour-point plane beam bending, supported at two outer pointsand loaded at two inner points (the test specimen residesbetween the two inner loading points).Let 𝑃𝑃 denote the total applied load and 𝐿𝐿 denote theoverall length of the beam, then the shear force and bendingmoment diagrams of a symmetrically loaded beam, dividedinto thirds, can be constructed as shown in figure 2.700P/2P/2600500L/3L/3L/3400P/2300200010Figure 1P/2P/2246101010Number of stress cycles, N8100V(x)S-N curve of SAE 4130 chrome-moly steel(normalised)-P/2PL/6Due to the exponential nature of the 𝑆𝑆-𝑁𝑁 relationship,results are typically plotted on a log scale for number ofcycles, and often for stress amplitude as well. It is noted thatthe left-most data point in figure 1 represents the tensilestrength result of a static tensile test.In the case of steel, furthermore, it is observed that thenegative correlation between 𝑆𝑆𝑁𝑁 and 𝑁𝑁 ceases to exist at acritical stress range below which it can be declared that aninfinite number of load cycles can be applied withoutspecimen fracture. This critical stress range is defined as thefatigue limit (𝑆𝑆𝑓𝑓 ) of the material [1]. The fatigue limit of thesteel tested in figure 1 appears to be slightly larger than300 MPa, but smaller than 350 MPa.The difficulty with fatigue strength as a mechanicalproperty seems to be the amount of variability or scatterpresent in the test data. Schijve [5] furthermore states that thedistribution function of the endurance limit is unknown. Thenatural consequence of this scatter is that fatigue testingrequires many more test specimens than, say, tensile testing,in order to arrive at useful and sound conclusions from astatistical point of view.The rotating beam fatigue testing machine is commonlyused for generating the required large amount of materialfatigue test data [2].2.1Rotating beam fatigue testingRotating beam fatigue testing is a simple, accurate, fast andcost effective method employed for fatigue testing ofengineering materials. The frequency of load cycling istypically twice as large as that attainable with servo-hydraulicequipment.The mechanical design of a rotating beam testing machineis such that the test specimen assembly resembles a horizontalbeam structure that can be loaded by vertical forces in oneplane. This beam is allowed to deflect or bend in the planeonly, and by rotating the specimen assembly through thevertical plane of bending, stresses that fluctuate fully betweencompression and tension are induced in the specimen.Specifically, the arrangement of applied forces isdesigned to ensure a symmetrically loaded beam in a state ofM(x)xFigure 2Free-body, shear force, and bending momentdiagrams for a simply supported beam in four-pointbending modeFrom figure 2 one observes that the maximum bendingmoment (𝑃𝑃𝑃𝑃/6) is present and uniform in the centre third ofthe beam. This region of the beam also experiences purebending, that is shear forces are absent, as can be seen fromthe shear force diagram. The bending moment in the beaminduces bending stresses in the beam material. These bendingstresses are typically of prime interest to the test engineer, andcan be calculated from the well-known flexure formula [6].𝑀𝑀𝑀𝑀𝜎𝜎 (2)𝐼𝐼From the flexure formula it is evident that the calculatedstress is a function of the bending moment (𝑀𝑀), verticaldistance (𝑦𝑦) of the point of interest from the beam neutralaxis, and the moment of inertia (𝐼𝐼) of the beam cross-sectionalarea about the appropriate transverse axis that intersects theneutral axis. It is further evident that, for a cross-section at aparticular location on the beam neutral axis, the stress ismaximum when 𝑦𝑦 is maximised, that is, the maximum stress(tensile or compressive) is located on the beam surface.It goes without saying that the test specimen is theweakest part of the (rotating) beam. The specimen isdeliberately machined into a characteristic dog-bone orhourglass shape on a lathe. In this way, the region ofmaximum bending stress is shifted to precisely the centre ofthe specimen where the diameter of the specimen is thesmallest. The geometric transitions on the specimen are alsovery gradual in order to eliminate stress concentrations, sothat the actual maximum stress corresponds well with thecalculated maximum stress according to equation (2).The disadvantage, however, of rotating beam testing, forthe purpose of the work presented here, is the inability toretain the prevailing surface condition of the structure fromR & D Journal of the South African Institution of Mechanical Engineering 2018, 34, 1-8http://www.saimeche.org.za (open access) SAIMechE All rights reserved.2
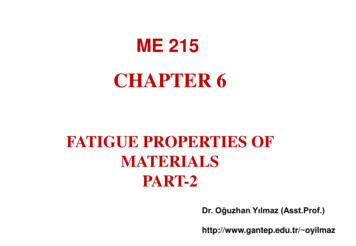
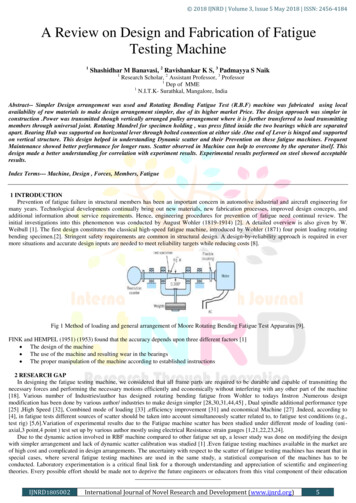
Four-point Bending Fatigue Test Specimen Design by FEAwhich the specimen is extracted. It is thus not possible toinvestigate the effect of actual surface condition on fatiguelife while simulating actual, fully reversed, load cyclesexperienced by the structure.2.2Four-point bending fatigue testingAlthough rotating beam fatigue testing is in fact four-pointbending, reference to four-point bending fatigue testing isunderstood to mean testing in a servo-hydraulic testingmachine with a vertical load-line.The specimen in four-point bending fatigue testingconstitutes the entire beam, which means that the bendingmoment and shear force vary in the longitudinal direction ofthe specimen (recall that the rotating beam specimen is onlypart of the centre section of the beam, being in a state ofconstant pure bending). The specimen also does not rotateduring testing, hence the specimen is constructed to obtainflat surfaces which help to stabilise the orientation of thespecimen with respect to the testing machine. The crosssection of a specimen employed in four-point bending isrectangular in shape.It appears that four-point bending is not often employedin fatigue testing of metals, especially when full forcereversal is required. Instead, four-point bending is used tocharacterise the flexure properties of non-metallic materials,as described in ASTM D6272 [7].Various configurations are possible to achieve four-pointbending in a vertical load-line machine. Zhai et al. [8]describe the application of a four-point bending fatiguetesting rig used to test for fatigue properties of an Al-Li alloymaterial, but only by loading in one direction (that is 𝑅𝑅 0.1). They listed several apparent advantages of four-pointbending, and also mentioned that a standard for four-pointbending fatigue testing is not available (in 1999), causingspecimen geometry to differ among mechanical testinglaboratories.Hassan and Liu [9] highlight the differences in fatiguestrengths obtained from rotating bending, four-point bending,and cantilever bending tests of stainless steel pipe specimens,which they attribute to differences in strain ranges for equalstress ranges. While all three testing methods are analysed byFEA, only rotating bending tests are actually performed.Four-point bending fatigue testing results of aerospacegrade steel are also reported by Baxter et al. [10]. Once again,loads were applied at a force ratio of 𝑅𝑅 0.1. Their focuswas detection of crack growth by means of acoustic emissiontechniques, which required a rectangular shaped specimenthat enabled the mounting of sensors at various distancesfrom the crack location.Fatigue testing results of forged titanium alloy Ti-6Al-4Vin four-point bending mode are reported by Oberwinkler etal. [11]. A testing jig was developed with the aid of FEA andloads were applied at a force ratio of 𝑅𝑅 1. The frequencyof load application appear to be quite high, as mention wasmade of a resonant machine, and up to 107 load cycles wereapplied to specimens. The effect of surface condition, that isas-forged vs. machined, was investigated.For the current work, a purpose-designed testing jig ismanufactured because of the unique requirements for fatiguetesting in a full force-reversal mode, as well as the ability toretain the prevailing surface condition of the specimenmaterial.2.2.1Testing jigA photograph of the installed testing jig is displayed infigure 3.Figure 3Photograph of installed testing jigThe testing jig comprises of four u-sections that containthe smaller jig components. These components are eightshafts of 25 mm diameter (ground surface) that interface withthe specimen (machined surface). The shaft-ends are allowedto rotate inside 16 needle roller bearings in order to facilitaterolling motion between the shafts and the specimen surfaceduring force actuation while minimising relative slidingbetween the surfaces.The needle roller bearings are fitted into 16 eccentric ringswhich, in turn, are fitted in the u-sections. The eccentric ringscan rotate in the u-sections. The eccentric rings are alsoactuated in pairs by mating rack gears, the positions of whichare adjusted by set screws. By adjusting the set screws, theracks are translated, thereby rotating the pair of eccentrics viathe meshed gear teeth, causing the centrelines of paired shaftsto either close in or drift out. In this way all shafts areadjusted until intimate contact with the specimen is attained,allowing for force reversal in a smooth and controlled mannerthat minimises the disturbance to the control system of thetesting machine. The testing jig therefore enables fatiguetesting with a force ratio of 𝑅𝑅 1.The testing jig interfaces with a Schenk servo-hydraulictesting machine of capacity 250 kN operational in the lab.The jig is structurally able to carry an externally applied totalforce of 150 kN maximum.2.2.2 Test specimen standard geometryThe standard specimen geometry is a prismatic bar with arectangular cross-section of nominal width 20 mm andnominal height 40 mm. The distance between the outer beamsupports, that is the length 𝐿𝐿 in figure 2, is 210 mm.The testing jig displayed in figure 3 accepts a rectangularcross-section specimen of width between 10 and 25 mm,height between 39 and 41 mm, and length between 230 andR & D Journal of the South African Institution of Mechanical Engineering 2018, 34, 1-8http://www.saimeche.org.za (open access) SAIMechE All rights reserved.3
Four-point Bending Fatigue Test Specimen Design by FEA276 mm. While the bending moment only depends on theloading arrangement (loading sizes and positions), themoment of inertia depends on the specimen cross-sectiononly, bearing in mind that the maximum vertical distancefrom the neutral axis is for practical purposes constant (thetesting jig allows for specimen height variation between 39and 41 mm).Changes or variation in the moment of inertia along thespecimen neutral axis cause variation in the stress distributionin the specimen. In particular, the specimen cross-sectioncould conceivably be modified or designed in such a way thatthe maximum surface stress is located in a preferred regionof the specimen. This process is explored further below.2.2.3 Contact and frettingThe basic disadvantage of a four-point bending arrangementis the regions of contact between the testing machine/jig andthe test specimen. Stresses induced in these areas by contactcan only be accurately calculated or measured with greatdifficulty, which means that a test result is unreliable iffracture occurs in a region where contact exists.A specimen that bends causes regions in the beam toexperience tension stresses and other regions to experiencecompressive stresses. Tension and compression regions areseparated by the neutral plane. In the case of static testingwhere the surface in tension is of interest, a reliable test resultcan readily be recorded because the points of contact resideon the surface in compression (the opposite surface). If,however, the surface in compression is of interest, a problemarises because of contact due to specimen loading.In the case of dynamic testing (with a view to evaluatematerial fatigue properties, often simply referred to as fatiguetesting) at a force ratio of 𝑅𝑅 1, the contact problemremains acute because fatigue cracks are likely to originateprecisely in these regions of contact. This may happen owingto fretting between the jig rollers and the specimen surface onthe lines of contact, or because of local plastic deformation(indentation) of the specimen material on the lines of contact.Nevertheless, it was desired to develop a test method that isindependent of special lubrication requirements or the needfor shimming between surfaces in contact.3Analysis and fatigue test resultsStress analysis is necessary in order to provide force targetvalues during testing. Simple analytical models or equationsare utilised because standard specifications on specimengeometry are followed. The calculation for average normalstress for a bar in tension, 𝜎𝜎 𝐹𝐹/𝐴𝐴, is well-known andregularly used in tensile testing.Deviation from standard specimen geometry requirescaution, because the maximum stress in a specimen maydeviate significantly from the average stress calculated by thesimple equation. Stress analysis by FEA, however, solvesthis problem efficiently, and the author believes that muchmore information can presently be inferred from mechanicaltesting by duplication of the test set-up in FEA.3.1Specimen material propertiesAluminium alloy 6082-T6 is a medium strength structuralalloy available in 20 mm plate, and is the alloy mostcommonly used for machining [12].The material properties of the alloy are listed in table 1[12],[13].Table 1Material properties of specimen materialPropertyDensityElasticity (Young’s modulus)Poisson’s ratioYield strengthUltimate tensile strengthElongation at Standard test specimen geometry3.2.1 Stress calculationIn order to ensure fatigue fracture within a reasonable (froma testing time point of view) number of cycles ( 106 ), atarget maximum stress of at least 60% of yield stress isselected, that is 156 MPa. Substitution into the flexureformula, equation (2), yields𝑀𝑀 𝜎𝜎𝜎𝜎 𝜎𝜎𝜎𝜎ℎ3 156(20)(403 ) 40𝑦𝑦12𝑦𝑦12 2(3) 𝑀𝑀 832 [kN.mm]From figure 2 the peak force is calculated as𝑃𝑃 6𝑀𝑀 6(832) 𝐿𝐿210 𝑃𝑃 23.8 [kN](4)Based on this result, a slightly higher force amplitude of25 kN is selected for the fatigue test. This increase in forceraises the peak stress to 164 MPa (calculated from eq. (2)).3.2.2 FEA resultTwo planes of symmetry intersect the load line of themachine at right angles to each other. One of these is utilisedsuch that only one half of the jig/specimen assembly ismodelled as solids in the FEA software [14], as shown by themeshed model displayed in figure 4.The jig structures are also modelled due to a simultaneousrequirement to assess the strength of the jig, determined at150 kN stated in section 2.2.1.A vertical load of -12.5 kN (in the y-direction as definedin figure 4) is applied to the left hand side of the jig model,which is also constrained to allow movement in the ydirection only. The right hand side section is fixed in space.A contact formulation is defined between the cylindricalshaft surfaces and the specimen surfaces. An exponentialpressure is defined for contact normal to the surfaces, whilefrictionless tangential behaviour is selected.The specimen is meshed by 13091 quadratic hexahedralelements of type C3D20. The bending stress contours in thespecimen at equilibrium conditions are displayed in figure 5in two dimensions.A maximum tension stress of 166 MPa is recorded on thebottom surface of the specimen, while the maximumR & D Journal of the South African Institution of Mechanical Engineering 2018, 34, 1-8http://www.saimeche.org.za (open access) SAIMechE All rights reserved.4
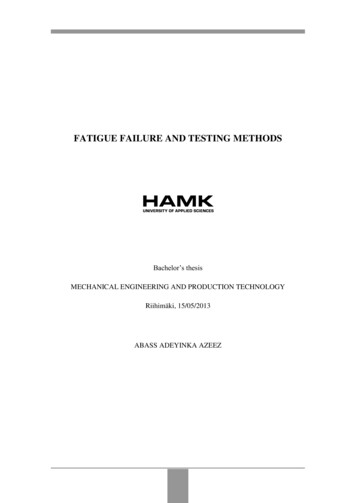
Four-point Bending Fatigue Test Specimen Design by FEAcompressive stress due to bending is 161 MPa (not indicatedin the figure).Strain vs. Force3000Strain thandsideFE model of half the jig/specimen assemblyThe maximum compressive stress due to the combinationof bending and contact is given as 352 MPa, as shownbeneath the shaft, although this number is quite dependent onthe specifics of the contact formulation and not considered tobe accurate.There is good agreement between the stress calculation ofsection 3.2.1 of 164 MPa (both tension and compression) andthe FEA results of 161 MPa compression and 166 MPatension.1020Table 2Strain gauge extreme data points30Force [kN]Strain [µm/m]-27.327.22384-2328Assuming a linear relationship between force and strain,one can interpolate between the above two sets of data pointsfor the estimated strain at 25 and -25 kN. The stress estimatesare subsequently calculated employing the modulus ofelasticity (which is used in the linear elastic FEA as well), asshown in table 3.Force[kN]-25.025.0Standard specimen bending stress contours0Force [kN]Standard specimen strain gauge resultTable 3Figure 5-10Figure 6SpecimenFigure 4-20Estimated strain and stress at 25 kN forceStrain[µm/m]2183-2140Stress (𝜎𝜎 𝐸𝐸𝐸𝐸)[MPa]153150Stress (FEA)[MPa]164161The difference between the measured and computedstrains (and hence stresses) of about 7% can be attributed tothe specifics of the contact formulation between the jig andthe specimen. The FEA assumes frictionless contact betweenthe shafts and the specimen, while a specified frictioncoefficient between these bodies of 0.1 reduces the solvedstrains to within 1.5% of the measured values listed in table 3.Upon invoking the fatigue routine, the data of the first fewforce cycles is recorded and displayed in figure 7. The forceamplitude is 25 kN, the mean force is 0 kN, and the initialfrequency is 1 Hz (the frequency is subsequently raised to 5Hz in order to speed-up the test).Force history30Force [kN]203.2.3 Test resultsIn order to verify calculated strain and stress againstmeasured quantities, a strain gauge is attached to the surfaceof the specimen, right in the middle, measuring the strain inthe z-direction defined in figure 4.The strain results as a function of total applied force(which is varied across the complete range of interest) aredisplayed in figure 6. From the graph it is evident that therelationship between the applied force and the measuredstrain is linear, and that it runs through the zero point.The values at the two extreme data points in figure 6 arelisted in table 2.100-10-20-300Figure 751015Time [s]2025Standard specimen force cyclesR & D Journal of the South African Institution of Mechanical Engineering 2018, 34, 1-8http://www.saimeche.org.za (open access) SAIMechE All rights reserved.5
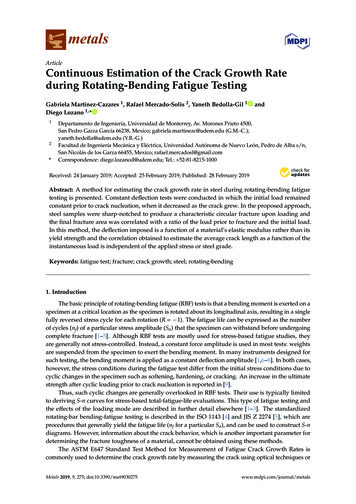
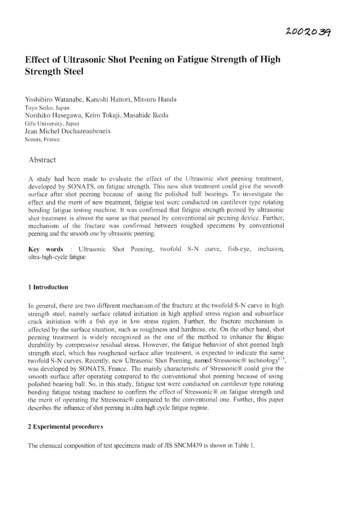
Four-point Bending Fatigue Test Specimen Design by FEASpecimen fracture occurred after 127 748 force cycles. Aphotograph of the fractured specimen is displayed in figure 8.the previous test, the value is not of any importance in thiswork.A photograph of the fractured specimen is displayed infigure 10.CrackinitiationFigure 8Photograph of fractured specimen (standard)The fatigue crack initiated from the line of contactbetween the specimen and the jig shaft closest to centre of thespecimen, as expected.3.3First modified test specimen geometry3.3.1 FEA resultThe first modification to the standard test specimenintroduced in section 3.2 is machining of a 15 mm diametercentre hole transverse and horizontal to the length-axis of thespecimen. The idea of the hole is to reduce the strength ofthe specimen in a region away from the contact zones, thuscausing the stress to rise in this region.The applied force is kept unchanged at -12.5 kN (ydirection). The bending stress contours in the specimen atequilibrium conditions are displayed in figure 9.Figure 9Figure 10 Photograph of fractured specimen (first mod.)Once again, the fatigue crack initiated on the line ofcontact between the jig shaft and the specimen. The proposedmodification therefore proved inadequate.3.4Second modified test specimengeometry3.4.1 FEA resultAs an intermediate modification step, the diameter of thetransverse hole is substantially enlarged in order to reduce theapplied load, and hence the contact stresses, while stillmaintaining a maximum stress of about 164 MPa. In fact, thediameter is increased as much as possible (up to 28 mm) untilthe location of the maximum stress shifts from the specimenoutside surface to the hole inside surface. This situation is ofcourse undesirable since the probability is increased that thecrack initiates in the hole and propagates to the outsidesurface.The applied force is reduced to -8 kN (y-direction),equivalent to 16 kN in the actual test, in order to obtainbending stresses of similar magnitude to those calculated insections 3.2.2 and 3.3.1. The bending stresses for thisintermediate case at equilibrium conditions are displayed infigure 11.First modified specimen bending stress contoursThe maximum tension stress increases from 166 MPa to171 MPa, and its location shifts slightly towards the centre ofthe specimen away from the areas of contact.3.3.2 Fatigue test resultsThe target force profile has a mean value of 0 kN and anamplitude of 25 kN. The force signal is applied at a frequencyof 5 Hz.Specimen fracture occurred after 188 178 completedforce cycles. Although the number of cycles increased fromFigure 11 Second intermediate modified specimen bendingstress contours (28 mm diameter hole)From the graph of stress contours it is witnessed that boththe maximum tension and compressive stresses are located onthe inside surface of the hole. The maximum tension stress isR & D Journal of the South African Institution of Mechanical Engineering 2018, 34, 1-8http://www.saimeche.org.za (open access) SAIMechE All rights reserved.6
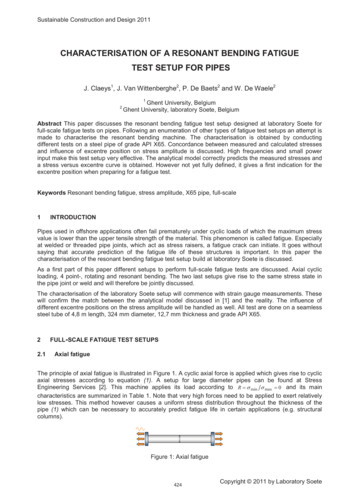
Four-point Bending Fatigue Test Specimen Design by FEA216 MPa, while the maximum compressive stress is229 MPa.In order to mitigate this new development, the hole istranslated or sweeped (as a final modification step) through adistance of 14 mm along the length of the specimen in orderto create a slot. The corresponding bending stresses for thesame load (-8 kN) are displayed in figure 12.0123Figure 13 Photograph of fractured specimens (second mod.)Figure 12 Second modified specimen bending stresscontours (28 mm diameter slot)The maximum tension stress is reduced from 216 MPa to179 MPa, and resides on the outside surface of the specimenas desired. The compressive stress at the same point – whenthe load is reversed – is 177 MPa.3.4.2 Fatigue test resultsFour test specimens are prepared from the specified materialand subjected to the test routine.The applied force amplitude is reduced to 16 kN, whilethe frequency is increased to 10 Hz (reducing the timerequired to test). The results are summarised by the datapresented in table 4.Table 4Figure 14 Fracture surface specimen no. 0Cycles to failure (final modified geometry)Specimen no.0123Cycles to failure271 233373 548364 514254 989Figure 15 Fracture surface specimen no. 24A photograph of the fractured specimens is displayed infigure 13. The specimens are numbered from the far side tothe near side, in chronological order.One specimen (no. 1) fractured from a crack thatoriginated at the line of contact beneath the jig shaft. Threeout of the four specimens, however, fractured in the desiredand expected region as predicted by the FEA effort. Thesespecimens can be identified from the photograph asspecimens no. 0, 2, and 3.It is also noted that the fatigue cracks indeed initiated onthe outside surfaces of the specimens. Photographs of thefracture surfaces of specimens no. 0 and no. 2 are displayedin figures 14 and 15, respectively.ConclusionThe predictive capability of FEA is utilised in a processwhere the geometry of a standard test specimen is modifiedinto a nonstandard geometry that is still suitable formechanical testing.The standardisation of specimen geometry in mechanicaltesting enables the utilisation of analytical equations tocalculate induced stresses in the specimen for a knownapplied force. Deviation from a standard geometrynecessitates the employment of an alternative method ofanalysis, such as FEA, since analytical solutions to the stressdistribution in this nonstandard geometry are not available.The process is successfully demonstrated in a four-pointbending fatigue testing arrangement. Induced stresses due tothe applied load, as well as the location of crack initiation andfracture, can be predicted (by FEA) and manipulated to asatisfactory extent – three out of four test specimens fracturedR & D Journal of the South African Institution of Mechanical Engineering 2018, 34, 1-8http://www.saimeche.org.za (open access) SAIMechE All rights reserved.7
Four-point Bending Fatigue Test Specimen Design by FEAin the desired region from a crack that initiated on the outside,free surface of the specimen.5AcknowledgementThe effective integration of the testing jig with laboratoryequipment, as well as professional execution of the fatiguetest routines by the experienced and able test officers residentat the mechanical testing lab of the CSIR, Messrs. ErichGüldenpfennig and Chris McDuling, are gratefullyacknowledged.The Department of Science and Technology providedfunding for this work under a Parliamentary Gra
The rotating beam fatigue testing machine is commonly used for generating the required large amount of material fatigue test data [2]. 2.1 Rotating beam fatigue testing Rotating beam fatigue testing is a simple, accurate, fast and cost effective method employed for fatigue testing of engineering materials. The frequency of load cycling is