Transcription
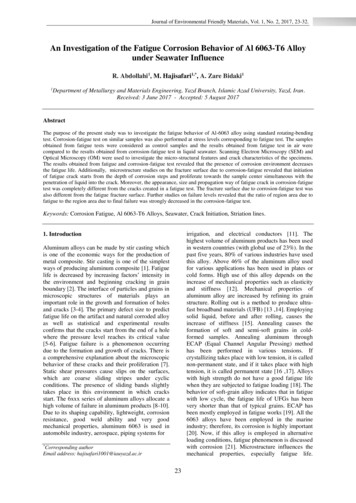
Journal of Environmental Friendly Materials, Vol. 1, No. 2, 2017, 23-32.An Investigation of the Fatigue Corrosion Behavior of Al 6063-T6 Alloyunder Seawater InfluenceR. Abdollahi1, M. Hajisafari1,*, A. Zare Bidaki11Department of Metallurgy and Materials Engineering, Yazd Branch, Islamic Azad University, Yazd, Iran.Received: 3 June 2017 - Accepted: 5 August 2017AbstractThe purpose of the present study was to investigate the fatigue behavior of Al-6063 alloy using standard rotating-bendingtest. Corrosion-fatigue test on similar samples was also performed at stress levels corresponding to fatigue test. The samplesobtained from fatigue tests were considered as control samples and the results obtained from fatigue test in air werecompared to the results obtained from corrosion-fatigue test in liquid seawater. Scanning Electron Microscopy (SEM) andOptical Microscopy (OM) were used to investigate the micro-structural features and crack characteristics of the specimens.The results obtained from fatigue and corrosion-fatigue test revealed that the presence of corrosion environment decreasesthe fatigue life. Additionally, microstructure studies on the fracture surface due to corrosion-fatigue revealed that initiationof fatigue crack starts from the depth of corrosion steps and proliferate towards the sample center simultaneous with thepenetration of liquid into the crack. Moreover, the appearance, size and propagation way of fatigue crack in corrosion-fatiguetest was completely different from the cracks created in a fatigue test. The fracture surface due to corrosion-fatigue test wasalso different from the fatigue fracture surface. Further studies on failure levels revealed that the ratio of region area due tofatigue to the region area due to final failure was strongly decreased in the corrosion-fatigue test.Keywords: Corrosion Fatigue, Al 6063-T6 Alloys, Seawater, Crack Initiation, Striation lines.irrigation, and electrical conductors [11]. Thehighest volume of aluminum products has been usedin western countries (with global use of 23%). In thepast five years, 80% of various industries have usedthis alloy. Above 46% of the aluminum alloy usedfor various applications has been used in plates orcold forms. High use of this alloy depends on theincrease of mechanical properties such as elasticityand stiffness [12]. Mechanical properties ofaluminum alloy are increased by refining its grainstructure. Rolling out is a method to produce ultrafast broadband materials (UFB) [13 ,14]. Employingsolid liquid, before and after rolling, causes theincrease of stiffness [15]. Annealing causes theformation of soft and semi-soft grains in coldformed samples. Annealing aluminum throughECAP (Equal Channel Angular Pressing) methodhas been performed in various tensions. Ifcrystallizing takes place with low tension, it is callednon-permanent state, and if it takes place with hightension, it is called permanent state [16 ,17]. Alloyswith high strength do not have a good fatigue lifewhen they are subjected to fatigue loading [18]. Thebehavior of soft-grain alloy indicates that in fatiguewith low cycle, the fatigue life of UFGs has beenvery shorter than that of typical grains. ECAP hasbeen mostly employed in fatigue works [19]. All the6063 alloys have been employed in the marineindustry; therefore, its corrosion is highly important[20]. Now, if this alloy is employed in alternativeloading conditions, fatigue phenomenon is discussedwith corrosion [21]. Microstructure influences themechanical properties, especially fatigue life.1. IntroductionAluminum alloys can be made by stir casting whichis one of the economic ways for the production ofmetal composite. Stir casting is one of the simplestways of producing aluminum composite [1]. Fatiguelife is decreased by increasing factors’ intensity inthe environment and beginning cracking in grainboundary [2]. The interface of particles and grains inmicroscopic structures of materials plays animportant role in the growth and formation of holesand cracks [3-4]. The primary defect size to predictfatigue life on the artifact and natural corroded alloyas well as statistical and experimental resultsconfirms that the cracks start from the end of a holewhere the pressure level reaches its critical value[5-6]. Fatigue failure is a phenomenon occurringdue to the formation and growth of cracks. There isa comprehensive explanation about the microscopicbehavior of these cracks and their proliferation [7].Static shear pressures cause slips on the surfaces,which are coarse sliding stripes under cyclicconditions. The presence of sliding bands slightlytakes place in this environment in which cracksstart. The 6xxx series of aluminum alloys allocate ahigh volume of failure in aluminum products [8-10].Due to its shaping capability, lightweight, corrosionresistance, good weld ability and very goodmechanical properties, aluminum 6063 is used inautomobile industry, aerospace, piping systems for*CorrespondingauthorEmail address: hajisafari1001@iauyazd.ac.ir23
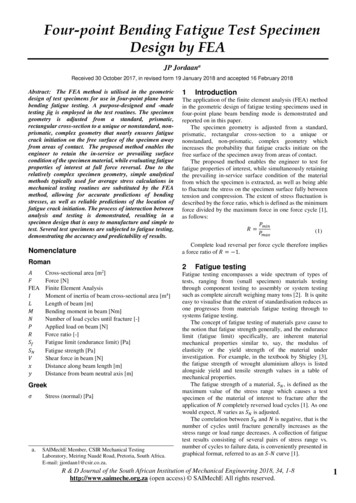
Journal of Environmental Friendly Materials, Vol. 1, No. 2, 2017, 23-32.Changing the microstructure of this alloy throughapplying thermal operations cycles leads to theimprovement of its fatigue corrosion [22-24]. Themost important thermal operations for these alloysare T4 and T6 operations. It is obvious that thepresence of superficial cracks on a piece in acorrosive environment (seawater) can cause thedecrease of fatigue corrosion of this alloy [25-27].Higher corrosion resistance of Al 6063-T6 incomparison to the other group of metals results indecreasing corrosion products and higher workinglife of related structures and therefore reducing theenvironmental contamination. On the other hand,this material could be introduced as friendlyenvironmental materials. Therefore, in the presentstudy, fatigue and corrosion fatigue properties ofAluminum 6063 alloy were investigated using thestandard Rotating-Bending method, and theobtained results from fatigue test were compared todata achieved by corrosion fatigue test conducted onsimilar samples using the same stress levels.amplitudes. Similarly, corrosion fatigue tests insideseawater were accomplished using MSA 2013corrosion fatigue testing machine. In both tests, asinusoidal cyclic waveform with cycling frequencyof 5.0 Hz and a load ratio R -1 were adopted sothat for each stress level three identical sampleswere tested. In addition, in corrosion fatigue tests,the solution temperature was adjusted to the rangeof 25 1 C, which was continuously monitored withthe accuracy of 0.1 C throughout the tests.Furthermore, in order to minimize the chance ofgalvanic corrosion between the sample and sampleholders, both ends of selected sample were insulatedwith inelastic insulator prior to start of each test.Moreover, specimens were exposed to the liquidenvironment 2 hours before the start of loading. Thestress levels of cyclic loading, in both fatigue andcorrosion fatigue tests, started at 150 MPa andfinished at approximately 75 MPa. Specimensfracture surfaces were examined using fieldemission scanning electron microscopy (FESEM,MIRA3 TESCAN) and scanning electronmicroscopy (ESEM, VEGA TESCAN) equippedwith energy-dispersive X-ray spectroscopy (EDS)and backscattered electron detector. Additionally,MIP (Micro-structural Image Processor) softwarewas used for SEM micrographs analysis.2. Materials and MethodsIn order to prepare the samples, Aluminum 6063-T6alloy rod with nominal diameter of 10 mm wasused. Table 1. given the results obtained fordetermining chemical combinations of Al 6063-T6sample. The data presented in this table is inaccordance with ASTM B221 standard [28]. Thetensile properties and hardness of samples, whichwere investigated by the uniaxial tensile testingmethod (GOTECH), and micro hardness test(Future-Tech FM-700) respectively, are listed inTable 2. Al 6063-T6 rods were machined using aCNC lathe in accordance with ASTM-E466standard [29], so that in order to minimize thesurface residual stress throughout the machiningprocedure, a very strong control was performed onmachining procedure concurrent with samplecooling. In the next step, to obtain desiredspecimens gauge area surface quality, the polishingprocess was performed on the previously mentionedsurface of all samples using emery papers No. 1000,1500, 2000, 2500 and 3000. However, the polishingsteps were followed by using polishing paste andfinally cotton to avoid notch effects and surfacegrooves. The high cycle fatigue test was carried outusing SANTAM rotating –bending fatigue testingmachine (SANTAM, Ltd. IRAN) at different stress3. Results and DiscussionFig. 1. shows an optical microscopic image from thesurface of the as-received samples. As it can be seenfrom this figure, the microstructure of the alloyconsists of the two phases, α and β.Fig. 1. The optical microscope of the as-receivedsample.Table 1. Chemical composition of Al 6063-T6 alloy (wt. %) 0.005Table 2. Mechanical properties of Al 6063-T6 alloy.Tensile Strength(MPa)211Yield 5.7724Hardness α(Vickers)74Hardness β(Vickers)85
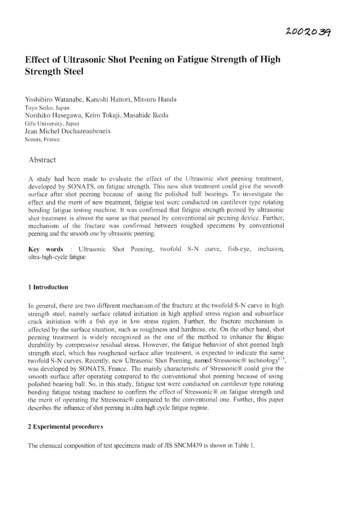
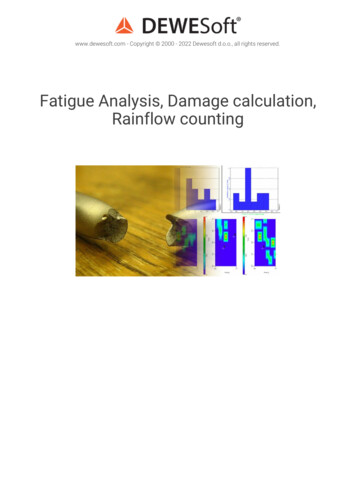
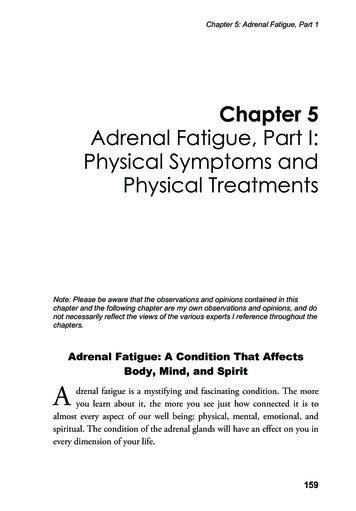
Journal of Environmental Friendly Materials, Vol. 1, No. 2, 2017, 23-32.Fig. 2. shows SEM images from the cross section ofthe samples. As it can be seen in this figure, thephase β has been evenly distributed in themicrostructure. This distribution can be due tothermal operations of Ts in which, after heating upto the temperature of 150 C, the alloy is cooled inair. During cooling, Mg2Si particle forms.Increasing the Si content of the alloy will lead to thefine particles of Mg2Si which can improve the agehardening properties of the alloy.the approximate evenness of the hardness level inline with the diameter, this fact can be a reason forthe evenness dispersion of phase β in field phase α.The recoded optical microscopic images of thesample surface before fatigue test (Fig. 1.) evidentlysuggest this fact.(HV0.05)Fig. 3. Micro hardness profile of the fatigued surface.Fig. 4. depicts the S-N curve (stress-the number ofcycles to failure) related to the Al-6063 alloy in theair and inside seawater. As the figure shows, thealloy’s fatigue strength at the room temperature is75 MPa and its fatigue life is 7.3 106. As it can beseen, the last stress level (in which the piece hassuffered from a failure) is 75 MPa and after 7.3 106,it has been suffered failure. However, performingfatigue test on another sample of the alloy, the cyclehas suffered failure in 70 MPA stress level and after13 106, indicating the ultra-life of the alloy.Furthermore, comparing the two curves reveals thatthis alloy shows a different behavior in the seawater.In other words, subjecting the samples to corrosionfatigue test, fatigue strength and fatigue lifedecrease at corresponding stress levels. Corrosionfatigue in aqueous media is an electrochemicalbehavior. The presence of a corrosive environmentduring loading fatigue leads to corrosion pits.Fractures are initiated either by pitting or persistentslip bands. In this alloy, pitting will often be themost damaging type of corrosion, degradingperformance by increasing the crack initiation andcrack-growth rate more than any other kind ofcorrosion. Notably, to compare fatigue andcorrosion-fatigue tests, the selected stress levels andapplied stress levels have been considered identicalin the fatigue test.Fig. 5. presents the fracture surface of the samplefailed after 7.3 106 cycle. As it can be seen, about80% of the failure is due to fatigue phenomenon andthe remaining 20% is due to soft failure in the finalstage. Furthermore, in corrosion fatigue, the failurearea due to fatigue has been strongly decreasedrelative to fatigue test samples (compared Fig. 5aand 5b) and the area with fragile crack has beenincreased compared to the corresponding area in afatigue test.Fig. 2. FESEM images from the cross section ofsamples before fatigue test at different magnifications.Table 3. Energy-dispersive X-ray spectroscopy (EDS)results of the phases α and β from Fig. 2b.PhaseαβAl (wt. %)98.7498.62Mg (wt. %)1.000.98Si (wt. %)0.260.40As determined in Table 3., the magnitude of Mg isalmost twice greater than Si magnitude in the phase.The hardness of the phase β is probably higher thanphase α. To obtain the hardness level of the alloyemployed in the tests, micro hardness test wasperformed on the fatigued sample (Fig. 3.). Given25
Journal of Environmental Friendly Materials, Vol. 1, No. 2, 2017, 23-32.Fig. 4. S-N curves of aluminum samples in thepresence of air and in Seawater.Higher magnification of Fig. 5. was exhibited inFig. 6. As seen, unlike ductile fracture mode of airfatigued specimen (Fig. 6a), the mode of fracture ofseawater fatigued specimen was semi-ductilefracture (Fig. 6b). Presence of dimples in thefracture surface of air-fatigued specimens indicatedthe ductile fracture mode, while faceted zonebetween dimple areas in the fracture surface ofseawater-fatigued specimens indicated the semiductile fracture.Fig. 6. SEM images of the fatigue fracture surface ofthe Al-6063 alloy tested in (a) air environment,(b) seawater environment.Fig. 7. shows SEM images of the fatigue failure area(Fig. 5a). As the figure presents, striation lines dueto the applied stress cycles can be observed duringfatigue loading in this area.As shown in Fig. 8a, edge crack (a1) and internalcrack (a2) can be seen on the fracture surface.Fig. 8b shows the crack a1 in a higher magnification.It can be seen that the crack initiated from thesample surface and continued towards the center.Ups and downs created on the surface are due to thecyclic loadings, and fatigue cracks start from theseups and downs.The superficial crack initiations occur at the place ofsuperficial defects (i.e., superficial unevenness,superficial stress sources, and changes in residualsuperficial stress or the change of fatigue strength).Considering the fact that the tested samples havebeen totally subjected to polishing process,unevenness in surface cannot cause crack initiation.Mg2Si sediment is created in thermal operations inwhich the rate of chilling is below zero centigrade.Fig. 5. SEM fractography of samples. (a) Air-fatiguedsurface, (b) corrosion fatigued surface in a seawaterenvironment.26
Journal of Environmental Friendly Materials, Vol. 1, No. 2, 2017, 23-32.development in the phase of α during several stagesafter encountering the hard β phase (Fig. 9a and b).Therefore, fatigue crack initiation due to hard Mg2Sisediment is improbable.Fig. 7. Striation lines in the fatigue fracture surface atdifferent magnification.Additionally, since the maximum care has beenapplied in chilling and abrasive flow machiningduring the machine working process, the presence ofresidual stress of the surface cannot either be thecause of crack initiation. Accordingly, sinceinitiation and crack growth path have beenthoroughly placed in the phase of α and the path isdeviated by encountering the phase β, initiation andcrack growth way as well as fatigue crackpropagation in this alloy can be attributed to thestrength level of the existing phases. In other words,crack changes its path when it encounters a phasewith higher strength and continues to proceed in thesofter phase. Also, the presence of ups and downscreated due to cyclic loading can be another reasonfor the creation of the sample edges crack (Fig. 8c).Hence, crack starts from the depth of down anddeviates from its path by keeping on crackFig. 8. SEM image of the micro-cracks in the fatiguesurface. (a) macro-graph, (b) and (c) illustrate surfacecrack that was determined via a1 arrow.27
Journal of Environmental Friendly Materials, Vol. 1, No. 2, 2017, g. 10. EDS results of different phases in Fig. 9b,(a) α phase, (b) β phase.Further studies on the crack propagation wayindicate that in some cases, there are branches in thecrack path. Fig. 11. shows an instance of suchbehavior in which the crack deviates from its pathwhen encountering the phase β.Fig. 9. FESEM images of initiation and propagation ofcrack a1 in Fig. 8. at different magnification.Table 4. given the chemical analysis result aroundthe crack in two phases of α and β of Fig. 9b.Fig. 10. also presents EDS of the sample surface inthe mentioned phases. As expected, in terms ofconstituents, the phase α has a higher aluminumcontent than the phase β and the amount of Mg andSi is less in the phase α. Therefore, the higherstrength level of the phase β can be due to higheramount of Mg and Si in this phase.Table 4. The analysis results of chemical combinationof the sample’s surface in the phases α and β.PhaseAl (wt. %)Mg (wt. %)Si (wt. %)α99.330.220.45β98.380.541.08Fig. 11. The fatigue behavior of crack encountering theβ phase. K and L indicate the crack deviation.28
Journal of Environmental Friendly Materials, Vol. 1, No. 2, 2017, 23-32.Fig. 12a shows that the crack a2 is an internal crack,i.e. its initiation occurs within the sample (point M)and its propagation continues within the sample in alimited way. Similar to the crack a1, this crackexperiences splits and branches in its propagationpath when encountering the second phase. Asshown, in the Al-6063 alloy, an internal crack hasbeen observed at the failure level of a sample, whichendured 4572917 stress cycles. These cracks can bedue to the presence of hard phase of β at the crackplace. Fig. 12b shows the chemical combinationanalysis of the crack initiation place (point M).More investigation that is precise reveals that thecrack initiates from the hard phase of β. Thechemical analysis from point M is determined inTable 5.Fig. 13. shows SEM images of failure level incorrosion-fatigue failure area. The figure also showsthe striation lines created due to cyclic loading inthis area.Table 5. Chemical combinations analysis from pointM.Existing elements (wt. %)Al98.88Mg0.72Si0.4cpskeVFig. 13. SEM fractography of corrosion fatiguedfracture surface at different magnifications.Fig. 12. (a) SEM image of initiation and propagationpath of crack a2, (b) EDS of point M.29
Journal of Environmental Friendly Materials, Vol. 1, No. 2, 2017, 23-32.In Figs. 14a and b, there are cracks, which arecreated due to corrosion-fatigue test. These cracksare softer and scattered on the fracture surface.Moreover, as shown in Fig. 14c , corrosion productscan be clearly seen on the fracture surface in ascattered manner. They are all on the surface of thesample.Fig. 15. shows the images of the fracture surface ofthe samples in air and inside seawater. As it can beseen, striation lines distance and stair-likeunevenness in the sample under corrosion-fatiguetest are less than those in the samples fractured dueto fatigue in the air. This is attributed to the presenceof an aggressive environment surrounding thefracture surface throughout the cyclic loading.Occurrence of corrosion phenomenon on thefracture surface caused surface grooves heightreduction, and as a result, the distance between twovicinal peaks decreased.Fig. 15. Comparison of striation lines in fatiguedsamples. (a) in the air and (b) in seawater.SEM studies of the fractured surfaces indicated thecontribution of corrosion on the occurring offracture, i.e. presence of corrosive products on thefracture surfaces illustrated this contribution(Fig. 16.).According to the Fig. 16. and the results obtainedfrom chemical composition determination test(Table 6 and 7), these materials can be considered ascorrosion products.Fig. 14. SEM fractography of initiation of an internalcrack on the corrosion fatigued fracture surface (a andb) and corrosion product around internal crack.30
Journal of Environmental Friendly Materials, Vol. 1, No. 2, 2017, 23-32.4. Conclusions1. The studied Al-6063 alloy’s fatigue strength atroom temperature was 75 MPa and its fatigue lifewas 7.3 106. By subjecting the samples to seawaterand applying a cyclic load to them, fatigue strengthwas removed and its fatigue life was 5.7 105 in thestress of 75 MPa.2. The incidence of fatigue phenomenon had asignificant effect on the strength of the alloy underthe test. The life of the similar samples significantlydecreased under identical loading conditions incorrosion-fatigue test.3. The presence of higher magnitudes of Mg and Sielements in the phase β increased the strength of thatphase.4. Investigating the microstructure of the studiedalloy revealed that this alloy has the two phases of α(field phase) and β and initiation of fatigue cracktakes place in the phase α.5. Fatigue crack propagation occurs from the sampleedge and in the phase α. In addition, the crack isencountering the harder phase of β causes deviationfrom propagation path and splits in the crack.6. The apparent shape of fatigue cracks is verydifferent on the sample’s fracture surface from thecorrosion-fatigue cracks in terms of size andpropagation behaviour of the crack.7. The penetration of the seawater into the span ofthe fatigue crack causes changes in the apparentshape of fracture surfaces.8. Corrosive environment increases brittle fracturepercentage ( 20%) during the application of cyclicloading.9. The decrease of the fatigue strength of the Al6063 alloy due to corrosion caused the decrease ofstair surface due to fatigue, and the accumulation ofcorrosion beside these stairs stopped the crackgrowth as well as the initiation and propagation ofthe crack from the next stair.cpskeVcpsReferences[1] N. V. Murthy, A. P. Reddy, N. Selvaraj and C.S. P. Rao, Int. J. Mech. Eng., 4(2015), 29.[2] M. R. Bayumjt, Eng. Frac. Mech., 45(1993),297.[3] J. Kimberli, and D. W. Hoeppner. Int. J.Fatigue., 31 (2009), 686.[4] A. G. M. Domínguez, J. L. Á. Ambriz and E. C.Calderón, Eng. Frac. Mech., 93(2012), 119.[5] J. Kimberli and D. W. Hoeppner, Int. J. Fatigue.,31 (2009), 686.[6] Q. Y. Wang, N. Kawagoishi and Q. Chen,Scripta Mater., 49(2003), 711.[7] R. A., S. A. Abdul-Wahab Siddiqui, and T.Pervez, Mater. Des., 29(2008), 70.[8] W. Onteiro, I. Espósito, R. Ferrari and S. Buso,Mater. Sci. Appl., 30(2011), 89.keVFig. 16. (a) SEM images of the corrosion fatiguedfracture surface, (b) EDS of point A, (c) EDS of pointB.Table 6. Chemical composition test results related topoint A (Fig. 16a)Al98.17Existing elements (wt. %)MgSi0.940.21O20.68Table 7. Chemical composition test results related topoint B (Fig. 16a)Al90.55Existing elements (wt. %)MgSi0.920.22O28.3131
Journal of Environmental Friendly Materials, Vol. 1, No. 2, 2017, 23-32.[9] S. K. Panigrahi and R. Jayaganthan, Mater. Sci.Eng. A, 492(2008), 300.[10] S. K. Panigrahi and R. Jayaganthan. J. Mater.Sci., 45(2010), 5624.[11] O. I. Oluwole and J. A. Omotoyinbo, Mater.Res., 13(2010), 125.[12] W. Klöpffer, Int. J. Life Cycle Assess, 17(2012), 1087.[13] S. K. Panigrahi, R. Jayaganthan and V. Chawla,Mater. Lett., 62(2008), 2626.[14] T. S. Shih, Y. Hwa-Sheng and H. Wen-Nong,Metals, 6(2016), 51.[15] H. Maruff, P. Nageswara Rao, D. Singh, R.Jayaganthan and S. Singh, Proced. Eng., 75(2014),129.[16] C. Joon-Yeon and A. Shan, Mater. Sci. Eng. A,347(2003), 165.[17] D. R. Fang, Z. F. Zhang, S. D. Wu, C. X.Huang, H. Zhang, N. Q. Zhao and J. J. Li., Mater.Sci. Eng. A, 426(2006), 305.[18] M. D. Sangid, Int. J. Fatigue., 57(2013), 58.[19] A. Vinogradov and H. Satoshi, Mater. Trans.,42(2001), 74.[20] S. O. Adeosun, O. I. Sekunowo, S. A. Balogun,and V. D. Obiekea. Int. J. Corr., 2012(2012), 1.[21] S. J. Price and B. F. Rita, Coat., 7(2017), 25.[22] F. Walther, Mater. Test., 56(2014), 519.[23] C. J. Villalobos-Gutiérrez, G. E. GedlerChacón, J. G. La Barbera-Sosa, A. Piñeiro, M. H.Staia, J. Lesage, D. Chicot, G. Mesmacque, and E.S. Puchi-Cabrera. Surf. Coat. Technol., 202(2008),4572.[24] Y.Q. Zheng, Z. Zhang, Fire Mater. 40(2016),141.[25] Z. Ling, Y.Li, Z.Luo, S. Ao, Z. Yin, Y. Gu, andQ. Chen, Int. J. Adv. Manuf. Technol. (2017), 1.[26] N. Toric, J. Brnic, I. Boko, M. Brcic, I. W.Burgess and I. Uzelac, Metals, 7(2017), 1.[27] K.J. Fann, and C.C. Chen, Appl. Sci., 7(2017),372.[28] ASTM B221, Standard Specification forAluminum and Aluminum-Alloy Extruded Bars,Rods, Wire Profiles, and Tube,[29] ASTM E466, Standard Practice for ConductingForce Controlled Constant Amplitude Axial FatigueTests of Metallic Materials. 0301: Metals etallography.WestConshohocken, (2015).32
The purpose of the present study was to investigate the fatigue behavior of Al-6063 alloy using standard rotating-bending test. Corrosion-fatigue test on similar samples was also performed at stress levels corresponding to fatigue test. The samples . fatigue test on another sample of the alloy, the cycle has suffered failure in 70 MPA stress .