Transcription
International Journal of Economics and Business AdministrationVolume VII, Issue 1, 2019pp. 174-191Capital Structure and Firm Size on Firm Value Moderated byProfitabilitySubmitted 22/02/18, 1st revision 6/05/19, 2nd revision 15/09/19, 3rd revision 5/2/19accepted 1/3/19Hirdinis M1Abstract:The purpose of this study is to determine the effect of capital structure and firm size on firmvalue, moderated by profitability.The sample of this research is mining sector companies listed on IDX. This research uses thenon-participant observation method with path analysis technique. The method of dataanalysis used is multiple linear regression with data analysis tool using SPSS 22.Based on the analysis results, it was concluded that capital structure has a significantpositive effect on firm value while firm size has a significant negative effect on firm value.Profitability has no significant effect on firm value, whilst company size has a significantpositive effect on profitability.However, profitability is not able to mediate the influence of capital structure and firm sizeon firm value.Keywords: Capital structure, company size, P\profitability, corporate value.1Faculty of Economics and Business, Universitas Mercubuana, Jakarta, Indonesiae-mail: hirdinis@mercubuana.ac
M. Hirdinis1751. IntroductionThe mining sector is an industry that utilizes natural resources in its operations.Along with the development of technological advancements, that enable themanagement of natural resources, the current world economic conditions aretransforming the mining sector into one of the industries that are considered forinvestment. Sukirno (Bisnis.com) April 18, 2016 said that the jump in mining stockprices will continue to be sustained by the growth of the coal commodity sub-sectorin 2016. When the Composite Stock Price Index (IHSG) jumped 5.02%, the miningsector jumped 18.02%. Of the 43 stocks listed in the mining sector, several issuersshot as optimist investors started rebounding world crude oil prices. The projectionof crude oil price recovery could improve the performance of mining commodityissuers. A total of 20 stocks of the mining sector grew positively since the beginningof the year. In fact, shares of PT Delta DuniaMakmurTbk. (DOID) and PT AnekaTambang (Persero) Tbk. (ANTM) shot over 100% year-to-date.Corporate value is the result of the work management does in several dimensions,including net cash flow from investment decisions, growth and capital cost of thecompany. For investors, corporate value is an important concept because corporatevalue is an indicator of how the market perceives the company. High corporatevalues lead to good company performance. Creditors view company value closely.For the creditor, the value of the company is related to the liquidity of the company,i.e. if the company is considered capable or not to return the loan provided by thecreditor. If the implied value of the company is not good, then the investor will ratethe company as having a low value, (Rahman, 2014).One of the most widely used ratios in making investment decisions is the ratio of thestock price to the book value of the firm (price book value). The book value of acompany is the value of the company's assets divided by the number of shares issuedby the company. In other words, the share book value is the fair value of the issuer'sstock, while the stock price can be affected by many factors and various sentiments.The stock price on the stock exchange always reflects the company's performanceestimate or book value in the future, because basically the person buying the stock isbuying for the future, to invest in the long term. The value of the mining companybetween 2011-2015 has fluctuated, namely because of the increase and also thedecrease of the PBV value in each year (www.idx.co.id, 2016). The price bookvalue (PBV) indicator is used to show how far a company can create a firm's valuerelative to the amount of capital invested. The higher the ratio, the more successfulthe firm is in creating value for shareholders. By knowing the PBV ratio, theinvestor can identify which shares are prices reasonably, those which areundervalued, and those which are overvalued. The use of PBV is used as a proxyrepresenting firm value and is also used in most studies that utilize firm value inresearch variables (Rahman, 2014).
Capital Structure and Firm Size on Firm Value Moderated by Profitability176Modigliani and Miller (1958) published what is called the most influential financialarticle ever written on modern capital structure theory. By using a set ofquestionable assumptions, they proved that the value of an enterprise should not beinfluenced by its capital structure. By demonstrating the requirements that make thecapital structure irrelevant, they provided a clue as to what is required if the capitalstructure becomes relevant and affects the value of an enterprise. Based on thecapital structure theory, if the capital structure position is above the optimal capitalstructure target, then any increase of debt will decrease the value of the company.The capital structure is the proportion of corporate financing with debt, namely theratio of corporate leverage. Thus, debt is an element of the firm's capital structure.Capital structure is key to improving productivity and company performance.Capital structure theory explains that the company's financial policy in determiningcapital structure (mix between debt and equity) aims to optimize the value of thecompany (value of the firm). Managers should choose the capital structure that theybelieve will have the highest firm value because this capital structure will be mostbeneficial to the firm’s stockholders (Ross et al., 2013). One disadvantage is that ifthe company is experiencing bad times and its operating profit is insufficient tocover the interest, the shareholders are forced to cover the shortfall; if they can not,then the company will go bankrupt (Brigham and Houston, 2011).Capital structure is the ratio of the value of debt to the value of its own capital,which is reflected in the company's financial statements at the end of the year.Capital structure can be measured by using Debt to Equity Ratio (DER). If the DERgets higher, then the value of the firm will increase, as long as, the DER has notreached its optimum point in accordance with the trade-off theory. Trade-off theoryalso states that with increasing the DER value (increasing the amount of debt) canincrease profitability, only if the debt increased is used correctly. Ahmad et al.(2015) have conducted research on the relationship between capital structure andstock value. Antwi et al. (2012) state that the result of their research found thatcapital structure has no significant effect on company value. However, this iscontrary to Rahman's (2014), Suffah & Riduwan (2016), and Manoppo and Arie(2016) who state that the capital structure has a significant impact on firm value.The size of large companies shows that the company is experiencing growth, so thatinvestors will respond positively, and the value of the company will increase. Thegreater the total assets and sales, the greater the size of a company. The larger thesize or scale of the company, the easier it will be for the company to get funding,both internal and external. It is assumed that larger companies have greatersensitivity and relatively greater wealth transfer compared to smaller companies.With more and more sales, the quicker the money reaches the company. Thus, firmsize reflects the size or amount of assets owned by the company and has an influenceon the value of the company (Horne & Wachowicz, 2009). Several studies havebeen conducted to investigate the relationship between firm size and profitabilityand firm value. Suffah & Riduwan (2016) and Niesh & Velnampy (2011) prove that
M. Hirdinis177firm size has no effect on firm value. While Manoppo & Arie (2016) prove that firmsize has a positive effect on company value.Corporate value can also be influenced by the size of the profit generated by thecompany. Company management should pay attention to the capital structure,company size and profitability, so that the share price will increase and have animpact on the company's value on the investors. Return on equity (ROE) is a ratiothat indicates a company's ability to generate net income for shareholder equityreturns. The greater the ROE results, the better the company's performance. Thepresence of ROE growth shows the prospect of a better company because it means apotential increase in profits obtained by the company. This is captured by investorsas a positive signal from the company that will increase investor confidence and willfacilitate the management of the company to attract capital in the form of shares. Ifthere is an increase in a company's stock demand, it will raise the price of the stockin the capital market. Research conducted by Hamidah and Umdiana (2017), Suffah& Riduwan (2016), Sucuahi & Cambarihan (2016), and Tiska (2015) show theinfluence of profitability to the value of the company. While research by Manoppo& Arie (2016) proves that profitability as measured by ROE does not affect thevalue of the company.Based on the above discussion, previous theories and studies on the influence ofcapital structure and firm size on profitability and corporate value show inconsistentresults. This study was conducted to determine the effect of capital structure andfirm size on stock value with the role of profitability as an intervening variable,whereby research with profitability as an intervening variable has not been studiedmuch by previous researchers.2. Literature reviewThe company’s value is an investor's perception of the company, which is oftenassociated with stock prices. The main purpose of the company, according to thetheory of the firm, is to maximize the wealth or value of the said company.Maximizing the value of a company is very important for a company, because bymaximizing the value of the company, one also maximizes shareholder wealth,which is the main goal of the company. The value of the company is reflected in thebargaining power of the stock; if the company is seen as a company that has a goodprospect in the future, the value of the stock will be very high. Company value canbe seen through the market value or the book value of the company from its equity.Equity describes the total capital of the company in the balance sheet. In addition,the market value can be a measure of corporate value. Assessment of company valuenot only refers to the nominal value, as the condition of the company experiencesmany changes.According to Brigham and Houston (2011) there are several approaches to ratioanalysis in the valuation of market value, consisting of price earnings ratio (PER),
Capital Structure and Firm Size on Firm Value Moderated by Profitability178price book value ratio (PBV), market book ratio (MBR), dividend yield ratio anddividend payout ratio (DPR). The proxy used in this study is PBV. The ratio of stockprice to the book value of a company or price book value (PBV) shows the level ofthe company's ability to create a value relative to the amount of capital invested.High PBVs reflect the high stock price compared to the book value of the stock. Thehigher the stock price, the more successful the company is in creating value forshareholders. The success of the company creates the hope in shareholders in theform of greater profits as well. This proxy also refers to studies by Manoppo & Arie(2016), Hamidah & Umdiana (2017), Suffah and Riduwan (2016), Sucuahi &Cambarihan (2016), Abeywardana and Krishanthi (2015), and Tiska (2015) usingPBV as a variable of firm value.Capital structure is a description of the financial proportion of the company, that is,between capital owned sourced from long-term debt and own capital (equity).Pecking order theory states that "Companies with high profitability levels have lowdebt, because companies with high profitability have abundant internal fundingresources”. In this pecking order theory there is no optimal capital structure (Myers,1977) the company has a sequence of preferences (hierarchy) in the use of funds.According to the pecking order theory, quoted by Megginson et al. (2007), there is ahierarchy of scenarios in selecting funding sources; firms prefer to use internalfunding rather than external funding. Pecking order theory can explain whycompanies that have a high profit rate actually have a small debt level.The trade-off theory of leverage is a theory that explains that the optimal capitalstructure is found by balancing the benefits of debt financing (favorable corporatetax treatment) with higher interest rates and bankruptcy (Brigham and Houston,2011). Debt Equity Ratio reflects the ability of the company to fulfill all itsobligations indicated by its own capital used as debt payment. This will affectinvestor confidence in the company and will further affect the value of the company.This alternative refers to Manoppo and Arie’s (2016) study and Ahmad et al. (2015)study, who use DER as a variable of the capital structure. The size of the company isa reflection of the size that appears in the total value of the company's assets.Investors have big expectations for big companies and have big expectations fordividends from the company. The larger the size of the company, the greater theinvestor's inclination to own its stock, so that it will lead to an increase in stockprices. The increase in stock prices will lead to an increase in price book value(PBV) or the company value. Large companies can cause the market to be willing topay more for their shares because they believe they will get a favorable return fromthe company (Brealey et al., 2011).Profitability is the company's ability to generate profits and measure the level ofoperational efficiency in using its assets. According to Sucuahi & Cambarihan(2016), profitability is a description and performance management in managing thecompany. Profitability is one of the factors that affect the value of the company.The measurement of profitability used in this study is the ratio of return on equity
M. Hirdinis179(ROE) because this ratio is closely related to the capital structure used by thecompany, whether influenced by the proportion of long-term debt or own capital,(Sucuahi & Cambarihan, 2016, Manoppo & Arie, 2016).3. Hypotheses3.1 Effect of capital structure on profitabilityTrade-off theory does not explain the negative correlation between the level ofprofitability and debt ratio. Trade-off theory suggests that with increasing DERvalue (increasing the amount of debt) one can increase profitability, only if the debtis used correctly, according to Myers (1977). Studies by Abeywhardhana andKrishanthi (2015), Ahmad et al. (2015) and Antwi et al. (2012) found out thatcapital structure has a positive effect on profitability. This study intends to reexamine the effect of capital structure on profitability, with the hypothesis:H1: The capital structure affects profitability.3.2 The influence of company size on profitabilityCompany size is a determinant of the profits of the company. The assets owned bythe company indicate whether the company is classified as a large company or not.Company size is measured using Ln total assets. Companies with large assets willuse the resources available as much as possible to generate maximum businessprofits and companies with small assets, will of course, also generate profits inaccordance with their resources (Brealey et al., 2011). Research conducted byHamidah and Umdiana (2017), Suffah & Riduwan (2016), Sucuahi & Cambarihan(2016), and Tiska (2015) show that the company size has a positive effect onprofitability. This study intends to re-examine the effect of company size onprofitability, with the hypothesis:H2: Company size affects profitability.3.3 Effect of capital structure on corporate valueTrade-off theory in capital structure suggests using DER (Debt Equity Ratio) bybalancing the benefits and costs arising as a result of the use of debt. The higher thedebt (DER), the greater the risk. This will affect investor confidence in the companyand will further affect the company's value. This research was conducted by Rahman(2014), Suffah & Riduwan (2016), Manoppo & Arie (2016) and Sunarto and Agus(2009) who stated that capital structure has a positive effect on company value. Thisstudy intends to re-examine the effect of capital structure on company value, withhypothesis:H3: The capital structure affects the firm's value.3.4 Effect of company size on company value
Capital Structure and Firm Size on Firm Value Moderated by Profitability180The size of the company in this study is a reflection of the size of the company thatappears in the total value of the company's assets. This influences the investor'sexpectation of dividend from the company. Increased demand for shares of thecompany will be able to spur on the increase in stock prices in the capital market.The increase shows that companies are considered to have a greater "value". Suchstudies was conducted by Hamidah & Umdiana (2017), Suffah & Riduwan (2016),& Analisa (2011) who said that profitability has a positive effect on firm value. Thisstudy intends to re-examine the effect of firm size on the company value, with thehypothesis:H4: Firm size affects company value.3.5 Effect of profitability on corporate valueProfitability can be calculated with ROE (return on equity). ROE reflects the returnon investment for shareholders. High profitability reflects the company's ability togenerate high returns for shareholders. High profitability ratio owned by a companywill attract investors to invest in the company. The high interest of investors toinvest in companies with high ROE will increase stock prices. Thus, there will be apositive relationship between profitability and stock prices, where high stock priceswill affect the value of the company. Such research was conducted by Sucuahi &Cambarihan (2016), Hamidah and Umdiana (2017), Suffah & Riduwan (2016),Sucuahi & Cambarihan (2016), and Tiska (2015) who said that profitability affectthe value of the company. This study intends to re-examine the effect of profitabilityon the value of the company, with the hypothesis:H5: Profitability affects the firm's value.3.6 Effect of capital structure on firm value with profitability as interveningvariableCapital structure is the ratio of the value of debt to the value of a company’s owncapital, which is reflected in the company's financial statements at the end of theyear. Capital structure can be measured by using Debt to Equity Ratio (DER). If theDER gets higher, then the value of the firm will increase as long as the DER has notreached its optimum point in accordance with the trade-off theory. Trade-off theoryalso states that with increasing DER value (increasing the amount of debt) one canincrease profitability, only if the debt is increased and used correctly. Research onthis relationship was once done by Rahman (2014) who concluded that profitabilityis able to mediate the influence of capital structure on firm value. This study intendsto re-examine the effect of capital structure on firm value with profitability, with thehypothesis:H6: Profitability has an affect as an intervening variable mediating the influence ofcapital structure on firm value.3.7 Effect of firm size on firm value with profitability as intervening variable
M. Hirdinis181The size of the company is a substitute of the total assets of the company, whichshows how much property the company has. Companies with large assets will usethe resources possessed to the maximum to generate maximum profits as well. Withthe growing size of a company, then there is a tendency that more investors will payattention to the company. This condition will cause a rise in stock prices ofcompanies in the capital market that will, in turn, raise the value of the company(Brealey et al., 2011). Research on this relationship was done by Pratama &Wiksuana (2016). This study intends to re-examine the effect of firm size on firmvalue with profitability as an intervening variable, with the hypothesis:H7: Profitability affects as an intervening variable that mediates the effect of firmsize on firm value.4. Research methodology4.1 Design ResearchThe design of this study is a causal comparative study. Subana (2013) states thatquantitative research is divided into experimental research, descriptive correlationalresearch, evaluation and comperative causal research. Comparative causal researchis often difficult to distinguish from correlational research. Emzir (2011) suggeststhat correlational and comparative causal studies are difficult to distinguish sinceboth of these studies conduct the same manipulation and interpretation of results.However, there is also a difference between the two. Comparative causal studiesusually involve two or more groups and one independent variable.4.2 Population and sample researchAccording to Sugiyono (2015), "Population is a generalization region consisting ofobjects / subjects that have certain qualities and characteristics set by researchers tobe studied and from which conclusions are drawn”. The population in this study arethe companies that are in the mining sector, amounting to 47 companies that havegone public. A sample is a part of the number possessed by that population. Thesample was selected by purposive sampling method, which means the sample to beused is taken in accordance with the criteria specified as follows: (a) Miningcompanies listed continuously on the Indonesia Stock Exchange during the period2011-2015; (b) Companies in the metals and minerals mining sub-sector listed inIndonesia Stock Exchange; (c) Companies in the metal and mineral mining subsector that have complete financial statements in the period 2011-2015. Based onthese criteria, the sample is of 7 companies, as follows:ANTM Aneka Tambang Tbk, TINS Timah (Persero) Tbk, CITA Cita MineralInvestindo Tbk, CKRA Cakra Mineral Tbk, DKFT Central Omega Resources Tbk,INCO Vale Indonesia Tbk, and PSAB J Resources Asia Pasifik Tbk.4.3 Data collection technique
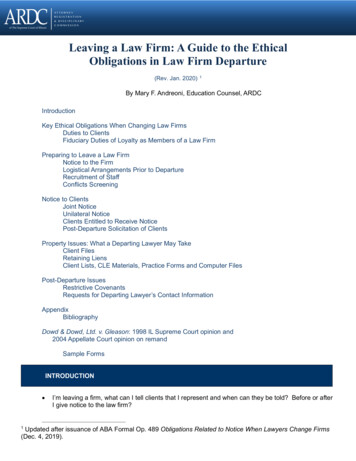
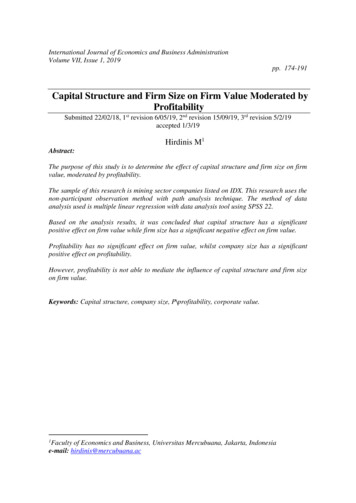
Capital Structure and Firm Size on Firm Value Moderated by Profitability182The type of data used in this study is quantitative data and the data collectiontechniques used are non-participant observation, by collecting, recording andreviewing secondary data in the form of annual financial statements of miningcompanies listed on the IDX period 2011- 2015. Understanding of secondary data,according to Sugiyono (2015), is "Source data that does not directly provide data todata collectors, for example through others or through documents".5. Analysis and discussion5.1 Descriptive statistics testThe result of descriptive statistic test in this research shows that the average value ofcompany value (PBV) that is 1,3714, with standard deviation 0,85325, minimumvalue 0,27, maximum value 5,21 and median 1,2600. The average value of companysize (SIZE) is 29.1463, with standard deviation 1.60688, minimum value 23,05,maximum value 31,08, and median 29,4400. The average value of profitability(ROE) is 0.580, with a standard deviation of 0.17588, a minimum value of 0.53, amaximum value of 0.33, and a median of 0.800. The average value of capitalstructure (DER) is 0.6374, with a standard deviation of 0.66937, minimum value0.01, maximum value 2.96, and median 0.4300.5.2 The results of classic assumption tests1. The normality test. The normality test aims to test whether in the regressionmodel, the intruder or residual variable has a normal distribution. Here are theresults of normality test with Kolmogorov Smirnov (K-S) in this study: based onthe results of testing Kolmogorov - Smirnov (KS) the author obtained a valueAsymp.Sig. (2-Tailed) in the Undstandardized Residual column of 0.200, whichis greater than 0.05 (0.200 0.05) so that H0 is received. So it can be argued thatall data used in this study is normally distributed.2. The multicollinearity test. The calculation results show a Tolerence of 0.871 forcapital structure, firm size of 0.751 and Profitability of 0.679. No independentvariable has Tolerence values less than 0.10 (Tolerence 0.10), which indicatesthat there is no multicolonierity. The non-occurrence of multicolonierity can alsobe proven with no independent variables having Variance Inflation Factor (VIF)values greater than 10 (VIF 10). It can be concluded that in this research thereis no multicolonierity between independent variables in the regression model.3. The heteroscedasticity test. From the scatterplot chart, one can observes that thedots spread randomly and are randomly dispersed and do not form a specificpattern. It can be concluded that there is no heteroscedasticity in this regressionmodel, so this model is feasible to be used to predict Company Value based onthe available independent variables.
M. Hirdinis183Figure 1: The Scatterplot ChartSource: Data processed with SPSS 22.4. The autocorrelation test. The following table shows results of autocorrelationtest calculations with Durbin-Watson test for this study.The result of SPSSoutput shows that the DW test value in this research is 1,150, that is, between -2to 2. So it can be concluded that there is no autocorrelation on the relationshipbetween capital structure and firm size to firm value with profitability variableas an intervening variable, thus data can continue to the next measurement stage.5.3 Regression analysis resultsRegression analysis used in this research is multiple linear regression analysis withtwo regression models to find the direct relation between independent variables anddependent variables and also to find the relation between free and direct variablethrough intervening variable.Table 1. Result of Regression 2 testCoefficientsaModel1 (Constant)Capital StructureUnstandardized CoefficientsBStd. Error-1.312.478-.074.039Ukuran.049.016Perusahaana. Dependent Variable: ProfitabilitySource: Data processed with SPSS 1.912.065.4443.003.005Based on the output of multiple linear regression testing with SPSS 22, the equationcan be as follows:
Capital Structure and Firm Size on Firm Value Moderated by Profitability184Yp : α β1.X1 β2.X2 e1Yp : -1,312 -0.74X1 0.49X2 eα : -1,312, means that if all the independent variables (capital structure and firmsize) are equal to 0, then the value of the dependent variable (profitability) is 1.312.β1 : -0.74, means that if the capital structure variable (DER) experienced anincrease of 1% then the value of Profitability decreased by 0.114 with theassumption that the other independent variables of the regression model isconstant.β2 : 0.49, this means that if the size of the firm increases, then the value of theprofitability of the company will also increase, assuming that the independentvariable of the regression model is constant.Table 2. Result of Regression 2 testCoefficientsaModel1 (Constant)CapitalStructureCompany SizeProfitabilityUnstandardizedCoefficientsBStd. 23.0422.1711.651.038.109a. Dependent Variable: Company ValueSource: Data processed with SPSS 22.The output of multiple linear regression testing with SPSS 22, the equation can be asfollows:Ynp: α β1.X1 β2.X2 β3.X3 e1Ynp: 6,334 0.386X1-0.176X2 -1.292X3 e1α: 6,334, means that if all the capital structure, firm size and profitabilityequals 0, then the value of firm value is equal to 6,334β1: 0.386, it means that if the value of capital structure is increased then thevalue of the company value (PBV) has increased by 0.366.5.4 The test of conformity model (Goodness of Fit)5.4.1 Coefficient of determination (R2)The result of adjusted R2 test in model was R2 value of 0.278 or 28%. The value of28% indicates that the percentage of the contribution of capital structure and firmsize to profitability is 28%. In other words, the variation of independent variablesused in the model is able to explain 28% of the variation of the dependent variable,while the rest of 72% is influenced or explained by other variables not included in
M. Hirdinis185this research model. From the result of adjusted test of R2 in model obtained a valueof adjusted R2 equal to 0,399 or 39%. The value of 39% indicates that the percentageof contribution of capital structure, firm size and profitability to the firm value is39%. In other words, the variation of independent variables used in the model is ableto explain 39% of the variation of the dependent variable, while the remaining 61%is influenced or explained by other variables not included in this research model.5.4.2 Statistical F TestStatistical F test aims to show whether all independent variables in the model have amutual influence on the dependent variable and whether the model used is correct.Table 3. Results of F1 TestANOVAaModelSum of SquaresDfMean tal1.05234a. Dependent Variable: Profitabilityb. Predictors: (Constant), Company Size, Capital StructureSource: Data processed with SPSS 22.F7.559Sig.002bBased on Table 3, it can be seen that the significance value 0.002 from alfa 0.05,therefore H0 is rejected and Ha accepted, it can be stated that the capital structureand the company size, jointly, effect the profitability of a company and this provesthat the regression model used is appropriate.Table 4. Results of F2 TestANOVAaSumofDfMean SquareFSquaresRegression 4a. Dependent Variable: Company Valueb. Predictors: (Constant), Profitability, Company Size, Capital StructureSource: Data processed with SPSS 22ModelSig.000bBased on Table 4, it can be seen that the significance value 0.000 from alfa 0,05,therefore H0 is rejected and Ha accepted, hence it ca
transforming the mining sector into one of the industries that are considered for investment. Sukirno (Bisnis.com) April 18, 2016 said that the jump in mining stock . debt is an element of the firm's capital structure. Capital structure is key to improving productivity and company performance. . sensitivity and relatively greater wealth .