Transcription
Shoal Creek Watershed (II)Total Maximum Daily LoadFinal Stage 1 Report1021 North Grand Avenue EastP.O. Box 19276Springfield, Illinois 62794-9276Report Prepared by:February 2019
Shoal Creek Watershed II TMDLFinal Stage 1 ReportContentsFigures . iiiTables . iiiAcronyms and Abbreviations . iv1.Introduction . 11.11.22.Water Quality Impairments . 1TMDL Endpoints . 31.2.1 Designated Uses . 31.2.2 Water Quality Standards and TMDL Endpoints . 3Watershed Characterization . 42.12.22.32.42.52.62.73.Jurisdictions and Population . 4Climate. 4Land Use and Land Cover . 4Topography. 4Soils . 4Hydrology . 5Watershed Studies and Information. 5Watershed Source Assessment . 53.13.23.34.Pollutants of Concern . 5Point Sources . 5Nonpoint Sources . 63.3.1 Agricultural Runoff. 63.3.2 Onsite Wastewater Treatment Systems . 63.3.3 Animal Feeding Operations (AFOs) . 7Water Quality . 74.14.24.35.Shoal Creek (OI-05) . 7Shoal Creek (OI-13) . 11Shoal Creek (OI-15) . 12TMDL Methods and Data Needs . 135.15.2TMDL Methods . 13Additional Data Needs. 156.Public Participation. 167.References . 17ii
Shoal Creek Watershed II TMDLFinal Stage 1 ReportFiguresFigure 1. Shoal Creek watershed, TMDL project area. . 2Figure 2. Dissolved oxygen water quality time series, Shoal Creek OI-05. . 8Figure 3. Continuous water quality time series for dissolved oxygen, Shoal Creek OI-05 segment. . 9Figure 4. Total phosphorus verse dissolved oxygen, Shoal Creek OI-05. . 10Figure 5. Dissolved oxygen water quality time series, Shoal Creek OI-13. . 11Figure 6. Dissolved oxygen water quality time series, Shoal Creek OI-15. . 12Figure 7. Continuous water quality time series for dissolved oxygen, Shoal Creek OI-15 segment. . 13TablesTable 1. Shoal Creek watershed impairments and pollutants (2016 Illinois 303(d) Draft List) . 1Table 2. Summary of water quality standards for the Shoal Creek watershed . 3Table 3. Data summary, Shoal Creek OI-05 . 8Table 4. Proposed model summary . 14Table 5. Relationship between duration curve zones and contributing sources. 15Table 6. Additional data needs. 16iii
Shoal Creek Watershed II TMDLFinal Stage 1 ReportAcronyms and AbbreviationsAFOAWQMNCAFOCWAIllinois EPAIPCBMGDMS4NOAANPDESSTPTMDLU.S. EPAUSGSWQSanimal feeding operationAmbient Water Quality Monitoring Networkconfined animal feeding operationClean Water ActIllinois Environmental Protection AgencyIllinois Pollution Control Boardmillions of gallons per daymunicipal separate storm sewer systemNational Oceanic and Atmospheric AdministrationNational Pollutant Discharge Elimination Systemsewage treatment planttotal maximum daily loadUnited States Environmental Protection AgencyUnited States Geological Surveywater quality standardsiv
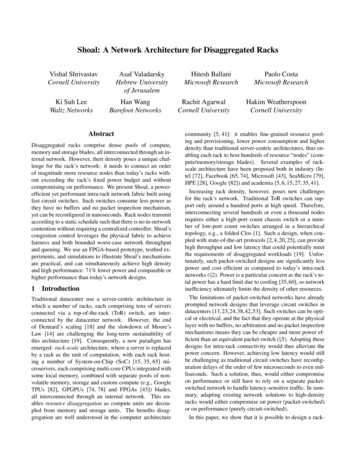
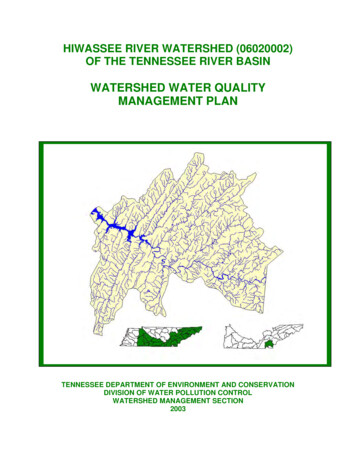
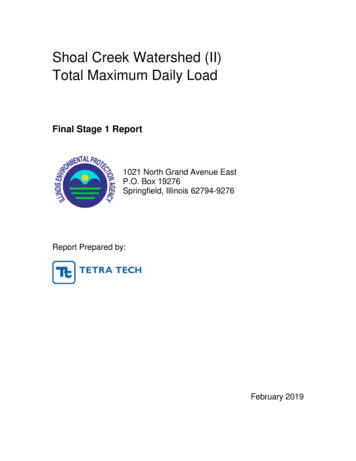
Shoal Creek Watershed II TMDLFinal Stage 1 Report1. IntroductionThe Clean Water Act and U.S. Environmental Protection Agency (U.S. EPA) regulations require thatTotal Maximum Daily Loads (TMDLs) be developed for waters that do not support their designated uses.In simple terms, a TMDL is a plan to attain and maintain water quality standards in waters that are notcurrently meeting standards. This TMDL study addresses the Shoal Creek watershed in south-centralIllinois. The project area, referred to as the Shoal Creek II watershed, is approximately 310 square milesand includes multiple impairments (Figure 1). A TMDL study was previously completed for the ShoalCreek watershed. Relevant information from the study is included herein where applicable (IEPA 2008).The TMDL process establishes the allowable loading of pollutants or other quantifiable parameters for awaterbody based on the relationship between pollution sources and instream conditions. This allowableloading represents the maximum quantity of the pollutant that the waterbody can receive withoutexceeding water quality standards. The TMDL also includes a margin of safety, which reflects uncertaintyas well as the effects of seasonal variation. By following the TMDL process, States can establish waterquality-based controls to reduce pollution from both point and nonpoint sources, and restore and maintainthe quality of their water resources (U.S. EPA 1991). The Illinois EPA will be working with stakeholdersto implement the necessary controls to improve water quality in the impaired waterbodies and meet waterquality standards. It should be noted that the controls for nonpoint sources (e.g., agriculture) will bestrictly voluntary.1.1Water Quality ImpairmentsNumerous segments are included on the draft 303(d) list of impaired waters; however, only four segmentsare addressed as part of this project. Segment OI-05 within the Shoal Creek watershed has been placed onthe State of Illinois §303(d) list (Table 1 and Figure 1) and requires development of a TMDL. Thesegment was previously recommended for delisting based on data collected during two periods ofcontinuous monitoring in 2006 as part of the previous completed Shoal Creek TMDL (IEPA 2008). Sincethe 2006 monitoring, however, water quality standard violations have been observed in this segment.Table 1. Shoal Creek watershed impairments and pollutants (2016 Illinois 303(d) Draft List)Segment WatershedDesignatedNameSegment IDLengthAreaCause of ImpairmentUses(Miles)(Sq. Miles)Shoal CreekOI-0513.37917Aquatic LifeDissolved OxygenShoal CreekOI-0814.29745Public and FoodProcessing WaterSupplyIron aShoal CreekOI-1311.49726Aquatic LifeDissolved Oxygen bShoal CreekOI-1511.12685Aquatic LifeDissolved Oxygen cBOLD – TMDLs are addressed in this Stage 1 report.a. Impairment was removed from the 2018 draft 303(d) list and is not addressed further in this report.b. Additional data are needed to verify impairment.c. While recent data show no impairment, the assessment is still undergoing quality control review.1
Shoal Creek Watershed II TMDLFinal Stage 1 ReportFigure 1. Shoal Creek watershed, TMDL project area.2
Shoal Creek Watershed II TMDLFinal Stage 1 Report1.2TMDL EndpointsThis section presents information on the water quality standards (WQS) that are used for TMDLendpoints. WQS are designed to protect beneficial uses. The authority to designate beneficial uses andadopt WQS is granted through Title 35 of the Illinois Administrative Code. Designated uses to beprotected in surface waters of the state are defined under Section 303, and WQS are designated underSection 302 (Water Quality Standards). Designated uses and WQS are discussed below.1.2.1Designated UsesIllinois EPA uses rules and regulations adopted by the Illinois Pollution Control Board (IPCB) to assessthe designated use support for Illinois waterbodies. The following are the use support designationsprovided by the IPCB that apply to waterbodies in the Shoal Creek watershed:General Use Standards – These standards protect for aquatic life, wildlife, agricultural uses, primarycontact (where physical configuration of the waterbody permits it, any recreational or other water use inwhich there is prolonged and intimate contact with the water involving considerable risk of ingestingwater in quantities sufficient to pose a significant health hazard, such as swimming and water skiing),secondary contact (any recreational or other water use in which contact with the water is either incidentalor accidental and in which the probability of ingesting appreciable quantities of water is minimal, such asfishing, commercial and recreational boating, and any limited contact incident to shoreline activity), andmost industrial uses. These standards are also designed to ensure the aesthetic quality of the state’saquatic environment.Shoal Creek segment OI-05 is designated for dissolved oxygen enhanced protection according to 35 IllAdm. Code 302.206. Waters with enhanced protection have a more stringent dissolved oxygen standardthan other waters of the State. These waters were chosen based on the potential biota (fish early life stagespresent) and the dissolved oxygen needed for these biota to thrive.1.2.2Water Quality Standards and TMDL EndpointsEnvironmental regulations for the State of Illinois are contained within the Illinois Administrative Code,Title 35. Specifically, Title 35, Part 302 contains water quality standards promulgated by the IPCB. Thissection presents the standards applicable to impairments within the study area. Water quality standardsare the endpoints to be used for TMDL development in the Shoal Creek watershed (Table 2).Table 2. Summary of water quality standards for the Shoal Creek watershedParameterUnitsGeneral Use Water Quality Standard for Waters withEnhanced ProtectionDissolved Oxygen amg/LMarch-July 5.0 min & 6.25 7-day meanAug-Feb 4.0 min, 4.5 7-day mean, & 6.0 30-day meana. Applies to the dissolved oxygen concentration in the main body of all streams, in the water above the thermocline of thermallystratified lakes and reservoirs, and in the entire water column of unstratified lakes and reservoirs.Aquatic life use assessments in streams are typically based on the interpretation of biological information,physicochemical water data and physical-habitat information from the Intensive Basin Survey, AmbientWater Quality Monitoring Network or Facility-Related Stream Survey programs. The primary biologicalmeasures used are the fish Index of Biotic Integrity (fIBI; Karr et al. 1986; Smogor 2000, 2005), themacroinvertebrate Index of Biotic Integrity (mIBI; Tetra Tech 2004) and the Macroinvertebrate BioticIndex (MBI; Illinois EPA 1994). Physical habitat information used in assessments includes quantitative orqualitative measures of stream bottom composition and qualitative descriptors of channel and riparian3
Shoal Creek Watershed II TMDLFinal Stage 1 Reportconditions. Physicochemical water data used include measures of conventional parameters (e.g., dissolvedoxygen, pH and temperature), priority pollutants, non-priority pollutants, and other pollutants (U.S. EPA2002 and https://www.epa.gov/wqc). In a minority of streams for which biological information isunavailable, aquatic life use assessments are based primarily on physicochemical water data.When a stream segment is determined to be Not Supporting aquatic life use, generally, one exceedance ofan applicable Illinois WQS (related to the protection of aquatic life) results in identifying the parameter asa potential cause of impairment. Additional guidelines used to determine potential causes of impairmentinclude site-specific standards (35 Ill. Adm. Code 303, Subpart C), or adjusted standards (published in theICPB’s Environmental Register at ster.asp).2. Watershed CharacterizationThe Shoal Creek watershed is located in southwestern Illinois (Figure 1). The headwaters begin innorthern Montgomery County and Christian County, IL and flow south towards its confluence with theKaskaskia River. Shoal Creek joins the Upper Kaskaskia River downstream of Carlyle Lake and theKaskaskia River eventually joins the Mississippi River south of St. Louis, Missouri. A TMDL hasrecently been developed for a portion of the Shoal Creek watershed (IEPA 2008) therefore the previousShoal Creek Watershed TMDL provides the basis for the watershed characterization and sourceassessment for the Shoal Creek project area below.2.1Jurisdictions and PopulationRelevant information on jurisdictions and population can be found within the recently completed ShoalCreek Total Maximum Daily Load (IEPA 2008). The project area is located within Bond, Montgomery,Clinton, Madison, and Macoupin counties.2.2ClimateIn general, the climate of southern Illinois is temperate with hot summers and cold, snowy winters.Relevant information on climate can be found within the recently completed Shoal Creek Total MaximumDaily Load (IEPA 2008).2.3Land Use and Land CoverRelevant information on land use and land cover can be found within the recently completed Shoal CreekTotal Maximum Daily Load (IEPA 2008). Cultivated crops make up the majority of the land cover in theproject area.2.4TopographyRelevant information on topography can be found within the recently completed Shoal Creek TotalMaximum Daily Load (IEPA 2008).2.5SoilsRelevant information on soils can be found within the recently completed Shoal Creek Total MaximumDaily Load (IEPA 2008). Soils are primarily category C soils that are defined as “soils having a slowinfiltration rate when thoroughly wet” with slow infiltration rates. They typically consist of “soils having4
Shoal Creek Watershed II TMDLFinal Stage 1 Reporta layer that impedes the downward movement of water or soils of moderately fine texture or find texture”(IEPA 2008).2.6HydrologyRelevant information on hydrologic conditions can be found within the recently completed Shoal CreekTotal Maximum Daily Load (IEPA 2008). An active U.S. Geological Survey (USGS) flow gage site islocated on the Shoal Creek OI-08 segment (USGS gage 05594000).2.7Watershed Studies and InformationRelevant information for this section can be found within the recently completed Shoal Creek TotalMaximum Daily Load (IEPA 2008). County soil and water conservation districts and health departmentswere contacted for additional information; no new information was provided.3. Watershed Source AssessmentSource assessments are an important component of water quality management plans and TMDLdevelopment. This section provides a summary of potential sources that contribute to low dissolvedoxygen conditions in Shoal Creek.3.1Pollutants of ConcernPollutants of concern evaluated within this source assessment include parameters influencing dissolvedoxygen such as biochemical oxygen demand, phosphorus, and ammonia. These pollutants can originatefrom an array of sources including point and nonpoint sources. Eutrophication (high levels of algae) isalso often linked directly to low dissolved oxygen conditions and therefore nutrients are also a pollutantof concern. Point sources typically discharge at a specific location from pipes, outfalls, and conveyancechannels. Nonpoint sources are diffuse sources that have multiple routes of entry into surface waters,particularly overland runoff. This section provides a summary of potential point and nonpoint sources thatcontribute to Shoal Creek.3.2Point SourcesPoint source pollution is defined by the Federal Clean Water Act (CWA) §502(14) as:“any discernible, confined and discrete conveyance, including any ditch, channel, tunnel,conduit, well, discrete fissure, container, rolling stock, concentrated animal feeding operation[CAFO], or vessel or other floating craft, from which pollutants are or may be discharged. Thisterm does not include agriculture storm water discharges and return flow from irrigatedagriculture.”Under the CWA, all point sources are regulated under the NPDES program. A municipality, industry, oroperation must apply for an NPDES permit if an activity at that facility discharges wastewater to surfacewater. Point sources can include facilities such as municipal wastewater treatment plants (WWTPs),industrial facilities, CAFOs, or regulated storm water including municipal separate storm sewer systems(MS4s).There are two individual NPDES permitted facilities in the Shoal Creek (OI-05) watershed—theGermantown Sewage Treatment Plant (STP) (NPDES permit ILG580186) and one CAFO (NPDES5
Shoal Creek Watershed II TMDLFinal Stage 1 Reportpermit ILA010007). There are no permitted MS4s. Germantown STP is a domestic lagoon that dischargesto a Shoal Creek tributary with average design flow of 0.135 million gallons per day (MGD) andmaximum design flow of 0.330 MGD.There are three individual NPDES permitted facilities in the Shoal Creek (OI-15) watershed—Pocahontas STP (ILG580010), Pierron East STP (ILG580237), and Louisville STP (ILG580081).There are no permitted facilities or MS4s in the Shoal Creek (OI-13) watershed.3.3Nonpoint SourcesThe term nonpoint source pollution is defined as any source of pollution that does not meet the legaldefinition of point sources. Nonpoint source pollution typically results from overland stormwater runoffthat is diffuse in origin, as well as background conditions. Nonpoint pollutant sources potentiallycontributing to low dissolved oxygen impairments include agricultural runoff, onsite wastewatertreatment systems, and animal agriculture activities. As part of the water resource assessment process,Illinois EPA has identified several sources as contributing to the impairments: loss of riparian habitat,crop production (crop land or dry land), and agriculture, all of which are nonpoint sources.3.3.1Agricultural RunoffDuring wet-weather events (snowmelt and rainfall), pollutants are incorporated into runoff and can bedelivered to downstream waterbodies. The resultant pollutant loads are linked to the land uses andpractices in the watershed. Agricultural areas can have significant effects on water quality if proper bestmanagement practices are not in place, specifically contributing to high biochemical oxygen demand andnutrients that can affect the dissolved oxygen conditions in streams. Drain tiles also transport agriculturalrunoff directly to ditches and streams, whereas runoff flowing over the land surface may infiltrate to thesubsurface and may flow through riparian areas. The majority of land within the Shoal Creek watershed isin cultivated crops.3.3.2Onsite Wastewater Treatment SystemsOnsite wastewater treatment systems (e.g., septic systems) that are properly designed and maintainedshould not serve as a source of contamination to surface waters. However, onsite systems do fail for avariety of reasons. Common soil-type limitations which contribute to failure include seasonally highwater tables, compact glacial till, bedrock, and fragipan. When these septic systems fail hydraulically(surface breakouts) or hydrogeologically (inadequate soil filtration) there can be adverse effects to surfacewaters (Horsley and Witten 1996). Septic systems contain all the water discharged from homes andbusiness and can be significant sources of pollutants.Illinois EPA estimates that between 20–60% of onsite wastewater treatment systems are failing in thestate of Illinois (IEPA 2004). During the development of this TMDL county health departments werecontacted for county specific information on septic systems and unsewered communities. Septic systemsthroughout the watershed are typically inspected during installation and on a complaint basis. There areapproximately 20,000 septic systems in Madison County. In 2017, 223 systems were inspected inMadison County and 96.5 percent of systems that were previous found under violation were brought intocompliance.6
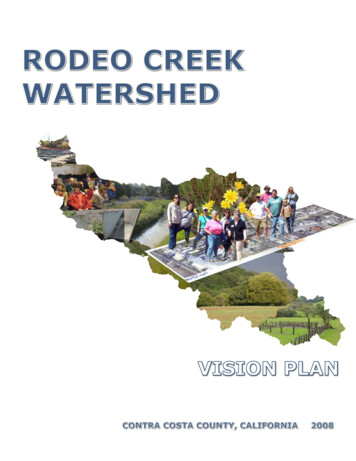
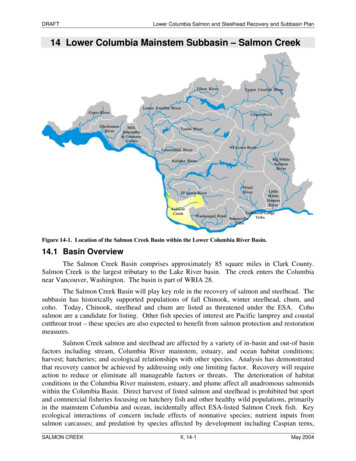
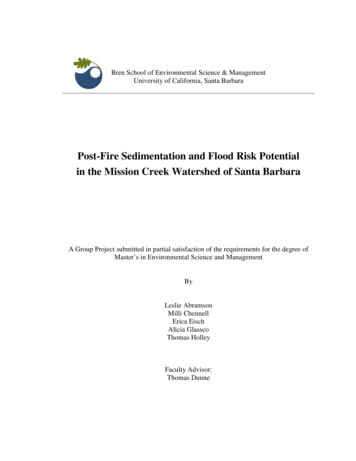
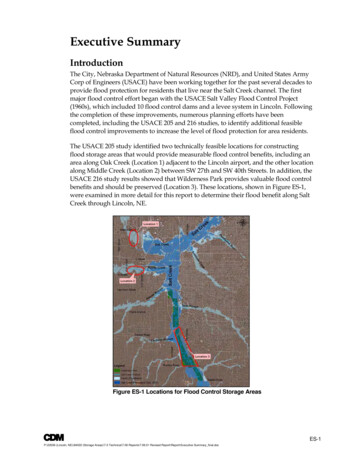
Shoal Creek Watershed II TMDLFinal Stage 1 Report3.3.3Animal Feeding Operations (AFOs)Animal feeding operations that are not classified as CAFOs are known as animal feeding operations(AFOs) in Illinois. Non-CAFO AFOs are considered nonpoint sources by U.S. EPA. AFOs in Illinois donot have state permits. However, they are subject to state livestock waste regulations and may beinspected by the Illinois EPA, either in response to complaints or as part of the Agency’s field inspectionresponsibilities to determine compliance by facilities subject to water pollution and livestock wasteregulations. The animals raised in AFOs produce manure that is stored in pits, lagoons, tanks and otherstorage devices. The manure is then applied to area fields as fertilizer. When stored and applied properly,this beneficial re-use of manure provides a natural source for crop nutrition. It also lessens the need forfuel and other natural resources that are used in the production of fertilizer. AFOs, however, can poseenvironmental concerns, including the following: Manure can leak or spill from storage pits, lagoons, tanks, etc.Improper application of manure can contaminate surface or ground water.Manure over application can adversely impact soil productivity.Livestock are potential sources of nutrients to streams, particularly when direct access is not restrictedand/or where feeding structures are located adjacent to riparian areas. Bond and Clinton SWCDs receiveda 319 grant from IEPA in 2016 to continue work in the two counties assisting livestock producers inmaking improvements to their animal waste systems to reduce nutrient and sediment loading towaterbodies.4. Water QualityAn important step in the TMDL development process is the review of water quality conditions,particularly data and information used to list segments. Examination of water quality monitoring data is akey part of defining the problem that the TMDL is intended to address.Background information on water quality monitoring can be found in the recently completed Shoal CreekTotal Maximum Daily Load (IEPA 2008). In the Shoal Creek watershed, water quality data were foundfor numerous stations that are part of the Illinois EPA Ambient Water Quality Monitoring Network(AWQMN). Parameters sampled in the streams include field measurements (e.g., dissolved oxygen) aswell as those that require lab analyses (e.g., nutrients).The most recent 10 years of data collection, 2007–2016, were used to evaluate impairment status. Datathat are greater than 10 years old are not included in impairment status evaluation; however, data from2002 were available for segment OI-05. Each data point was reviewed to ensure the use of quality data inthe analysis below. Data were obtained directly from Illinois EPA.4.1Shoal Creek (OI-05)Shoal Creek (O1-05) is impaired for aquatic life due to low levels of dissolved oxygen. One Illinois EPAsampling site is present on segment OI-05 of Shoal Creek (Table 3 and Figure 2). Ten samples werecollected at the site from 2007–2012. Four violations of the general use water quality standard – enhancedprotection were observed in June and August 2007 and July of 2012. Continuous dissolved oxygen datawere collected in 2007 and 2017; multiple violations of the standard were observed in July and August2007 (Figure 3). These violations verify impairment.7
Shoal Creek Watershed II TMDLFinal Stage 1 ReportTable 3. Data summary, Shoal Creek OI-05Sample SiteNo. mber of exceedances of generaluse water quality standard – enhancedprotection ( 5 mg/L (Mar-Jul) and 4mg/L (Aug-Feb))OI-05103.15.48.84Figure 2. Dissolved oxygen water quality time series, Shoal Creek OI-05.8
Shoal Creek Watershed II TMDLFinal Stage 1 ReportFigure 3. Continuous water quality time series for dissolved oxygen, Shoal Creek OI-05 segment.9
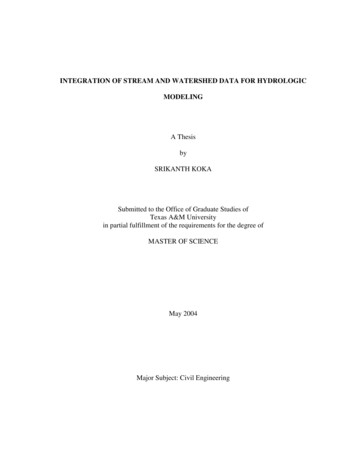
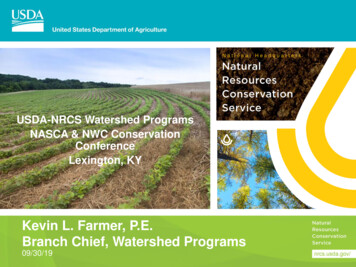
Shoal Creek Watershed II TMDLFinal Stage 1 ReportFurther review of available data was conducted to determine the cause of impairment: Point Sources: The point source discharging into Shoal Creek is downstream from themonitoring station (OI-05) and is therefore not contributing to the impairment. Eutrophication: Available phosphorus data were evaluated to determine if eutrophication wascontributing to low dissolved oxygen conditions; however, no eutrophication relationship existsbetween high levels of phosphorus and low levels of dissolved oxygen (Figure 4).Although the impairment has been verified, a strong link to a pollutant is not present and there are nopoint sources contributing to the impairment that has been assessed based on data at OI-05.Figure 4. Total phosphorus verse dissolved oxygen, Shoal Creek OI-05.10
Shoal Creek Watershed II TMDLFinal Stage 1 Report4.2Shoal Creek (OI-13)Shoal Creek segment OI-13 is listed as impaired for aquatic life due to dissolved oxygen. One IEPAsampling site (OI-13) was identified on the segment. Data collection between 2007–2016 does notindicate impairment in the segment (Figure 5); however, due to the small sample size, additional data areneeded to verify impairment.Figure 5. Dissolved oxygen water quality time series, Shoal Creek OI-13.11
Shoal Creek Watershed II TMDLFinal Stage 1 Report4.3Shoal Creek (OI-15)Shoal Creek segment OI-15 is listed as impaired for aquatic life due to dissolved oxygen. One IEPAsampling site was identified on the segment, OI-15. Data collection between 2007–2012 (Figure 6) andcontinuous data from June and August 2017 (Figure 7) do not indicate impairment. While the data do notshow impairment, the assessment is still undergoing quality control review.Figure 6. Dissolved oxygen water quality time series, Shoal Creek OI-15.12
Shoal Creek Watershed II TMDLFinal Stage 1 ReportFigure 7. Continuous water quality time series for dissolved oxygen, Shoal Creek OI-15 segment.5. TMDL Methods and Data NeedsThe first stage of this project assesses available data followed by evaluation of their credibility. The typesof data available, their quantity and quality, and their spatial and temporal coverage relative to impairedsegments or watersheds drive the approaches used for TMDL model selection and analysis. Credible dataare those that meet specified levels of data quality, with acceptance criteria defined by measurementquality objectives, specifically their precision, accuracy, bias, representativeness, completeness, andreliability. The following sections describe the methods that will be used to derive TMDLs and theadditional data needed to develop credible TMDLs.5.1TMDL MethodsTMDLs are proposed for segments with verified impairments and known pollutants (Table 4). If pointsources are not present and if there is a correlation with eutrophication (i.e., phosphorus concentration orhigh levels of algae and/or plant growth), a duration curve approach is suggested to develop a phosphorusTMDL. The phosphorus target will be derived from the relationship between phosphorus and dissolvedoxygen in the impair
Kaskaskia River eventually joins the Mississippi River south of St. Louis, Missouri. A TMDL has recently been developed for a portion of the Shoal Creek watershed (IEPA 2008) therefore the previous Shoal Creek Watershed TMDL provides the basis for the watershed characterization and source assessment for the Shoal Creek project area below.