Transcription
INTEGRATION OF STREAM AND WATERSHED DATA FOR HYDROLOGICMODELINGA ThesisbySRIKANTH KOKASubmitted to the Office of Graduate Studies ofTexas A&M Universityin partial fulfillment of the requirements for the degree ofMASTER OF SCIENCEMay 2004Major Subject: Civil Engineering
iiINTEGRATION OF STREAM AND WATERSHED DATA FOR HYDROLOGICMODELINGA ThesisbySRIKANTH KOKASubmitted to Texas A&M Universityin partial fulfillment of the requirementsfor the degree ofMASTER OF SCIENCEFrancisco Olivera(Chair of Committee)Ralph Wurbs(Member)Clyde Munster(Member)Paul N. Roschke(Head of Department)May 2004Major Subject: Civil Engineering
iiiABSTRACTIntegration of Stream and Watershed Data for Hydrologic Modeling. (May 2004)Srikanth Koka, B.E., Osmania University,Hyderabad, India.Chair of Advisory Committee: Dr. Francisco OliveraThis thesis presents the development of a hydrologic model in the vectorenvironment. Establishing spatial relationship between flow elements is the key for flowrouting techniques. Such a relationship is called hydrologic topology, making each flowelement know which other elements are upstream and which are downstream. Based onthe hydrologic topology established for the flow elements, tools were developed for flownetwork navigation, drainage area estimation, flow length calculation and drainagedivide determination. To apply the tools, data required might be obtained from differentsources, which may lead to certain problems that have to do with wrong flow directionof stream lines and, mismatches in location of stream lines with respect to thecorresponding drainage area polygons. Procedures to detect such inconsistencies and tocorrect them have been developed and are presented here. Data inconsistenciescorrection and parameter computation methods form the basis for the development of arouting model, which would be referred as hydrologic model. The hydrologic modelconsists of an overland flow routing module, two options for channel routing and areservoir routing module. Two case studies have been presented to show the applicationof the tools developed.
ivDEDICATIONTo God, my parents, brother, relatives and friends.
vACKNOWLEDGMENTSI am thankful to my parents for supporting me at all times and for giving me aword of confidence every once in a while.I would like to especially thank Dr. Francisco Olivera for his guidance and trust.Working under him, I have learnt a lot of things, which will surely help in my career.I would also like to thank my other committee members: Dr. Clyde Munster andDr. Ralph Wurbs for their trust, guidance and contributions throughout this research.I also wish to thank my fellow classmates and friends for their active help andcontribution: Ashish Agrawral, Rajeev Raina, Milver Valenzuela and Paramjit Chibber.
viTABLE OF CONTENTSPageABSTRACT . iiiDEDICATION .ivACKNOWLEDGMENTS.vTABLE OF CONTENTS .viLIST OF FIGURES. viiiLIST OF TABLES .xi1INTRODUCTION.11.11.21.31.42MOTIVATION .1OBJECTIVES .3STUDY AREA.5OUTLINE.7LITERATURE REVIEW.82.1 HYDROLOGIC MODELS .82.1.1 HEC-HMS (Hydrologic Modeling System).92.1.2 SWAT (Soil and Water Assessment Tool).102.1.3 Source-to-Sink Method .122.1.4 Others Methods .132.2 GIS – HYDROLOGIC PARAMETERS.162.2.1 DEM-Based Methods .172.2.2 Vector-Based Methods .183CONCEPTS AND TERMINOLOGY .213.1 GEOGRAPHIC INFORMATION SYSTEMS .213.2 DATA MODELS .233.3 ARCOBJECTS, COM AND CUSTOMIZATION .27
viiPage4METHODOLOGY.284.1 PREPROCESSING GIS DATA.294.1.1 Dendrification of Stream Network .294.1.2 Intersection and Building Topology.334.1.3 Treatment of Data Inconsistencies .354.2 HYDROLOGIC NETWORK PARAMETER DERIVATION.444.3 HYDROLOGIC MODEL DESCRIPTION .604.3.1 Overland Flow Routing .624.3.2 Channel Routing.684.3.3 Reservoir Routing .714.3.4 Routing Algorithm .735APPLICATION, RESULTS AND DISCUSSIONS .755.1 CASE STUDY-1 .755.1.1 HUC Data .755.1.2 NHD Data.775.1.3 San Antonio River Basin Data .805.1.4 Dendrification.825.1.5 Intersection and Building Topology.865.1.6 Treatment of Data Inconsistencies .875.1.7 Hydrologic Topology and Network Parameters.905.2 CASE STUDY -2 .1005.2.1 Data Description.1035.2.2 AVSWAT and SWAT.1085.2.3 SWAT Model Calibration .1115.2.4 15-minute Surface Runoff Depths Generation.1155.2.5 Application of Hydrologic Model .1166CONCLUSIONS .128REFERENCES.132VITA .136
viiiLIST OF FIGURESFIGUREPage1.1Study Area: Region 12 .61.2Study Area: Bull Creek Watershed .73.1Classification of ArcGIS .223.2Polyline Schematic .253.3Example Dendritic Network.264.1Non-Dendritic Network.304.2Balanced Loop.334.3Unbalanced Loop .334.4Stream Line Flowing in Sub-watershed B Has a Small Upstream Part in SubWatershed A .394.5Stream Line Flowing in Sub-watershed A Draining into Sub-watershed BThen Draining Back into Sub-watershed A .404.6Two Stream Lines Flowing Sub-watershed A Outletting into Sub-watershed B 424.7Sub-watershed A Draining into Sub-watershed B Instead of Draininginto Sub-watershed C .444.8Example Stream Network .454.9Rank Attribute .514.10Outlet Segments .554.11Downstream Trace .59
ixFIGUREPage4.12Upstream Trace .594.13Source-to-Sink Method .644.14Routing Method Determination .695.1Location of Region 12.765.2.NHD Streams for Region 12 .805.3San Antonio River Basin.815.4San Antonio River Basin Data .825.5Dendrification Tools .835.6Loop Correction .845.7Line Orientation Corrections.855.8Irresolvable Data Inconsistency Case .905.9Map Showing the Rank Pattern.915.10Map Showing Upstream Lengths (in meters) .925.11Map Showing Downstream Lengths (in meters).935.12Map Showing Accumulated Areas (in Sq.meters) .945.13ArcHydro Feature Dataset.955.14Tracing Tool Wizards.965.15Downstream Trace of Three Lines in the Network.975.16Upstream Trace of Three Lines in the Network.985.17Bull Creek Watershed County.995.18a Surface Runoff Generation Using SWAT.101
xFIGUREPage5.18b Hydrograph Generation Using the Hydrologic Model.1025.1910m DEM for Bull Creek Basin.1045.20Flow Gauging Station at Bull Creek@ Loop 360, Austin, TX .1075.2115 minute Precipitation File .1105.22a SWAT Model Calibration (3/1/02 – 7/30/02) .1135.22b SWAT Model Calibration (6/25/02 – 7/30/02) .1135.22c SWAT Model Validation .1145.23HRUs Delineated by ArcGIS SWAT.1215.24Sources in Bull Creek Watershed.1225.25Source-to-Sink Flow Routing Interface .1255.26Hydrologic Model Calibration .1275.27Hydrologic Model Validation .128
xiLIST OF TABLESTABLEPage4.1Stream network table.464.2Watershed table .474.3Stream network table attributed with hydrologic parameters .574.4Watershed table attributed with hydrologic parameters.575.1Attribute table table for Region 12 HUCs.775.2Stream network table after intersection and building topology .875.3Potential outlet streams table.885.4Data inconsistencies table .895.5Stream routing parameters attributed to streams.1185.6Overland flow routing parameters attributed to sub basins.1195.7Intermediate overland routing parameters computed for HRUs .1245.8Intermediate channel routing parameters for streams .124
111.1INTRODUCTIONMOTIVATIONWater resources related problems such as mapping of flood plains requirerealistic flow predictions. Accurate prediction of flows requires accurate representationof the hydrologic processes occurring in the system. An effective way to improve thisaccuracy is by employing spatially-distributed models. The advancement of computertechnology and the relative ease in the availability of spatial data has made it possible toefficiently process spatial data for deriving physical parameters needed by hydrologicmodels. The data visualization and analyzing capabilities of Geographic InformationSystems (GIS) present a convenient platform for hydrologic modeling. Currently, anumber of hydrologic models are interfaced with GIS. The principal tasks in suchmodels consist of discretization of the watershed system into units of uniform properties,extraction of hydrologic parameter information, and interfacing with hydrologic models.There are different formats in which the spatial data are available. The rasterbased representation has the structure of a grid in which each cell stores the value of theproperty it represents. For example, in a Digital Elevation Model (DEM), cells representelevation values. Another type of surface data representations is Triangulated IrregularNetwork (TIN) in which the surface is represented as a set of connected points forming1This thesis follows the style and format of Journal of Hydrologic Engineering.
2triangles. Apart from these surface based representations, the third type is the vectordata. Vector data is used to represent geographic objects that have shape and size.A hydrologic system consists of streams and their corresponding drainage areas.As these objects have shape and size, they are better represented in vector data format.This kind of data is derived from traditional paper maps, photographs or by surveys(Garbrecht et al. 2001). So, development of distributed models by employing vectorbased hydrologic information seems to be a good option because they represent the realworld objects. Additionally, inherent topology (i.e. connectivity and adjacencyinformation) that vectors possess and the existence of spatial relationships among them,make the vector - based environment very conducive for hydrologic modeling.Significant amount of resources have been devoted to developing models in theraster-based environment. Raster based techniques, though attractive and simple todevelop, have some limitations that have to do with the accuracy in determination ofdrainage patterns. More often than not, such surface models require vector data to beimposed on them to accurately delineate streams and their corresponding drainage areas(Neitsch et al. 2000). In the absence of such required vector data, high resolution rasterfiles are needed. The resolution enhancement in raster for better capturing the landscape,however, leads to computational challenges, resulting in diminished efficiency. On theother hand, vector data file size increase is not as dramatic upon betterment ofresolution, resulting in almost the same or reasonable computational speeds.
3The above stated reasons have been taken into account to propose thedevelopment of a distributed hydrologic model in the vector domain.1.2OBJECTIVESThe objectives of this thesis can be summarized as follows:1.Integrate stream and watershed vector data for hydrologic modeling2.Analyze watershed and stream networks3.Develop and implement a spatially-distributed flow routing model based onwatershed and stream network dataIntegration of stream and watershed data is a process of making data compatiblewith the model requirements such as orienting each stream line such that it flowstowards the outlet on a unique path, and solving problems resulting due to improperlocation of stream lines with respect to their drainage area polygons. In the hydrologicmodel, a network of lines is used for representing streams and a set of polygons for theircorresponding drainage areas. The model proposed imposes certain conditions, whichthe data have to cater to. Some of these conditions can be satisfied by using thetechniques explained, though it not always required applying them if the data iscompatible. Briefly summarizing the model data requirements;
41.The stream network should be dendritic in shape, which means that lines in thestream network should all be oriented such that the flows are directed towards theoutlet of the watershed, the stream network should be free of loops i.e. thereshould exist a unique flow path from every stream to the outlet.2.Each polygon representing a drainage area should be associated with one andonly one outlet stream.Inconsistencies recognized consisted of streams crossing over the drainagedivides, two streams posing to be potential outlets and some other problems. Thecorresponding remedial procedures have been developed to treat these datainconsistencies and make the data suitable for the hydrologic model.Once the data is made suitable for modeling, the next objective is that ofdetermining hydrologic topology and computing of relevant network parameters forstreams and sub-basins. Techniques for drainage area determination, flow lengthcalculation and drainage divide determination are presented. Also presented are theprocedures for network tracing.The final objective of thesis was to develop a distributed hydrologic model. Tocapture the spatial variability in the hydrologic properties of a watershed system, soils,and land use information were intersected with the sub-basins. The result was thedelineation of land units of uniform physical properties within each sub-basin called
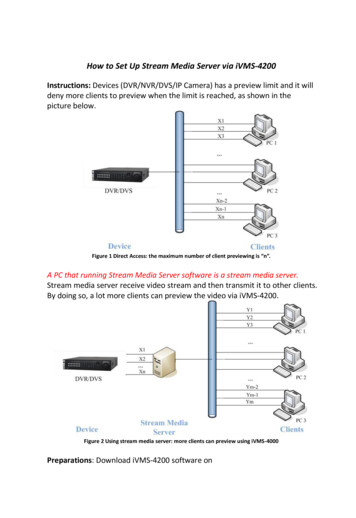
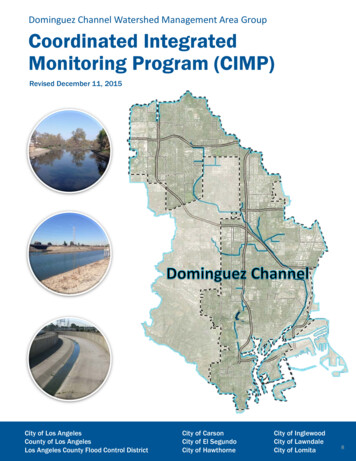
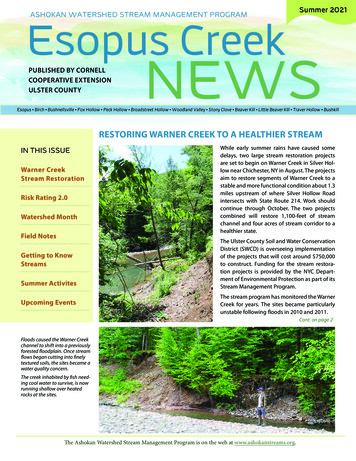
5sources. Though this model does not offer a way to compute losses due to infiltration,models like Green and Ampt could easily be coupled with this model to compute excessprecipitation. In a case study, to compute excess precipitation, Soil and WaterAssessment Tool (SWAT) was employed. An overland flow transport model wasdeveloped using a diffusion wave model called ‘Source-to-Sink’, to route the surfacerunoff depths generated at various sources to the respective sub-basin outlets as flows.To route these flows through the channels to the watershed outlet, the Muskingum andPure-lag method were used. Flow routing through reservoirs was achieved by employingthe Storage-Outflow technique.1.3STUDY AREATo evaluate the procedures developed, two case studies are presented. UnitedStates Geological Survey (USGS) has divided the United States into hydrologic units.There are 4 levels of classification. These classifications are based on the amount ofgeographic area covered in each unit. The first level of classification divides the nationinto 21 regions. Further these regions are divided into 222 sub regions, which are furtherdivided into 352 accounting units. Finally, these accounting units are further divided into2150 cataloging units. Region 12 as classified by USGS has been chosen as the firststudy area. For this region the watershed data was obtained from fourth levelclassification of United States by USGS. The corresponding streams data were extractedfrom National Hydrographic Dataset (NHD) (USGS, 2003b). NHD is a comprehensive
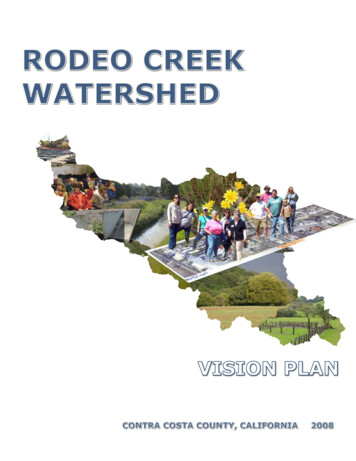
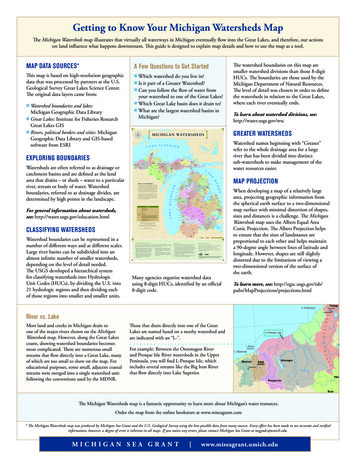
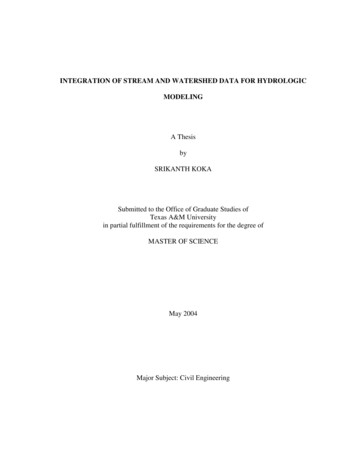
6digital spatial dataset that contains information about surface water features in theUnited States. The first case study was aimed at applying and validating the proceduresdealing with data inconsistencies, hydrologic topology and parameter calculation.FIG. 1.1. Study Area: Region 12A second case study is presented to show the application of hydrologic topology,network parameter computation techniques. The parameters thus obtained were thenused as input for the hydrologic model. Bull Creek watershed upstream of USGSgauging station number 08154700 located near loop 360 in North Austin, Texas, waschosen. The drainage area of the watershed at the gage station is 22.3 sq.miles. Thecorresponding stream and watershed data were delineated from 10m DEM obtained fromUSGS (USGS, 2003a). Soils data STATSGO (State Soil Geographic Data Base) wasobtained from United States Department of Agriculture (USDA, 2003). Land Useinformation was obtained from USGS, available as National Land Cover Data (NLCD).15 minute gage-adjusted radar rainfall estimates were obtained from NEXRAIN
7Corporation. The datasets mentioned in this section will be elaborately described later insection 4.FIG. 1.2. Study Area: Bull Creek Watershed1.4OUTLINEThe thesis consists of 6 sections. Section 1 presents the motivation, objectives,description of the case studies and a brief outline. Literature review which explains someof the methods previously developed and which are related to this thesis constitutessection 2. Section 3 gives an overview of various concepts and terminology related toGIS, GIS Data models, Component Object Models (COM). Various algorithmsdeveloped to treat the input data, procedures related to hydrologic network parametercalculation, overland and channel flow routing technique descriptions constitute section4. Section 5 describes the application and results of the models by employing two casestudies. Section 6 consists of conclusions.
82LITERATURE REVIEWThis section is divided into two parts. First part sheds light on hydrologic modelsof relevance to this thesis and the second part discusses about some GIS based methodsfor deriving hydrologic parameters needed for the hydrologic models.2.1HYDROLOGIC MODELSHydrologic models in general can be classified as lumped models or distributedmodels. In lumped models, spatial variability in hydrologic parameters or meteorologicalrelated data are not accounted for, meaning are averaged or assumed uniform over thesystem, whereas, in distributed models spatial variability is explicitly accounted byassuming uniformity over smaller modeling units by sub dividing the bigger systembased on physical properties. In most of the distributed hydrologic models, these unitsare delineated by combining topography, soil properties, land use properties and otherpertinent properties. Distributed models are especially useful, for example, when impactsof land use change are to be studied or for analyzing spatially varying flood responses.As the topic of distributed modeling is of importance to this thesis, a discussion ofrelated back ground is provided.
92.1.1HEC-HMS (Hydrologic Modeling System)HMS is a comprehensive hydrologic model developed by HydrologicEngineering Center (HEC) of United States Army Corps of Engineers (USACE). It is anevent – based overall lumped model (HEC, 2000). HMS offers several options to modelvarious physical processes occurring in a watershed system. One such process is thedirect runoff computations. Most of runoff models available with HMS are lumped innature except for two which are distributed. Most of the lumped runoff models derivetheir roots from the Unit Hydrograph (UH) concept.This model provides a lumped model option called Clark’s UH. To overcome itslumped character, a modified version called ModClark method was developed for HMS(Daniel and Arlen 1998). ModClark’s method requires that watershed be further dividedinto sub-areas by intersecting it with a grid. Each of these sub-areas is assignedindividual lag time, instead of one value for the whole watershed, as in the case ofClark’s UH. The precipitation excess at each sub-area is transported to the watershedoutlet using the corresponding lag time. Thus the inflow contributions due to all the subareas to linear reservoir are computed. These flows are then routed through a linearreservoir (only a single value for storage coefficient being defined for all the sub areas)to obtain the hydrograph at the outlet, which will later be routed through the channels.ModClark’s technique though tries to overcome the lumped character of Clark’s UH, hascertain limitations. The limitations that have been recognized are:
101)It is not a physically based model.2)Dispersion effects that occur along the flow path are not captured, because themodel assumes one single linear reservoir for the whole watershed.2.1.2SWAT (Soil and Water Assessment Tool)SWAT was developed by USDA-ARS (Agriculture Research Service).Prediction of impacts of land management practices on water, sediment and agriculturalchemical yields was the aim for the development of this physically based model. SWATsimulates complete hydrologic cycle of a watershed system. “The hydrologic cycle issimulated in two phases: land phase and routing phase. The land phase hydrologycontrols the amount of water, sediment, nutrient and pesticide loadings. The routingphase consists of defining the movement of water, sediments, etc through the channelnetwork of the watershed” (Neitsch et al. 2000). As overland flow computation of theland phase is of importance to this thesis, a discussion of the techniques employed inSWAT is provided.To capture heterogeneity in physical properties the basin is divided into subbasins, each one of them corresponding to a stream and then the sub-basins arediscretized into sub-areas called HRUs, which are unique in terms of soils and land use.Physical processes modeled in SWAT can be classified based on the scale (i.e. sub-basinor HRU) assumed for lumping. For example, the precipitation input in SWAT can be
11provided only at the sub-basin level, whereas, runoff computations can be done at HRUlevel. The Green-Ampt infiltration method is one of the options that this model offers tocompute excess precipitation at the HRU level, the other one being NCRS curve numbermethod. Though the excess precipitation values are computed at the HRU level, anaverage of excesses over the sub-basin is assumed for overland flow computations. Theoverland flow routing model assumes a linear reservoir scheme. The equationcorresponding to this scheme is given by:Qsurf ( Q 'surf Qsurf , i 1) . 1 exp surlagtconc(2.1)Where, Qsurf is the amount of surface runoff discharged to the main channel on agiven time step (mm H2O), Q 'surf is the amount of surface runoff generated in thesubbasin on a given time step (mm H2O), Qsurf , i 1 is the surface runoff stored or laggedfrom the previous time step (mm H2O), surlag is the surface runoff lag coefficient, andtconc is the time of concentration for the subbasin (hrs).The runoff model incorporated in SWAT is lumped at the sub-basin level,because it computes an average value for spatial varied surface runoff. This is one of thelimitations of the SWAT model. To take the advantage of the distributed nature ofsurface runoff, this thesis explains a methodology that could be extended to this model,which will enhance the capabilities of handling overland flows. Such an extension couldmake the SWAT model work at any time step as assigned by the user, noting that
12presently SWAT model works only at daily time step. Another advantage that can bederived by employing a distributed model is quantifying the effectiveness of BestManagement Pract
1. Integrate stream and watershed vector data for hydrologic modeling 2. Analyze watershed and stream networks 3. Develop and implement a spatially-distributed flow routing model based on watershed and stream network data Integration of stream and watershed data is a process of making data compatible