Transcription
Vibration Analysis forMachinery Health Diagnosis
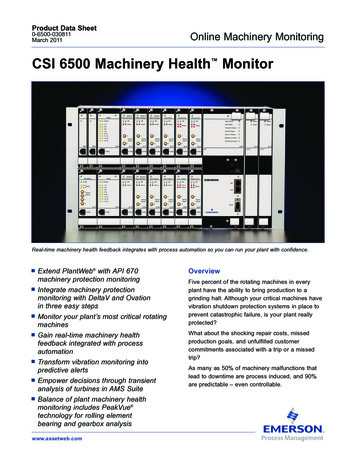
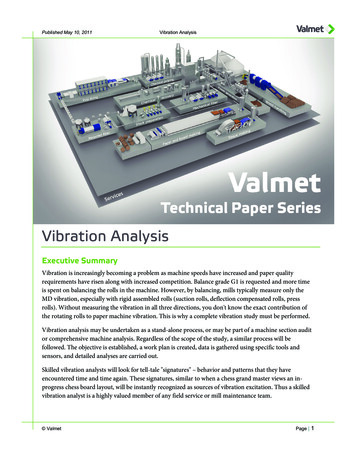
How Vibration Data is Gathered and Processed for AnalysisVibration analysis can identify theseand other problems: Imbalance Flow problems Belt problems Lubrication problems Resonance Gear problems looseness Oil whirl Rubs Vane pass Oil whip Cavitation Blade Pass Misalignment Pipe strain Electrical problems Rolling elementbearing defects Sleeve bearing problemsFacts About Vibration Vibration is movement relative to a reference position, such asthe center line of a shaft on rotating equipment Vibration is a result of an excitation force or forcing function andmay be either random or periodicWhen evaluating any machine’s health, the analyst should:1. Visually inspect each machine for overall condition whileonsite collecting data. Look for things such as leaking seals andother damaged or incomplete components, cracked welds,deterioration in the grouting, missing clamps and hold-downs.2. Ensure that the turning speed (TS) can be identified at themeasurement point location before any critical measurementis taken.3. Once TS is identified, determine TS harmonic relationships.4. When harmonics of TS are determined, other vibration peaks ofinterest and other harmonic relationships may be identifiedfor analysis.Line FrequenciesLine frequency related peaks commonly exist on every AC drivenmachine and are present to some extent at 2x of line frequency.For more discussion of electric motor issues, see Electric MotorProblems and Diagnostic Techniques.FFT Signal Processing Vibration analysis can often pinpoint a failing element of arotating machine in time to avoid catastrophic failure and costlyreplacement of machinery as well as lengthyproduction interruptions Each machine fault generates a specific vibration pattern. The frequency of the vibration is determined by the machinegeometry and operating speed A single vibration measurement provides information aboutmultiple componentsCaptured Waveform3Resulting Spectrum
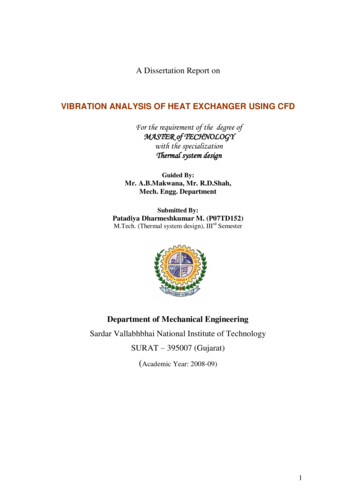
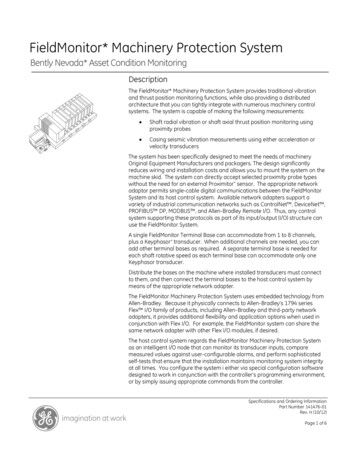
Vibration Plot TypesBoth spectrum and waveform provide useful data. Machinery faults often occur at specific frequencies and are most easily identified in thespectrum. Trend plots show changes in a measurement over time.The Time Waveform shows random events,periodic events and imapctingCircle Plot or Roll Profile PlotCascade spectrum plot showsresonance over time, such as duringa startupBasic Trend Plot displays growing defect and result ofmaintenance actionUnfiltered Orbit Plot1x Filtered Orbit Plot4
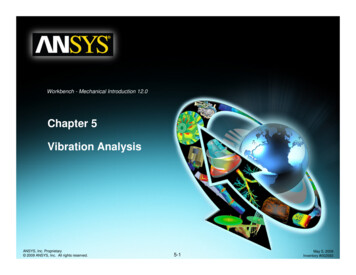
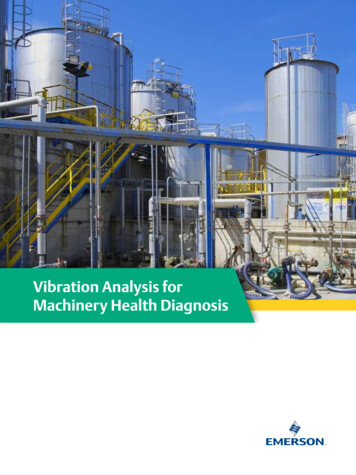
Transducer Mounting (Vibration Sensors) Stud mounting is preferred but common only with inaccessiblesituations and online systems More care is necessary when mounting higher frequencyrange accelerometers Adhesive mounting is second in performance tostud mounting Magnetic mounting is most commonly used forroute-based monitoring Hand-held probes yield poorest performance and are notrecommended but are sometimes necessary because of accessrestrictions or safety concernsTypical displacement probe mounting on a large sleeve bearingResonanceEvery machine will vibrate when excited by a forcing function.Each machine has one or more natural or resonant frequencies.When any forcing function is near the natural frequency, theresulting vibration will be significantly amplified and could causepremature failure.A critical speed occurs when the rotating element is turning ata speed which excites resonance in the machine. Many times aforcing function (such as from a rotating shaft) excites a resonancefrequency in another part of the same or nearby machine. Thisresonance frequency may be identified by an impact test, typicallywhen the machine is ff; the machine structure may be “rung” likea bell. Changing a structure’s stiffness, mass, damping, operatingspeed and/or reduction of the forcing function will affect theresonance issue and may help solve the problem. Resonance isbecoming more of a problem in industry because: New equipment is often built lighter More variable speed machinery is being used in industry Machines are now often run at higher speeds without properlyconsidering natural or resonant frequencyof equipment5Typical magnetic mounting of accelerometer
Analysis of the vibration spectrum can bedivided into 3 areas:Sub-synchronous is less than 1x turning speed (TS) of the shaft andcan identify problems with: belts, oil whirl/whip, rubs,loose roller bearing in housing, cage or train frequency of antifrictionbearing, primary belt frequency, defective tooth-to-tooth repeatfrequency, surge, ignition or fuel problem on reciprocating source.Non-synchronous is not equal to any multiple of TS of the shaft andcan identify problems with: rolling element defects, electrical, othercomponents in the machine, one or more system resonances, belts,noise, cavitation, other unusual sources, background vibration, pipe,strain lubrication fault.MisalignmentVelocitySynchronous is a 1x turning speed (TS) of the shaft and exactmultiple integers of TS (energy is said to be “phase locked” toTS) and can identify problems with: imbalance, misalignment,looseness, bent shaft, vane/blade pass, gear mesh, belt sheave pitchline runout, broken gear tooth, sleeve bearing, resonance.ImbalanceFrequency Banding allowsalarms to be created fordifferent fault types.LoosenessBearing Band 1Bearing Band 2Electrical faults occur as a multiple of the frequency of thesupply/current.Typical Sensors, Sensor Units and Applications for Vibration AnalysisUnits*Probe TypeMetricEnglishFrequency Range andTypical ApplicationDisplay Units for PlottingDisplacementNon-contact eddy current probe(requires signal converter)µ Pk-PkMils Pk-Pk0-1kHz. Permanently orsemi-permanently mounted.Measures shaft vibration relativeto machine casing. Commonlyused on turbo machineryDisplacement enhances lowfrequency and is ma measure ofmotion expressed in thousandthsof an inch (1 mil – 0.001”) or inmetric unitsVelocitySpring-loaded mass, sensitiveto heat and humidity (no powerrequired)Mm/s(RMS)In/s(Peak)10Hz-1kHz. Accuracy dependenton temperature, humidity andposition. Displays low and highfrequency data equallyVelocity displays low and highfrequency data equally and is ameasure of speed expressed Iinches per second or metric unitsper secondAccelerationPiezoelectric crystal, extremelyrobust (requires external power)Peak g’sPeak g’s0.5Hz-60kHz depending ondesign and mounting. 10Hz-3kHztypical. Very robust design. Idealfor monitoring rolling elementbearings and gear boxesAcceleration enhances highfrequency data and is a measureof the rate of change of speed (1g386 in/sec squared or metric units/second squared)* These are typically accepted units, but may be user defined.6
Imbalance and MisalignmentImbalance is the condition of a rotatingcomponent where the center of rotation is notthe same as the center of mass.Common causes of imbalance: Material buildup Wear Little or no turningspeed harmonics Broken or missing parts Simple, sinusoidal,periodic waveform Improper assembly orpoor design One event pershaft revolution Thermal distortions Little or no impacting Turning speed peakamplitude increases withincrease in speed Presence of significant turningspeed harmonics suggestsother or additional defects(looseness, etc.) Little axial energy except withoverhung machinesImbalance vibration is always 1 x TSMisalignment is when rotational center lines ofcoupled shafts are not collinear.High 2xTS peak characterizes offset misalignment; a high 1xTSsignifies angular misalignment, though both frequently combine tocause1xTS and 3xTS in the spectrum. Highest amplitudes typicallyoccur in the radial direction for horizontally mounted equipment;overhung motors may exhibit higher amplitudes in the axial plane.Velocity waveform for misalignment is very periodic and repetitivewith one or two peaks (events) per revolution. Offset amplitudestypically appear higher in the radial plane; angular misalignmentamplitudes typically appear higher in the axial plane.Mechanical LoosenessLooseness is characterized by harmonics of TS with raised noisefloor. Waveform displays random impacting which may be in anon-repetitive irregular pattern. Highest amplitudes typically occurin the radial direction, specifically the vertical plane for horizontallymounted equipment.The number of turning speed harmonics and their amplitudesincrease with the severity of the problem. Unstable phasecharacterizes looseness.Fractional harmonics (1/4, 1/3, ½, ¾) may appear due to looseness.7Angular problemCenters of rotation areoffsetA combination of theseproblems is most common
Belt DefectsWorn or mismatched belts produce sub-synchronous andsometimes non-synchronous peaks and harmonics. The 2x beltfrequency typically dominates, and multiples of the 2x appearthroughout the spectrum, because the defective belt passes over2 sheaves. The highest amplitudes typically occur in the radialdirection, specifically in line with the belts. To resolve belt frequency in the spectra, it is necessary that thetime block of data includes at least 6 revolutions of the belt(further references are available in The Simplified Handbook ofVibration Analysis by Art Crawford An eccentric sheave produces radial vibration at 1xTSof the sheave Misaligned sheaves create axial vibration at 1xTS of the sheave8
Antifriction Bearing FaultsAn imperfection in one or more of the contact surfaces of anantifriction or rolling element bearing is called a defect. The problemmay be invisible even under a microscope, and may be morecomplex than a simple imperfection.Antifriction bearing problems are a major source of failure inindustrial machinery.Bearing spectrum characteristics:Commonly first appear as high-frequency/low-amplitudenon-synchronous peaks. Harmonics of the non-synchronous peaksoften show turning speed sidebands appearing around the racedefect frequency.Broad energy “mounds” or “grass” indicate advanced degradation.Some common causes of bearing defects or premature failure: Excessive orinadequate lubrication Improper mounting methods Improper application Excessive load Age of bearing Improper storage & handling Manufacturing defects Excessive vibration beforeand/or after installationBearing defect frequencies will usually appear in this order(highest to lowest): BPFI(Ball Pass Frequency Inner) BSF(Ball Spin Frequency) BPFO(Ball Pass Frequency Outer) FTF(Fundamental eView the spectrum in acceleration to see the high frequency peaks.High frequency vibration analysis can detect lack of lubrication.The following frequencies can be approximated with thefollowing formulae: BPFO # of rollers x shaft TS x BPFI # of rollers x shaft TS x0.6 (approx.)0.4 (approx.)Typical waveform characteristics: Periodic butnon-sinusoidal impacting Excessive “g swing” withsharp impacting spikes oftenresembling an anglefish pattern9 Periodic characteristicdiminishes withadvanced degradationFor rolling element defects, cage frequency sidebands are typicallydisplayed in a spectrum centered around 1 or 2 times BSF faultfrequency as illustrated in the plots above. These sidebands arecaused by the defect passing in and out of the load zone at the TS ofthe cage. The associated waveform displays modulation at the cageTS which appears as sidebands in the spectrum.
An outer race defect normally shows little or no modulation inthe waveform, thus no sidebanding about the BPFO frquenciesin the spectrum.Running speed sidebands are typically displayed in an innerrace defect spectrum about BPFI frquencies as illustrated in theplot. These sidebands are caused by the defect passing in andout of the load zone at the shaft. The associated waveform displays modulation which appears as sidebands in the spectrum.These plots demonstrate an advancing fault. The trend shows a deteriorating bearing defect. As it advances, increased high-frequency broadbandenergy indicates rapid deterioration exhibited in the waveforms.Bearing ID InterpretationBearings are built to world standards, ensuring consistent availability worldwide. Because most motor bearings are listed on motors tagsas AFBMA or ABMA numbers, you may be able to calculate the common bearing number from the equipment nameplate. Identificationresources are available from:Interchange, Inc.PO Box 234Champlin MN 55316-0234800.669.6208Fax 800.729.0395 or einc.com10
Gear Boxes and DefectsGears rotating together at a common tangent create gear mesh.Data collection on gear boxes can be challenging. Defects mayinclude misalignment, chipped or broken teeth, looseness, stressfractures, and worn gears or bearings.Gear box waveform characteristics: Gear mesh will appear (impacting indicates a problem). Sincegear boxes are naturally energetic due to the gears meshing,trending is very helpful Very busy waveform Pulses appear once per revolution with cracked or broken toothGear Mesh Frequency (GMF) Rotation Speed (in Hz) X # ofGear TeethFor example, a gear is rotating at 10 Hz with 72 teeth.GMF 10Hz X 72 720 HzCauses of premature gear box failure include: Improper lubrication Overheating Wrong application Poor design or manufacture Bearing failure Seal failure Water intrusionGear box spectrum characteristics: GMF will commonly exist and appears as high frequencysynchronous peaks Defects can display harmonics of GMF and/or turningspeed sidebands Sideband amplitudes will normally increase ascondition deterioratesGear Monitoring Tips Gear mesh energy normally appears regardless of gearconditions; amount of energy depends on gear configurationand load Increase of gear mesh harmonics are an indication of normaluniform wear Eccentric wear generates sidebands; frequency of the sidebandsare related to the problem gear An increase in amplitudes of gear mesh sidebandsindicates problems Spacing between sideband peaks can indicate which gear is bad
Vibration analysis can often pinpoint a failing element of a rotating machine in time to avoid catastrophic failure and costly replacement of machinery as well as lengthy production interruptions Each machine fault generates a specific vibration pattern. The frequency of the vibration is determined by the machine geometry and operating speed A single vibration measurement provides information .