Transcription
Beginning VibrationAnalysiswithBasic FundamentalsBy: Jack Peters
Beginning VibrationIntroductionUnderstanding the basics and fundamentals of vibration analysis arevery important in forming a solid background to analyze problems onrotating machinery.Switching between time and frequency is a common tool used foranalysis. Because the frequency spectrum is derived from the data inthe time domain, the relationship between time and frequency is veryimportant. Units of acceleration, velocity, and displacement aretypical. Additional terms such as peak-peak, peak, and rms. are oftenused. Switching units correctly, and keeping terms straight is a must.As much as possible, this training will follow the criteria as establishedby the Vibration Institute.Jack D. Peters2
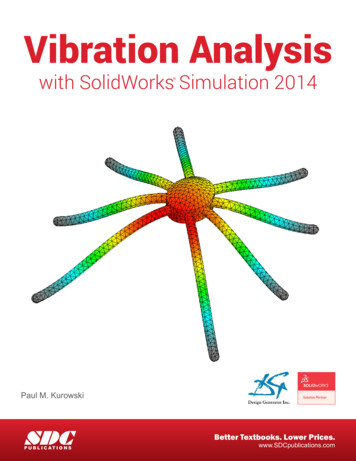
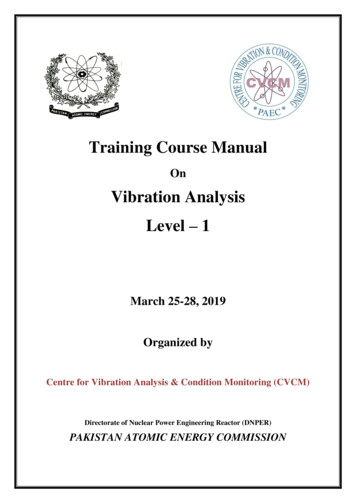
Mass & StiffnessMass & StiffnessAll machines can be broken downinto two specific categories.Mass & StiffnessMass is represented by an objectthat wants to move or rotate.Stiffness is represented by springsor constraints of that movement.Jack D. Peters3
Mass & StiffnessMass & Stiffnessfn 1/2П k/mWhere:fn natural frequency (Hz)k stiffness (lb/in)m massmass weight/gravityweight (lb)gravity (386.1 in/sec2)Jack D. Peters4
Mass & StiffnessConcept !fn 1/2П k/mIf k increasesThen f increasesIf k decreasesThen f decreasesJack D. Peters5
Mass & StiffnessConcept !fn 1/2П k/mIf m increasesThen f decreasesIf m decreasesThen f increasesJack D. Peters6
SpectrumWhat’s This ?10.0002inchPeakMagnitude00 HzJack D. Peters100 Hz7
SpectrumFFT, Frequency Spectrum, Power Spectrum10.0002inchPeakMagnitude00 HzJack D. Peters100 Hz8
SpectrumScaling X & Y10.0002inchPeakYMagnitude00 Hz100 HzXJack D. Peters9
SpectrumScaling X & YAM10.0002inchPeakPLIMagnitudeTUDEJack D. Peters00 Hz100 HzFREQUENCY10
SpectrumScaling X & Y1HowBad0.0002inchPeakMagnitudeIsItJack D. Peters00 Hz100 HzWhat is it11
Time WaveformWhat’s That ?10.0004inchReal-0.00040 sJack D. Peters7.996094 s12
Time WaveformTime Waveform10.0004inchReal-0.00040 sJack D. Peters7.996094 s13
Time WaveformScaling X & Y10.0004inchYReal-0.00040 s7.996094 sXJack D. Peters14
Time WaveformScaling X & YAM10.0004inchPLIRealTUD-0.0004EJack D. Peters0 sTIME7.996094 s15
Time WaveformScaling X & YHowBad10.0004inchRealIsIt-0.0004Jack D. Peters0 sWhat is it7.996094 s16
Time WaveformScaling X & Y1HowBad0.0004inchRealIsIt-0.0004Jack D. Peters0 s1 sWhat is it17
Time & FrequencyDouble Trouble10.0002inchPeakMagnitude00 Hz100 Hz10.0004inchReal-0.00040 sJack D. Peters7.996094 s18
The X ScaleThe X ScaleJack D. Peters19
The X ScaleHertz (Hz)One Hertz (Hz) is equal to 1 cycle / secondIt is the most common term used in vibrationanalysis to describe the frequency of a disturbance.Never forget the 1 cycle / second relationship !Traditional vibration analysis quite often expressesfrequency in terms of cycle / minute (cpm). This isbecause many pieces of process equipment haverunning speeds related to revolutions / minute (rpm).60 cpm 1 cps 1 HzJack D. Peters20
The X ScaleRelationship with TimeThe frequency domain is an expression of amplitudeand individual frequencies.A single frequency can be related to time.F(Hz) 1 / T(s)The inverse of this is also true for a single frequency.T(s) 1 / F(Hz)Keep in mind that the time domain is an expressionof amplitude and multiple frequencies.Jack D. Peters21
The X ScaleConcept !If:F 1/T and T 1/FThen:FT 1Jack D. Peters22
The X ScaleConcept !FT 1If:F increasesThen: T decreasesIf:T increasesThen: F decreasesJack D. Peters23
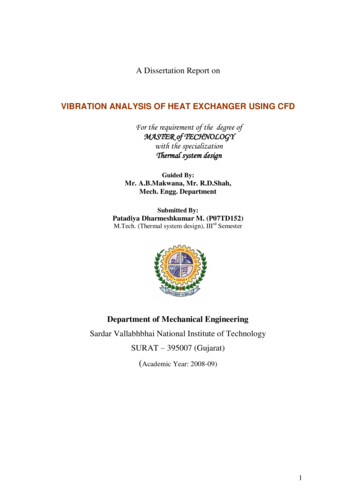
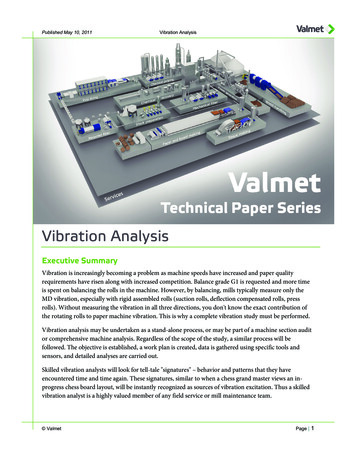
The X ScaleSingle FrequencyX:55 HzPwr Spec 1Y:706.8129 mV1VrmsMagnitude00 HzX:27.00806 msdX:18.18848 msTime 1100 HzY:3.579427 mVdY:2.449082 mV1VReal-10 sJack D. Peters62.46948 ms24
The X ScaleMultiple FrequenciesX:55 HzPwr Spec 1Y:706.8129 mV10 HzX:78 HzPwr Spec 1100 HzY:706.9236 mV10 HzX:21 HzPwr Spec 1100 HzY:706.7825 mV10 HzX:42 HzPwr Spec 1100 HzY:706.9266 mV10 HzJack D. Peters100 Hz25
The X ScaleMultiple TimeTime 55 11V0 s62.46948 msTime 78 11V0 s62.46948 msTime 21 11V0 s62.46948 msTime 42 11V0 sJack D. Peters62.46948 ms26
The X ScaleReal Life Time55 78 21 42 Trouble !TIME 14VReal-40 sJack D. Peters62.46948 ms27
The X ScaleFrequency SpectrumTIME 14VReal-40 sX:21 HzX:42 HzX:55 HzX:78 HzFREQUENCY 162.46948 msY:706.7825 mVY:706.9266 mVY:706.8129 mVY:706.9236 mV1Vrms0 HzJack D. Peters100 Hz28
The X ScaleAmplitudeThe Most Copied Slide in the History of Vibration Analysis !InputTimeWJack D. PetersTimeaveformFrncyeueqtrumceSp29
The X ScaleLines of ResolutionThe FFT alwayshas a definednumber of linesof resolution.100, 200, 400,800, 1600, and3200 lines arecommonchoices.Jack D. Peters10.0002inchPeakThis spectrumhas 800 lines, orthe X scale isbroken down into800 points.Magnitude00 Hz100 Hz30
The X ScaleFilter Windows Window filters are applied to the timewaveform data to simulate data thatstarts and stops at zero. They will cause errors in the timewaveform and frequency spectrum. We still like window filters !Jack D. Peters31
The X ScaleWindow ComparisonsJack D. Peters32
The X ScaleFilter Windows Hanning (Frequency)Flat Top (Amplitude)Uniform (No Window)Force Exponential(Frequency Response) Force/Expo Set-upHanning 16% Amplitude ErrorFlat Top 1% Amplitude ErrorWindow functions courtesy of Agilent“The Fundamentals of Signal Analysis”Application Note #AN 243Jack D. Peters33
The X ScaleFilter Windows Use the Hanning Window for normalvibration monitoring (Frequency) Use the Flat Top Window for calibrationand accuracy (Amplitude) Use the Uniform Window for bumptesting and resonance checks (NoWindow)Jack D. Peters34
The X ScaleMinimum Derived HzThe minimum derived frequency is determined by:Frequency Span / Number of Analyzer Lines (data points)The frequency span is calculated as the endingfrequency minus the starting frequency.The number of analyzer lines depends on the analyzerand how the operator has set it up.Example: 0 - 400 Hz using 800 linesAnswer (400 - 0) / 800 0.5 Hz / LineJack D. Peters35
The X ScaleBandwidthThe Bandwidth can be defined by:(Frequency Span / Analyzer Lines) Window FunctionUniform Window Function 1.0Hanning Window Function 1.5Note: More discussionlater on window functionsfor the analyzer !Flat Top Window Function 3.5Example: 0 - 400 Hz using 800 Lines & Hanning WindowAnswer (400 / 800) 1.5 0.75 Hz / LineJack D. Peters36
The X ScaleResolutionThe frequency resolution is defined in the followingmanner:2 (Frequency Span / Analyzer Lines) Window FunctionorResolution 2 (Bandwidth)Example: 0 - 400 Hz using 800 Lines & Hanning WindowAnswer 2 (400 / 800) 1.5 1.5 Hz / LineJack D. Peters37
The X ScaleUsing ResolutionThe student wishes to measure two frequencydisturbances that are very close together.Frequency #1 29.5 Hz.Frequency #2 30 Hz.The instructor suggests a hanning window and 800 lines.What frequency span is required to accurately measurethese two frequency disturbances ?Jack D. Peters38
The X ScaleUsing ResolutionResolution 30 - 29.5 0.5 Hz / LineResolution 2 (Bandwidth)BW (Frequency Span / Analyzer Lines) Window FunctionResolution 2 (Frequency Span / 800) 1.50.5 2 (Frequency Span / 800) 1.50.5 3 (Frequency Span) / 800400 3 (Frequency Span)133 Hz Frequency SpanJack D. Peters39
The X ScaleData Sampling TimeData sampling time is the amount of time required to takeone record or sample of data. It is dependent on thefrequency span and the number of analyzer lines being used.TSample Nlines / FspanUsing 400 lines with a 800 Hz frequency span will require:400 / 800 0.5 secondsJack D. Peters40
The X ScaleAverage & Overlap Average - On Overlap Percent - 50%TR#1 TR#2 TR#3FFT#1FFT#2FFT#30% Overlap50% OverlapTR#1How long will it take for 10averages at 75% overlapusing a 800 line analyzer anda 200 Hz frequency span?TR#2TR#3FFT#1FFT#2FFT#3Jack D. Peters41
The X Scale75% Overlap ? 10 Averages75% Overlap800 Lines200 HzAverage #1 800 / 200Average #1 4 secondsAverage #2 - #10 (4 x 0.25)Average #2 - #10 1 secondeachTotal time 4 (1 x 9)Total time 13 secondsJack D. Peters42
The Y ScaleThe Y ScaleJack D. Peters43
The Y ScaleAmplitudeThe “Y” scale provides the amplitude value for eachsignal or frequency.Default units for the “Y” scale are volts RMS.Volts is an Engineering Unit (EU).RMS is one of three suffixes meant to confuse you !The other two are:(Peak) and (Peak - Peak)Jack D. Peters44
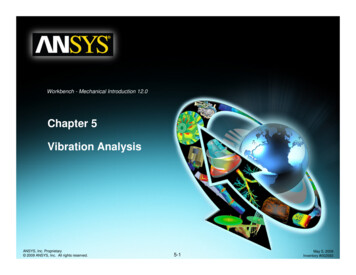
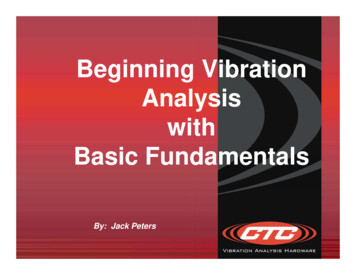
The Y ScalePk-Pk (Peak - Peak)The Peak - Peak valueis expressed from thepeak to peak amplitude.X:55 HzPwr Spec 1Y:1.999169 V2VPk-PkMagnitude00 HzThe spectrum valueuses the suffix “Pk-Pk”to denote this.X:22.43042 msdX:9.094238 msTime 1100 HzY:-993.8563 mVdY:1.994871 V1VReal-10 sJack D. Peters62.46948 ms45
The Y ScalePk (Peak)The time wave has notchanged. The Peakvalue is expressedfrom zero to the peakamplitude.The spectrum valueuses the suffix “Peak”to denote this.Jack D. PetersX:55 HzPwr Spec 1Y:999.5843 mV1VPeakMagnitude00 HzX:27.00806 msdX:4.516602 msTime 1100 HzY:3.579427 mVdY:997.4356 mV1VReal-10 s62.46948 ms46
The Y ScaleRMS (Root Mean Square)The time wave hasnot changed. TheRMS value isexpressed from zeroto 70.7% of the peakamplitude.The spectrum valueuses the suffix“RMS” to denote this.Jack D. PetersX:55 HzPwr Spec 1Y:706.8129 mV1VrmsMagnitude00 HzX:27.00806 msdX:2.288818 msTime 1100 HzY:3.579427 mVdY:709.1976 mV1VReal-10 s62.46948 ms47
The Y ScaleSuffix ComparisonX:27.00806 msdX:2.288818 msTime 1RMSY:3.579427 mVdY:709.1976 mMagnitudeReal00 sX:27.00806 msdX:4.516602 msTime 162.46948 msX:55 HzPwr Spec 1100 HzY:999.5843 mV2VPeak1VMagnitudeReal00 sX:22.43042 msdX:9.094238 msTime 10 Hz62.46948 msY:-993.8563 mVdY:1.994871 VX:55 HzPwr Spec 1100 HzY:1.999169 V2VPk-Pk1VMagnitudeReal0-10 sJack D. Peters0 HzY:3.579427 mVdY:997.4356 m-1Peak - PeakY:706.8129 mV2Vrms1V-1PeakX:55 HzPwr Spec 162.46948 ms0 Hz48100 Hz
The Y ScaleChanging SuffixesMany times it is necessary to change between suffixes.Pk-Pk / 2 PeakPeak x 0.707 RMSRMS x 1.414 PeakPeak x 2 Pk-PkJack D. Peters49
The Y ScaleStandard SuffixesNow that we have learned all about the threestandard suffixes that might possibly confuse the“Y” scale values, what is the standard ?Vibration Institute:Displacement mils Peak - PeakVelocity in/s Peak or rms.Acceleration g’s Peak or rms.Note: 1 mil 0.001 inchesJack D. Peters50
The Y ScaleEngineering Units (EU)Engineering units are used to give meaning to theamplitude of the measurement.Instead of the default “volts”, it is possible to incorporatea unit proportional to volts that will have greatermeaning to the user.Examples:Jack D. Peters100 mV / g20 mV / Pa1 V / in/s200 mV / mil50 mV / psi10 mV / fpm33 mV / %10 mV / V51
The Y ScaleEU’s the Hard WaySometimes we forget to use EU’s, or just don’t understand howto set up the analyzer.There is no immediate need to panic if ?You know what the EU is for the sensor you are using.Example: An accelerometer outputs 100 mV / g and there is a10 mV peak in the frequency spectrum.What is the amplitude in g’s ?Answer 10 mV / 100 mV 0.1 gJack D. Peters52
The Y ScaleThe Big Three EU’sAccelerationVelocityDisplacementJack D. Peters53
The Y ScaleConverting the Big 3In many cases we are confronted with Acceleration,Velocity, or Displacement, but are not happy with it.Maybe we have taken the measurement inacceleration, but the model calls for displacement.Maybe we have taken the data in displacement, butthe manufacturer quoted the equipmentspecifications in velocity.How do we change between these EU’s ?Jack D. Peters54
The Y Scale386.1 What ?1g 32.2 feet/second232.2 feet2secondX12 inchesfoot386.1 inches/secondgJack D. Peters255
The Y ScaleGo With The Flow I 386.1Acceleration (g’s)x 386.1 2(Pi)fx 2(Pi)fVelocity (inch/s) 2(Pi)fx 2(Pi)fDisplacement (inch)Jack D. Peters56
The Y ScaleMetric Go With The Flow I 9807Acceleration (g’s)x 9807 2(Pi)fx 2(Pi)fVelocity (mm/s) 2(Pi)fx 2(Pi)fDisplacement (mm)Jack D. Peters57
The Y ScaleGo With The Flow IIPeak - Peak 2x2Peakx .707x 1.414RMSJack D. Peters58
The Y ScaleDoing the Math Units0.5g x 386.1 inchessecond2gThere is a 0.5 gvibration at 25 Hz.What is the velocity ?2π x 25 cyclessecond0.5g x 386.1 inchesg second2x1 second2π x 25 cycles0.5 x 386.1 inches2π x 25 cycles secondcycle1.23 inches/secondJack D. Peters59
The Y ScaleAcceleration - VelocityExample: Find the equivalent peak velocity for a 25 Hzvibration at 7 mg RMS ? (g x 386.1) / (2 Pi x F) (0.007 x 386.1) / (6.28 x 25) 0.017 inches / second RMSAnswer 0.017 x 1.414 0.024 inches / second PkJack D. Peters60
The Y ScaleVelocity - DisplacementExample: Find the equivalent pk-pk displacement for a25 Hz vibration at 0.024 in/s Pk ? Velocity / (2 Pi x F) 0.024 / (6.28 x 25) 0.000153 inches PkAnswer 0.000153 x 2 0.000306 inches Pk-PkJack D. Peters61
The Y ScaleAcceleration - DisplacementExample: Find the equivalent Pk-Pk displacement for a52 Hz vibration at 15 mg RMS ? (g x 386.1) / (2 Pi x F)2 (0.015 x 386.1) / (6.28 x 52)2 0.000054 inches RMSAnswer (0.000054 x 1.414) 2 0.000154 inches Pk-PkJack D. Peters62
SensorsSensorsJack D. Peters63
SensorsAccelerometers Integrated Circuit¾Electronics inside¾IndustrialJack D. Peters Charge Mode¾ Charge Amplifier¾ Test & Measurement64
SensorsAccelerometer Advantages Measures casing vibrationMeasures absolute motionCan integrate to Velocity outputEasy to mountLarge range of frequency responseAvailable in many configurationsJack D. Peters65
SensorsAccelerometer Disadvantages Does not measure shaft vibration Sensitive to mounting techniques andsurface conditions Difficult to perform calibration check Double integration to displacement oftencauses low frequency noise One accelerometer does not fit allapplicationsJack D. Peters66
01.12.2014 · Beginning Vibration 2 Introduction Understanding the basics and fundamentals of vibration analysis are very important in forming a solid background to analyze problems on rotating machinery. Switching between time and frequency is a common tool used for analysis. Because the frequency spectrum is derived from the data in