Transcription
Fordham andUniversity HeightsBRONXCOMMUNITYDISTRICT5Including Morris Heights, Mount Hope, South Fordham and University HeightsHealth is closely tied to our daily environment. Understanding howour neighborhood affects our physical and mental health is the firststep toward building a healthier and more equitable New York City.COMMUNITY HEALTH PROFILES 2018COMMUNITY HEALTH PROFILES 2018: FORDHAM AND UNIVERSITY HEIGHTS1
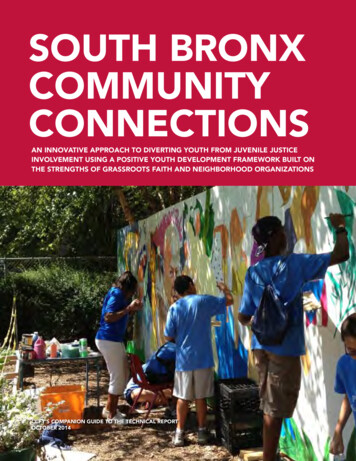
HFAMALL OET FER83AVERHARLEMNew York CityNew York City100.087.575.062.550.037.525.012.50.0NYC population by racePAGE 245.045.0POPULATION22.5BY AGE29% 32%Asian22%Black22.5Latino45.02%22.5White0.0 Other0.0NYC population by age 0.00-1718-2425-44Born outside USHAVE ,537,673Blackby raceNYC 5.021%32%Other32%62.550.025%25% 14%37.521%21%9% Asian27%25.014%12.59% White2% n Black45-6465 45-6465 45-6465 37%65 18-24BlackPopulationLatino by raceLatinoBlack2%Asian 27%WhiteAsianBlackLatino %6065 8%45-6425-44White6Elementary School AbseenteeOther28%28%12%0.01%65 45-6465 30outside proficiencyEnglish proficien042%Highest Level of Education Achiev65 English proficiencyEnglish proficiencyBorn outside USPAGE 820Non-fatal Assault Hospitalizations36%23%PAGE 8PAGE 8 White, Black, Asian and Other exclude Latino ethnicity. Latino is Hispanic or Latino of any race.Note: Percentages may not sum to 100% due to rounding.Non-fatal Assault 08004080040801201605002001002040605120160COMMUNITY HEALTH PROFILES 2018: FORDHAM AND1000UNIVERSITY HEIGHTS015Non-fatal Assault urces: Population, Race and Ethnicity and Age: U.S. CensusPAGEBureau8PopulationEstimates,2016; BornOutside the U.S. and English Proficiency: U.S. CensusIncarcerationBureau, AmericanCommunity Survey, 2012-201615002WhiteAsianOtherPAGEOtherLatino WhiteBlackPopulation byage29%28%Latino1% 0.0 1%45-641%1%WhitePopulation by ageOtherAsianOther1%69%27%Populationby ageAsian Black pulationOther27%by tionby race ino White29%28%PAGE2Fordhamand69%45.0Population by ageBorn outside %9%22%15%0-1732%BORN OUTSIDE21%THE US22%15%NYC populationby ageAsian Black Latino White OtherPAGE 2NYC population by 075.037.562.525.050.012.537.50.025.012.50.0NYC population by racePAGE 2WECROSS BRONX EXPYNYC population by raceNYC population by racePAGE 2NewYork .50.0BSTNewYorkCityNew York CityPOPULATION100.087.5BY RACE AND100.075.087.5ETHNICITY 62.5RDSTRIVERWho We AreW1JEROMEAVE FORDHAM200Edit in Ind120160120160
Note from Oxiris Barbot, Commissioner,New York City Department of Health and Mental HygieneWe are pleased to present the 2018 Community Health Profiles, a look into thehealth of New York City’s (NYC) 59 diverse community districts.The health of NYC has never been better. Our city’s life expectancy is 81.2 years,2.5 years higher than the national average.However, not all residents have the same opportunities to lead a healthy life. AZIP code should not determine a person’s health, but that’s the reality in so manycities, including our own.The Community Health Profiles allow us to see how much health can vary byneighborhood. Policies and practices based on a history of racism and discrimination(often referred to as structural racism) have created neighborhoods with high ratesof poverty and limited access to resources that promote health. The practice ofremoving funding or refusing to provide funding to communities of color has causedpoor health outcomes to cluster in these communities.The Community Health Profiles also show how important community resources,and funding to create and sustain these resources, are to health outcomes.For example, supermarkets provide more access to fresh foods than bodegas.However, in some neighborhoods with obesity rates higher than the citywideaverage, just 5% of food establishments are supermarkets, making it difficult forresidents to make healthy choices.Addressing these inequities may seem like a daunting task, but by workingtogether, we can dismantle the unjust policies and practices that contribute topoor health in our communities. Through Take Care New York 2020 (TCNY 2020),and other New York City Health Department programs, we work with communitypartners to give every resident the same opportunity for good health. We aremaking progress, but there is more work to do.Reducing health inequities requires policymakers, community groups, healthprofessionals, researchers and residents to work together for change at everylevel. We look forward to working with you to improve the health of our city.Sincerely,Oxiris Barbot, MDTake Care New York 2020 (TCNY 2020) is the City’s blueprint for giving everyone the chance to live a healthier life.For more information, visit nyc.gov/health and search for TCNY.COMMUNITY HEALTH PROFILES 2018: FORDHAM AND UNIVERSITY HEIGHTS3
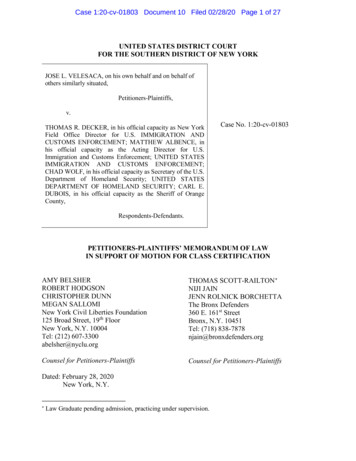
Table of ContentsWho We AreHealthy LivingPAGE 2PAGE 13Understanding HealthInequities in New York CityHealth CareSocial and EconomicConditionsHealth OutcomesHousing andNeighborhood ConditionsNotesMaternal and Child HealthMap and ContactInformationPAGE 14-15PAGE 5PAGE 16-18PAGE 6-8PAGE 19PAGE 9-10PAGE 11-12BACK COVERNAVIGATING THIS DOCUMENTThis profile covers all of Bronx’s Community District 5, which includes Morris Heights,Mount Hope, South Fordham and University Heights. This is one of 59 communitydistricts in NYC. The community district with the most favorable outcome in NYC for eachmeasure is presented throughout the report. Sometimes this is the highest rate (e.g.,physical activity) and sometimes this is the lowest rate (e.g., infant mortality). Some figuresinclude an arrow to help readers understand the direction of the healthier outcome.This profile uses the following color coding system:FORDHAM ANDUNIVERSITYHEIGHTS4BRONXNEW YORK CITYLOWEST/HIGHESTCOMMUNITYDISTRICTCOMMUNITY HEALTH PROFILES 2018: FORDHAM AND UNIVERSITY HEIGHTS
Understanding Health Inequitiesin New York CityThe ability to live a long and healthy life is not equally available to all New Yorkers. A baby born to a family that lives inthe Upper East Side will live 11 years longer than a baby born to a family in Brownsville. This inequity is unacceptable.Resources and opportunities are at the root of good health. These include secure jobs with benefits, well-maintainedand affordable housing, safe neighborhoods with clean parks, accessible transportation, healthy and affordablefood, and quality education and health care.1 In NYC, access to these resources and opportunities are not equitablydistributed. Neighborhoods with residents of color often have fewer resources.Since the 1600s—when NYC was established by colonization—racist policies and practices have shaped where NewYorkers live and go to school, what jobs they have and what their neighborhoods look like. Over time, these policies andpractices have built on each other to create deep inequity.For example, in the 1930s the federal government developed a policy known as redlining. As part of this policy,neighborhoods were rated based on the race, ethnicity and national origin of their residents. Neighborhoods thatwere home to people of color, like Central Harlem and Brownsville, were outlined in red on a map. They were labeled as"hazardous" and no home loans or other investments were approved there. The wealthiest and Whitest neighborhoodsin NYC received, and continue to receive, more investment and opportunities for health.2The denial of resources and opportunities that support good health contributes to the differences in life expectancywe see today. Experiencing racism is also a health burden, creating chronic stress that contributes to major causes ofdeath, like diabetes and heart disease.3To better understand the successes and challenges in each of NYC’s 59 neighborhoods, the Community Health Profilespresent data on a range of measures. These data should be interpreted with an understanding that good health is not onlydetermined by personal choices. Many other factors shape differences in health outcomes, including past and currentdiscrimination based on race, ethnicity, national origin, gender, sexual orientation and other identities. We hope theCommunity Health Profiles support your efforts in making NYC more equitable for all. For more information on the NewYork City Health Department programs and services that are closing the gap in health outcomes, visit nyc.gov/health.Marmot M, Friel S, Bell R, et al. Closing the Gap in a Generation: Health Equity Through Action on the Social Determinants of Health. The Lancet. 2008; 372(9650): 1661–1669.Undesign the Redline. . Accessed March 13, 2018.3Krieger N. Embodying inequality: A Review of Concepts, Measures, and Methods for Studying Health Consequences of Discrimination. International Journal of Health Services.1999; 29(2): 295-352.12COMMUNITY HEALTH PROFILES 2018: FORDHAM AND UNIVERSITY HEIGHTS5
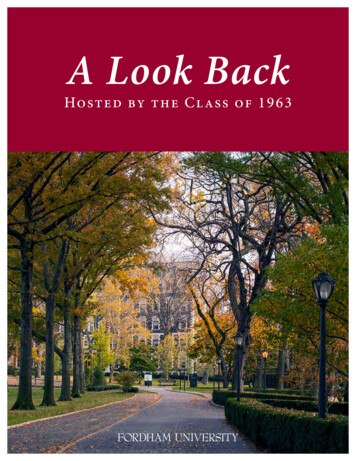
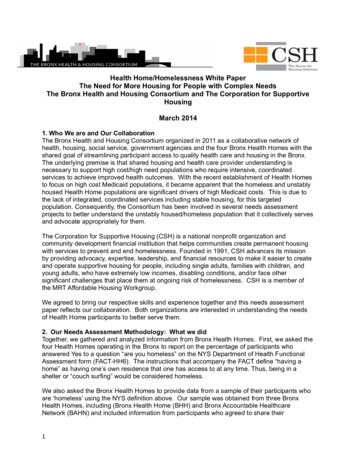
Social and Economic ConditionsEducationPAGE 6Higher education levels are associated with better health outcomes. Missing too many days of school can causestudents to fall behind and increases their risk of dropping out. Fordham and University Heights’ elementary schoolabsenteeism rate is higher than the rate for NYC overall. Two-thirds of high school students in Fordham andUniversityPAGE6 Heights graduate in four years, lower than the citywide rate.ELEMENTARY SCHOOL ABSENTEEISMON-TIME HIGH SCHOOL olgraduation(percent of public school students in grades K through 5 missing 19 or(percentof publicschool students graduating in four years)more school 05%AsianAsianAsianFordham andUniversityHeightsSource: NYC Department of Education, 2016-20178%8%8%00Highest:Financial District505050(percent of adults ages 25 and older)000High schoolhigh schoolsome collegeCollege graduateOne out of five adultsin Fordham iciencyUniversity Heightshas a college degree.2000Bronx29%45%26%Thirty-four percentIncarcerationIncarcerationof adults have not1500NYC19%38%43%completed high1,243 1,243school, a rate design.GraphappliestoallCDs.than the citywide rate.Highest % college graduate:100012%4%84%Fordham and University Heights00757575NYCLessthan ved65 65 65 00Bronx2525Source: NYC Department of Education,252017000 ACHIEVEDHIGHEST LEVEL OF oolschoolgraduationgraduationgraduationNote: NYC and borough On-time High School Graduation data may differ from ratespresented in other published sources. See technical notes in the public use datasetfor more details.3030302075%100100100BronxNYCLowest:Fordham andWhiteWhiteWhite1%1%1%606060UniversityBayside andLittle NeckHeightsOtherOtherOtherof EducationAchievedHighestHighestLevel eenteeOtherOtherOther0100600 8020 10040600802010040600 8020 10040060802010040600 8020 100406034%8010046%20%Financial District, Greenwich Village-Soho0 0 0 20 20 20 40 40 40 60 60 60 80 80 80 1001001000 0 0 20 20 20 40 40 40 60 60 60 80 80 80 1001001000 0 0 20 20 20 40 40 40 60 60 60 80 80 80 100100100Source: U.S. Census Bureau, American Community Survey, TY HEALTH PROFILES 2018: FORDHAM AND UNIVERSITY stototoallallallCDs.CDs.CDs.1,2431,2431,24
Social and Economic ConditionsEconomic stressLiving in high-poverty neighborhoods limits healthy options and makes it difficult to access quality health care andresources that promote health. In Fordham and University Heights, 34% of residents live in poverty, compared with20% of NYC residents. Access to affordable housing and employment opportunities with fair wages and benefits arealso closely associated with good health. Fordham and University Heights’ unemployment rate is higher than thecitywide average of 9%. Rent burdened households pay more than 30% of their income for housing and may havedifficulty affording food, clothing, transportation and health care. Sixty-five percent of Fordham and University Heightsresidents are rent burdened, a higher rate than residents citywide. One way to consider the effect of income on healthis by comparing death rates among neighborhoods. “Avertable deaths” are those that could have been avoided if eachneighborhood had the same death rate as the five wealthiest neighborhoods. Using this measure, 40% of deaths couldhave been averted in Fordham and University Heights.ECONOMIC STRESSPoverty(percent of residents)Unemployment(percent of people ages 16 and older)Rent Burden(percent of renter-occupied homes)Fordham %51%Lowest %7%Upper East Side4%Upper East Side37%Park Slope andCarroll GardensNote: Unemployment data may differ from rates presented in other published sources. See technical notes in the public use datasetfor more details.Sources: Poverty: American Community Survey as augmented by NYC Opportunity, 2012-2016 (community district and NYC), 2016(borough); Unemployment and Rent Burden: U.S. Census Bureau, American Community Survey, 2012-2016; Avertable Deaths:NYC DOHMH, Bureau of Vital Statistics, 2011-2015Many of thefactors that affecthealth happenoutside of adoctor’s office.This includesaccess to qualityeducation, jobsand safe spacesto live. Residentsin high-povertyneighborhoodsoften lack theseresources.Is your neighborhood gentrifying?Gentrification transforms a low-income area into a high-income area through neighborhood redevelopment.It is often defined as changes in the racial and ethnic makeup, education level and average income of aneighborhood's residents, as well as changes in housing and commercial businesses. While development maybe beneficial, it is often inequitable, and can lead to displacement of long-time residents and businesses.Gentrification can be measured in many ways. One measure that is used in NYC is to determine if a low-incomeneighborhood (those with the lowest 40% of average household income in 1990) saw higher than median rentgrowth over the past 20 years. Based on this definition, 24 neighborhoods were considered low-income in 1990,and Fordham and University Heights is one of seven neighborhoods that is not gentrifying at this time.Source: NYU Furman Center, 2015COMMUNITY HEALTH PROFILES 2018: FORDHAM AND UNIVERSITY HEIGHTS7
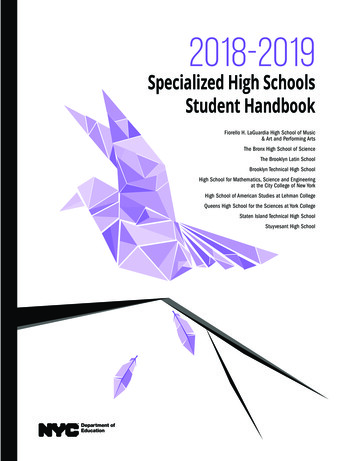
English proficiencyBorn outside USSocial and Economic 0100Compared with the citywide rate, Fordham and University Heights2000has a higher rate of assault-related hospitalizations.PAGE 8Non-fatal Assault HospitalizationsIncarcerationNON-FATAL ASSAULT HOSPITALIZATIONS (per 100,000 people)1500Hospitalizations126Fordham and University Heights113Bronx100059NYC50080More healthyrelated to injuriesEditin Indesign. Graph apfromassaultscapture theconsequencesof communityviolence.Lowest: Bayside and Little Neck4080120160200Less healthy0Source: New York State Department of Health, Statewide Planning and Research Cooperative System, 2012-2014IncarcerationIncarceration takes a toll on individuals, families and communities. Black and Latino New Yorkers experience higherpolicing compared with non-Latino White New Yorkers. This leads to higher rates of detention, which may include longperiods of time spent in jail before trial. People who have been incarcerated are more likely to experience mental andphysical health problems. They may also have trouble finding employment and housing and accessing healthy food.JAIL INCARCERATION(per 100,000 adults ages 16 and older)20001,033670Bronx4250NYC71Fordham and University HeightsLowest: Upper East SideSource: NYC Department of Corrections, 2015-2016Helpful neighborsStrong social connections can have a positive impacton the health of community members. Feeling that ourneighbors are willing to help each other is one aspectof community connection. In Fordham and UniversityHeights, 65% of residents think that their neighbors arewilling to help one another. This is lower than the rest ofthe city.PAGE 8ADULTS REPORTING THAT THEIR NEIGHBORSHelpful neighborsARE WILLING TO HELP ONE ANOTHERBike L(percent of adults)Fordham and University HeightsBronxNYCHighest: Tottenville and Great KillsLess healthy65%67%72%86%More healthySource: NYC DOHMH, Community Health Survey, 2015-20168PAGEPAGE 9withairconditionersCOMMUNITY HEALTHHomesPROFILES2018:FORDHAMAND UNIVERSITY HEIGHTS100800Pedes
PAGE 10Housing and NeighborhoodConditionsPAGE 8PAGE 11PAGE 8Bike LanesHelpful neighborsHelpful neighborsPAGE 1Late or no prenataBike LThe environment we live in can make it easier or more difficult for New Yorkers to lead healthy lives.Air conditioningMost heat stroke deaths in NYC occur inhomes without air conditioning. Four out of fivein Fordham and University HeightsPAGEhouseholds8have working air ouseholds)Homes(percentwith ofairconditioners10081%80Though air quality is improving in NYC in general,it variesbirthsPretermby community district. In Fordham and University Heights,PAGElevels10 of the most harmful air pollutant, fine particulatePAGE 06080100Bike LanesAIR POLLUTIONPAGE9 of fine particulate matter per cubic meter)(microgramsPedestrianInjuryHomes with air conditioners99%89%83%Air pollution800LesshealthyFordham andBronxNYC0Highest:PAGE 9UniversityTottenville andHeightsGreat KillsHomeswith ce: NYC Housing and Vacancy Survey, 201480 10070806050 604030 4020201000Housing quality7.8Preterm births7.5BronxNYC608060806.0100100Lowest:Rockaway and Broad ChannelPedestrian InjurySource: NYC DOHMH, Community Air Survey, 2016Homeswithout maintenance defects00 Teen births2080Morehealthy75%100HOMES REPORTING COCKROACHES(percentof 018%4060BronxPAGE le andGreat Kills2040Fordham andUniversity HeightsBronxChild Asthma emergency23%0departmentvisits00%5004000200Fordham andUniversityHeightsCockroachesNYC20300PAGE 120Lowest:60 Tottenville80and Great Kills100Source: NYC Housing and Vacancy Survey, 2014300Source: NYC Housing and Vacancy Survey, 2014200COMMUNITY HEALTH PROFILES 2018: FORDHAM ANDUNIVERSITY HEIGHTS100204060801000200Childhood100Obes400Note: Maintenance defects include water leaks, cracks and holes, inadequateheating, presence of mice or rats, toilet breakdowns or peeling paint.0PedesEvery resident has the right to live in housing that is safe and70pest-free. Poorly maintained housing is associated withPAGE12respiratory illnesses. In Fordham and UniversityPAGE1260poor health outcomes, including worsened asthma andotherHeights,PAGE 150only 18% of renter-occupied homes are adequately maintainedby landlords– free from heating breakdowns,Childhoodcracks,Child AsthmaemergencyObesit40holes, peeling paint and other defects. Forty-seven percentofFordhamand University Heights households reportdepartmentvisitsChild A30deparseeing cockroaches, which is a potential asthma trigger.20HOMES WITHOUT MAINTENANCEDEFECTS (percent of renter-occupied homes)CockroachesHomes without maintenance defects8070605040302001008.360Fordham and40 UniversityHeights202040020404020Teen births100Morehealthy60Late or no0 prena9
PAGE 8PAGE 10PAGE 11Helpful neighborsBike LanesLate or no pHousing and Neighborhood ConditionsBicycle network coveragePreterm birPedestrian injuryThirteen percent of roads in Fordham andUniversity Heights have bike lanes, which isPAGEhigher 10than NYC overall.Fordham and University Heights residents have asimilar pedestrian injury hospitalization rate compared020406080100PAGEwith11 NYCoverall.PAGE 9BICYCLENETWORKCOVERAGEHomeswithair conditionersBikeLanesPEDESTRIANINJURY HOSPITALIZATIONSPedestrianInjuryLate orno prenatalcare(percent of streets with bike lanes)(per 100,000 people)Teen births10013%Fordham and University Heights28Fordham and University Heights12%Bronx28Bronx80604020NYC10%45%00Less healthy204060Highest: Crown Heightsand Prospect Heights80Preterm birthsLowest: Greenwich Village and Soho0More healthy20More100healthyFood environmentNYC9Homes without maintenance defects80Pedestrian Injury70 Access to bike lanes can make it easier and60 safer to ride a bike more often.5040Source: NYC Department of Transportation, 2017302010023406080100Less healthySource: New York State Department of Health, StatewidePlanning and Research Cooperative System, 2012-20140Teen birthsPAGE 12PAGE 12Child Asthma emergencydepartment visitsBodegas are less likely to have healthy food options thansupermarkets.CockroachesThe lowest ratio among NYC communitydistricts is one supermarket for every three bodegas020406080100(healthier); the highest is one supermarket for every 57bodegas (less healthy). Fordham and University Heights0is home to no NYC farmers markets, another sourceof healthy food.Childhood500SUPERMARKET TO BODEGA RATIO400every one supermarket in Fordham and University Heights,Forthere are 20 bodegas.3002002040602080100100PAGE 12PAGE 12020406080100ChildIt isAsthmaeasier toemergencymake healthy choices whendepartmentvisitshealthy, affordable food is readily available.Childhood Obesity01500400300200SupermarketBodegasSource: Farmers Markets: NYC DOHMH Bureau of Chronic Disease Prevention andTobacco Control, 2017; Supermarket to Bodega Ratio: New York State Department ofAgriculture and Markets, October 201610001020COMMUNITY HEALTH PROFILES 2018: FORDHAM AND UNIVERSITY HEIGHTS
Maternal and Child HealthPregnancy outcomesAccess to quality healthcare is critical to a mother’shealth before, during and afterpregnancy, and to the health ofour littlest New Yorkers.In Fordham and University Heights, the rate of expectant mothersreceiving late or no prenatal care is higher than the citywide rate. One in11 births to Fordham and University Heights residents is preterm (threeor more weeks before the due date), higher than the citywide rate.PAGE 11LATE OR NO PRENATAL CARELateor ofnocare(percentliveprenatalbirths)PAGE 111.3%6.7%Lowest:Financial DistrictNYCLate or no prenatal carePAGE 10Preterm birthsSource: NYCDOHMH,Bureau of Vital Statistics, 2015BikeLanes10.9% 12.0%BronxPAGE 11Late or no prenatal carePRETERMBIRTHSPretermbirths8.7% NYC 9.7% Bronx(percent of live births)Teen birthsTeen births02040Fordham andUniversityHeights5.4%9.3%Lowest:Greenpoint andWilliamsburgFordham andUniversityHeights60Source: NYC DOHMH, Bureau of Vital Statistics, 2015Preterm birth isa key driver ofinfant death.Preterm births80100Pedestrian InjuryTEENBIRTHSTeen birthsTeen pregnancyTeen pregnancy has declined across NYC;Fordham and University Heights' teen0 birth rate 2040 teen girls.60is 35.3 per 1,000(per 1,000 females ages 15 to 19)8035.3100Fordham and University Heights28.4PAGE 1202040Childhood ObesityPAGE 01220406060Childhood Obesity808010019.31001.0*NYCLowest: Greenwich Village and Soho0*Interpret estimate20 with caution due40 to small number60of events.Source: NYC DOHMH, Bureau of Vital Statistics, 2013-2015PAGE 12PAGE 12Child Asthma emergencyChildhood ObesityCOMMUNITYHEALTHPROFILES 2018: FORDHAM AND UNIVERSITY HEIGHTSdepartmentvisits500Bronx8010011
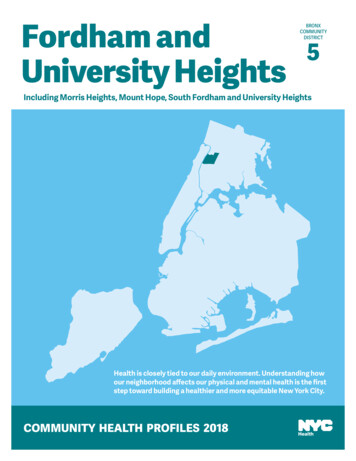
8PAGE 10204060 and80 Child100MaternalHealthBike 0100CHILDHOODOBESITYPAGE 12(percent of public school children in grades K through 8)A quarter of Fordham and University HeightsChild Asthma emergencychildren in grades K through 8 have obesity. Thisdepartment visitsis higher than the citywide rate of one in five.Childhood Obesity24%24%20%5%50040009300s with air conditioners40Fordham andBronxUniversityPedestrian InjuryHeights2006080100Lowest:Financial DistrictNYCSource: NYC Department of Education, 2016-2017100100200Children’s hospitalizations and emergency department visits“Avoidable hospitalizations” are those that could be prevented with timely access to quality outpatient care. The rateof avoidable pediatric hospitalizations among children ages 4 and younger in Fordham and University Heights is higherthan the citywide rate.020406080Many childhoodasthma emergencydepartment visits could be prevented by reducing the presence of pests, mold,s withoutmaintenancedefects100secondhand smoke and other asthma triggers, and by taking daily medication. The asthma emergency department visitrate among children ages 5 to 17 in Fordham and University Heights is nearly double the citywide rate. The TCNY 2020goal is to have fewer than 210 asthma emergency department visits per 10,000 children across the entire city.PAGE12AVOIDABLEHOSPITALIZATIONSAMONG CHILDRENAvoidablehospitalizations(per 100,000 children ages 4 and younger)amongCHILDREN1,297oachesPAGE 15HPVPAGE 12CHILD ASTHMA EMERGENCYChild Asthma emergencyDEPARTMENTFludepartmentvisits VISITS(per 10,000 children ages 5 to 17)100100Fordham and80University 00Lowest: 0100PAGE 16HIV0Fordham andUniversityHeightsBronxNYC80PAGE 13Self-ReportedHealth among Children: New York State Department of Health, Statewide Planning and Research Cooperative System,Sources: Avoidable Hospitalizations28Lowest:FinancialDistrict2014; Child Asthma Emergency Department Visits: New York State Department of Health, Statewide Planning and Research Cooperative System, 2015Edit in Indesign. Graph applies to all CDTake Care New York 2020 (TCNY 2020) is the City’s blueprint for giving everyone the chance to live a healthier life.For more information, visit nyc.gov/health and search for TCNY.012PAGE 1420406080100COMMUNITY HEALTH PROFILES 2018: FORDHAM AND UNIVERSITY HEIGHTS0PAGE 17
604020Healthy Living0030060090012001500PAGE 1680PAGE13 REPORTING THEIR OWN HEALTHHIVADULTSAS "EXCELLENT,""VERY GOOD"OR "GOOD" (percent of adults)HealthHow residents feel about their own health Self-ReportedSelf-reported healthcan be a good measure of overall mentaland physical health. Sixty-seven percent ofFordham and University Heights residentsrank their health as “excellent,” “very good”or “good,” lower than the rest of NYC. TheTCNY 2020 goal for the city is at least 82%.67%Fordham and University HeightsE73%Bronx78%NYC93%Highest: Upper West Side020406080Less healthy100More healthySource: NYC DOHMH, Community Health Survey, 2015-2016PAGE 14Physical activity, diet and smokingSixty-seven percent of Fordham and UniversityHeights adultsreportgetting anyAvoidableADULTHospitalizationsphysical activity in the past 30 days, similar to New Yorkers overall. The percentage ofFordham and University Heights adults who report eating at least one serving of fruits orvegetables in the past day is lower than the citywide average of 87%.Sugary drink consumption can increase the risk of type 2 diabetes, heart disease,cavities, weight gain and obesity. Industry marketing can affect behavior and sugarydrinks are heavily marketed to youth and communities of color. While sugary drinkconsumption has decreased to 23% in NYC, the TCNY 2020 goal is to reduce sugary drinkconsumption to less than 19% citywide. One-third of Fordham and University Heights05001000 1500 2000 2500 3000adults drink at least one sugary drink a day.0PAGE 17HEP C 150Federal guidelinesrecommendthat adults get150 minutes ofmoderate exerciseeach week. Peoplewho are physicallyactive are morelikely to live longer,healthier lives.0EThe adult smoking rate in Fordham and UniversityFalls Heights is similar to the rest of thehospitalizatioborough and other parts of NYC. The City is committed to reducing the citywide adult smoking rate Psychiatricto 12% by 2020.PHYSICAL ACTIVITY, DIET AND SMOKING (percent of adults)Fordham andUniversity HeightsBronxNYC67%70%73%Any physical activity in the past 30 daysAt least one serving of fruits orvegetables per day078%5001000Fordham andUniversity HeightsOne or more 12-ounce sugary drinksper dayCurrent smokers83%15002000Bronx87%2500NYCHighest %90%Financial District,Greenwich Village- Soho96%2000400Financial District,Greenwich Village- Soho600Lowest %Binge Drinking (use graph to the right to mark points)33%32%23%8%Financial District,Greenwich Village- Soho16%14%14%8%Upper East SideSource: NYC DOHMH, Community Health Survey, 2015-2016Take Care New York 2020 (TCNY 2020) is the City’s blueprint for giving everyone the chance to live a healthier life.For more information, visit nyc.gov/health and search for TCNY.COMMUNITY HEALTH PROFILES 2018: FORDHAM AND UNIVERSITY HEIGHTSBinge Drinking (use graph below to mark points)13800
PAGE 12PAGE 12Avoidable DRENamong CHILDRENHealth CareAccess to health careCitywide, the percentage
COMMUNITY HEALTH PROFILES 2018: FORDHAM AND UNIVERSITY HEIGHTS 1 COMMUNITY HEALTH PROFILES 2018 Fordham and University Heights 5 Health is closely tied to our daily environment. Understanding how our neighborhood affects our physical and mental health is the first step toward building a healthier and more equitable New York City. BRONX .