Transcription
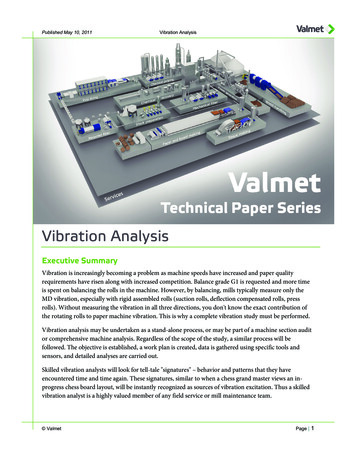
Published May 10, 2011Vibration AnalysisVibration AnalysisExecutive SummaryVibration is increasingly becoming a problem as machine speeds have increased and paper qualityrequirements have risen along with increased competition. Balance grade G1 is requested and more timeis spent on balancing the rolls in the machine. However, by balancing, mills typically measure only theMD vibration, especially with rigid assembled rolls (suction rolls, deflection compensated rolls, pressrolls). Without measuring the vibration in all three directions, you don't know the exact contribution ofthe rotating rolls to paper machine vibration. This is why a complete vibration study must be performed.Vibration analysis may be undertaken as a stand-alone process, or may be part of a machine section auditor comprehensive machine analysis. Regardless of the scope of the study, a similar process will befollowed. The objective is established, a work plan is created, data is gathered using specific tools andsensors, and detailed analyses are carried out.Skilled vibration analysts will look for tell-tale "signatures" – behavior and patterns that they haveencountered time and time again. These signatures, similar to when a chess grand master views an inprogress chess board layout, will be instantly recognized as sources of vibration excitation. Thus a skilledvibration analyst is a highly valued member of any field service or mill maintenance team. ValmetPage 1
Published May 10, 2011Vibration AnalysisThe mechanical dynamic behavior of a pulp, board, paper or tissue machine is a limiting factor for themachine's capacity. Vibrations in machine equipment constitute a safety hazard, and will cause severeproblems in the paper making process and limit machine efficiency.This paper will review what a vibration study consists of and why it's performed. It will also discuss theprocess of machine analysis by vibration study, and provide some examples of "vibration signatures"which Valmet vibration experts encounter in the field.What is a vibration study?A vibration study, as performed by Valmet, covers the mechanical condition and the dynamic behavior ofthe entire machine line from stock preparation to finishing, or of specific machine sections introubleshooting. Both current production speeds and targeted speeds are studied. The cost of the studycan be quickly recovered through subsequent savings on parts purchases, problem-solving, line speed up,and machine rebuilds. A vibration study may also be included aspart of a larger scope Machine Analysis.ObjectiveThe main objectives when performing a vibration study typicallyfall into one or more of three categories: Capacity - map the dynamic behavior of the machinefrom current to targeted speeds, yielding the most costeffective approach by foreseeing problems. Rebuild - evaluate how rebuilds will affect the dynamicbehavior of the machine and its consequences at currentor increased speeds. Troubleshooting - locate and eliminate vibration sourcescurrently having a detrimental effect on the machinery orprocess.Figure 1. Vibration analysis requiresskilled expertise.From Valmet's perspective, each objective is based on extensive paper machine building expertise,utilizing top of the line hardware and software for analysis. Measurements and investigations are carriedout during production and at a machine shutdown. Valmet's vibration studies combine mathematicalanalyses and diagnostic measurements in a distinct aim to make your machine run smoother, faster andmore cost efficiently.BenefitsA vibration study will typically yield the following benefits: Determination of the dynamic behavior of machine sections Determination of the mechanical condition of the machine Determination of the feasibility of a possible capacity increase Most cost-effective implementation of rebuilds Prediction of future mechanical problems and reduction of unplanned shutdowns Scheduling of service actions based on prioritized maintenance recommendations ValmetPage 2
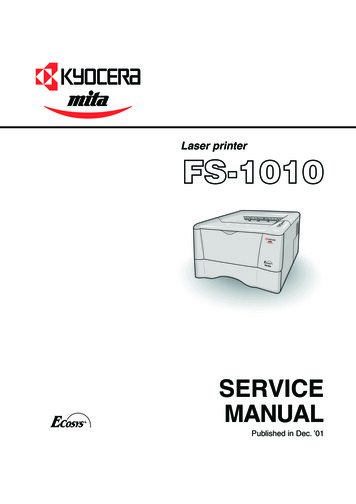
Published May 10, 2011Vibration Analysis Savings on roll rebuilds by relocating old rolls to positions where they can still be used Solutions to problems such as barring and gear train failuresMeasurements and design reviewMeasurements taken during production include: Mechanical condition measurement (e.g. vibration, dynamic run-out, etc) Synchronized measurements Operating deflection shape measurements Paper samples Noise level measurements (where applicable)Figure 2. Specialized tools and sensors are used during vibration analysis.The following measurements are performed during a machine shutdown: Speed tests Impact tests and modal analyses Run-out measurements Synchronized measurementsA vibration study also includes dimensioning reviews and mathematical analyses of line components andstructures.Reporting of findingsValmet's vibration study reports are clear and comprehensive. They include an explanation of allmeasurements and reviews conducted. The mechanical and dynamic behavior of each componentanalyzed on each machine section is covered. Recommended actions are also detailed for eachcomponent. These will improve the reliability and availability of the items analyzed. A vibration studyreduces maintenance and shutdown costs and cuts down the probability of unanticipated shutdowns. ValmetPage 3
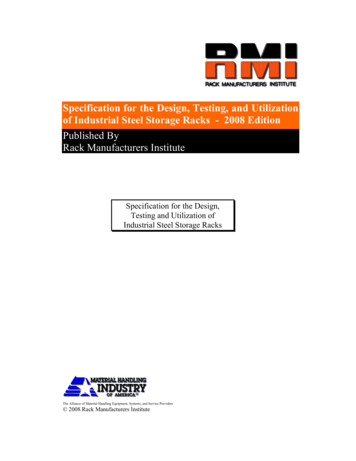
Published May 10, 2011Vibration AnalysisEach report is accompanied by an electronic database that can be used to prioritize and manage therecommended actions.Expertise and Measuring EquipmentAll Valmet experts possess extensive mill experience and the latest equipment expertise. They make use ofspecialized tools and tested approaches developed over decades at hundreds of customer mills. Valmet'svibration studies combine mathematical analyses and diagnostic measurements in a manner that helps toproduce tangible savings in connection with line upgrades and reduces related risks. Our expertise is builton Valmet's extensive engineering experience and know-how.How is a vibration study performed?Vibration analysis is a core component of most Reliability Centered Maintenance programs, and it is herewe continue to meet that same age-old question – How long will a piece of equipment last? Indeed, thisissue becomes ever more pressing with increased competition requiring the highest effective utilizationand efficiency levels of the paper machine.Raw time waveform analysisMachine analysis and vibration study personnel will use the measurement of a variety of signals to helpdetermine the nature and source of a problem. The most common measurement is that of vibration - inunits of acceleration, velocity or displacement. Other signals may include pressure or sheet qualityparameters, such as basis weight, moisture and caliper.Analysis of the raw time waveform provides valuableinformation for the troubleshooting of many problems,including those with gearboxes. Impulsive vibration(due to problems with gear tooth contact, etc.) is betteranalyzed in the time domain.The most fundamental form of analysis of these signalsis the time domain. This form of analysis allows theanalyst to see the amplitude of the signal (peak to peak)versus time. By adjusting the sampling rate, and thelength of the time record, the analyst can establishmany physical characteristics of the signal and machineunder test. It is often a very underutilized method ofanalysis.Time domain analysis is very good for analyzing nondeterministic signals such as random or impulsivesignals generated by defective gears, barring or beating. ValmetFigure 3. Analysis of the raw time waveform providesvaluable information for troubleshooting many problems.The figure shows the amplitude modulation of the geartime waveform due to axial run-out of the gears.Page 4
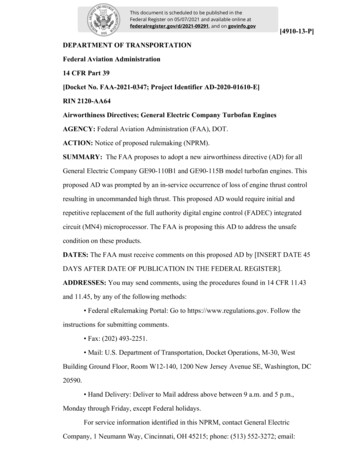
Published May 10, 2011Vibration AnalysisSpectrum AnalysisSpectrum analysis separates the total vibration into discrete frequencies so that the source(s) of a givenproblem may be easily identified. Spectrum analysis involves passing the raw time domain data through amathematical calculation called the Fast Fourier Transform or FFT. The FFT algorithm converts theoriginal signal from the time domain into the frequency domain. The result is that a complex signal isseparated out into different contributing frequencies (units of Frequency are cycles per unit of time, e.g.,Hertz cycles/second).It is importantcenter roll ts nipthat the samesignal is analyzedover differentfrequency rangesfor a completeunderstanding ofthe problem.Experience andgood data3rd press roll ds nipacquisition skillsand tools areessential formaking sure thatall relevantfrequency rangesare verified. Acommonmistake analystsFigure 4. The same signal may need to be analyzed over different frequency ranges.make is toanalyze all data over a single frequency range.Peak#1234560.3002G2, 2X79.473 m76.05679.15573.75176.85074.546Y7.157228.496 m210.254 m195.573 m168.374 m159.083 mMagnitude, 0011.6001.400G11, 8308.394 m293.536 m275.719 m189.247 m184.729 mMagnitude, .06800.0Hz1.0K1.2KResolution implies the ability to distinguish between closely spaced frequencies. Too little resolutioncauses the analyst to assume that a single frequency or source of interest exists - when several frequenciesand therefore, several sources may actually be present, but very close together in the frequency domain.Flexibility in being able to display a lot of data simultaneously allows for effective diagnostics. The Valmetdata analysis and acquisition system has very advanced data presentation tools. Multiple signals can beeasily overlaid for quick comparison and source identification. This allows simultaneous determination ofvibration severity and contributing sources can be analyzed at different locations.Tachometer signals from various rolls, felts, etc. allow for precise source identification. In the exampleshown in Figure 5, the green trace shows a spectrum generated by a tachometer signal on a CC roll, sothat fundamental and multiples of rotational frequency can be known easily. It is presented in thefrequency domain so that vibration frequencies may be compared to it. ValmetPage 5
Published May 10, 2011Vibration Analysis0.0600.0502P CC Roll FS Nip2P CC Roll FS P-Nip2P CC Roll FS Nip2P CC Roll FS P-Nip2P CC Roll RPDG2, 2X: 6.51677Y: 0.0566958Magnitude, gure 5. Multiple signals can be compared simultaneously so that vibration severity and contributing sources can beanalyzed at different locations.Speed TrialsChanges in vibration levels as a function of changing machine speeds or loads are normally analyzedusing waterfall plots. Waterfalls, also referred to as cascade plots or spectral maps, consist of a series ofspectrums placed one behind the other to generate a 3-dimensional graph. The X-axis representsFrequency, the Y-axis represents vibration amplitude and the Z-axis represents time or machine speed.Waterfalls are useful for theidentification of resonances.The high energy levels of therotating components excitestructural resonances, as wellas those of rolls and majorcomponents.Changes in vibration as afunction of changingmachine speed are easilyanalyzed with this tool. In theexample shown in Figure 6,the red trace shows aparticular order or multipleof the roll being tached. Aclear resonance is seenpeaking at 260 rpm. ValmetFigure 6. Changes in vibration as a function of changing machine speed are easilyanalyzed with waterfall displays.Page 6
Published May 10, 2011Vibration AnalysisImpact TestingThe purpose of impact testing is to identify the natural frequencies of typically smaller components in themachine, such as tube rolls, doctors, drive shafts, motor stands, showers, uhle boxes, etc. Thiscomplements the speed trial, because the speed trial and resultant waterfalls will show multiple excitednatural frequencies. The next challenge for the analyst is to determine which component was actuallyresonating, because the waterfall shows them all.Accel1Magnitude, g / lbf60mH1, 2X: 21.25Y: 00mRM S: 86.93mMax: 630.4mMin: -707.5mPkPk: 1.338Real, g400m200m0-200m-400m-600m-800m01.0sec2.0Figure 7. In these impact testing graphs, the top chart shows the time domain response while the bottom chart is the transferfunction, i.e. ratio of response to impact force.The equipment consists of a modal hammer that contains a force sensor, and a conventional vibrationsensor such as an accelerometer mounted on the component being measured. The component is impactedby the hammer, which measures the force of impact. The accelerometer measures the response. Thesoftware then generates a transfer function in the frequency domain - the ratio of response to force. Thepeaks of the transfer function correspond to the natural frequencies of the component being measured.The amplitude tells the analyst the energy required to excite the mode (natural frequency).Synchronous AveragingSynchronous averaging is used to isolate the contribution of vibration of a single rotating source. This isdone by obtaining a tachometer trigger from a given roll or felt and then timing the data acquisitionperfectly with the occurrence of the trigger. Averaging of a series of acquisitions then removes the ValmetPage 7
Published May 10, 2011Vibration Analysisvibration contribution ofasynchronous components leaving only that vibrationwhich is synchronous withthe trigger.Figure 8 showssynchronously averagedvibration in polar run outformat measured on thebearing housing of thebottom roll. The top roll isthe dominant contributor tothe vibration in the calenderFigure 8. Synchronous Averaging – Paper machine calender before problem correction.nip. Both graphs representvibration measured with the same transducer or sensor, but different tachometer
Vibration analysis may be undertaken as a stand-alone process, or may be part of a machine section audit or comprehensive machine analysis. Regardless of the scope of the study, a similar process will be followed. The objective is established, a work plan is created, data is gathered using specific tools and sensors, and detailed analyses are carried out. Skilled vibration analysts will look .