Transcription
Vibration Analysiswith SolidWorks Simulation 2014 Paul M. KurowskiSDCP U B L I C AT I O N SBetter Textbooks. Lower Prices.www.SDCpublications.com
Visit the following websites to learn more about this book:Powered by TCPDF (www.tcpdf.org)
Vibration Analysis with SolidWorks Simulation 20144: Modal analysis – the effect ofpre-stressTopics covered Modal analysis with pre-stressModal analysis and buckling analysisArtificial stiffnessIf a structure is subjected to a load that produces significant tensile orcompressive stresses, those stresses may significantly change the structure’sstiffness and consequently, its modes of vibration. To account for that change,modal analysis needs to be completed on a structure with a modified stiffnesscaused by the existing state of stress. This type of modal analysis, called preload or pre-stress modal analysis is conducted in two steps. First, a staticanalysis is run to find stresses that develop due to a load; these stresses areused to modify the structure’s stiffness. Next, modal analysis is run on thestructure with the stiffness modified by the previously found stresses.Predominantly, tensile stresses will increase the natural frequencies as isillustrated by tuning a guitar string or stress-stiffening of a rotating componentlike a turbine blade. Rotating machinery typically requires that the effect ofpre-stress be considered. Compressive stresses on the other hand will decreasenatural frequencies. In this chapter we will illustrate the effect of tensile andcompressive stresses on natural frequencies. Then we will demonstrate how amodal analysis with pre-stress relates to a buckling analysis.Open part model ROTOR which is a simplified representation of a helicopterrotor. We are interested in the effect of centrifugal forces that develop due torotor rotation on the fundamental natural frequency of the rotor blade. Thefundamental frequency is the lowest natural frequency. All four blades areidentical and isolated from each other by a support at the hub. Therefore, wemay simplify the analysis to only one blade (Figure 4-1).45
Vibration Analysis with SolidWorks Simulation 2014Rotor with four bladesOne blade for analysisFigure 4-1: ROTOR modelModal analysis can be conducted one blade.Switch to 02 one blade configuration and create a Frequency study 01rotating. Apply Fixed restraints as shown in Figure 4-2.Figure 4-2: Restraints definitionA fixed restraint is defined to the cylindrical surface. You may also apply it tothe top and bottom face of the hub; it won’t have any significant effect on thevibration of the blade.46
Vibration Analysis with SolidWorks Simulation 2014Define a centrifugal load of 300RPM by selecting the cylindrical surfacewhere the Fixed restraint has been defined. This cylindrical face uniquelydefines the axis which is taken as the axis of rotation as shown in Figure 4-3.Select cylindricalface that defines theaxis of rotationMetric300RPMFigure 4-3: Centrifugal load definitionA centrifugal load is defined by an angular rotation about the axis. Use metricunits to define it in revolutions per minute (RPM). Do not define any angularacceleration.47
Vibration Analysis with SolidWorks Simulation 2014In the study properties, specify one mode and use the Direct sparse solver(Figure 4-4).One modeDirectsparseFigure 4-4: Properties of the frequency studyFFEPlus solver is not available for a modal analysis with pre-stress.48
Vibration Analysis with SolidWorks Simulation 2014Mesh the model with the default mesh size and solve the study. Copy study 01rotating into 02 stopped, suppress the centrifugal load and solve the studywithout pre-stress.Fundamental frequency ofstopped blade: 0.54HzFundamental frequency ofrotating blade: 5.35HzFigure 4-5: The first mode of vibration of rotating and stopped blade.The mode shape is the same for the rotating and stopped blade; the modalfrequency is very different. Both plots show the undeformed shapesuperimposed on the modal plot.A comparison of results between rotating and stopped blade shows a verystrong effect of rotation; the first natural frequency is ten times as high for therotating blade as it is for the stopped blade. The centrifugal force producestensile stresses which cause stress stiffening of the blade. The resultantstiffness of the rotating blade is the sum of the elastic stiffness and stressstiffness. Stress stiffness due to tensile stress is positive, and the resultantstiffness of the rotating blade is higher than the stiffness of the stationaryblade. Higher stiffness, in turn, produces a higher natural frequency.When a load is present in a Frequency study, this load is used to modify thestiffness. The analysis is then called modal analysis with pre-load. The termmodal analysis with pre-stress is also used. The solution progresses in twosteps. First, a static analysis is run to find stresses. These stresses are used tomodify the model stiffness. Then modal analysis is run using the combinedelastic and stress stiffness.Remember that it is a serious error to confuse pre-load with excitationload!The effect of tensile stress on the natural frequency may be easilydemonstrated by tuning a guitar string, where increasing string tensionincreases the natural frequency.The effect of compressive stresses on the natural frequency is the opposite;compressive stresses produce negative stress stiffness which decreases the49
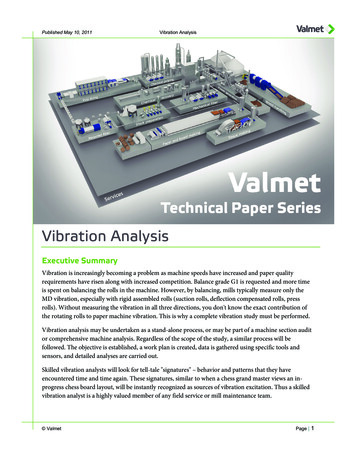
Vibration Analysis with SolidWorks Simulation 2014resultant stiffness and the natural frequency decreases. We will demonstratethis with the COLUMN model subjected to compression by two wedges asshown in Figure 4-6. This illustration schematically shows an apparatus usedto demonstrate buckling of a rectangular column.Fixed wedgeCompressed columnMoving wedgeLoadFigure 4-6: A prismatic column compressed by two wedges.The left wedge is fixed. The right wedge is held in between rollers. It can onlytranslate in the direction of the load.The beam is “squeezed” between to wedges; one wedge is fixed and providessupport, the other one is guided by rollers and can move only in the directionof the load. We want to simulate this test rig to find a relation between theapplied load and the first natural frequency of the loaded column in the rangeof the load magnitude changing from a tensile load to a compressive load upto the point of buckling. Using the test rig as shown in Figure 4-6 we wouldnot be able to apply a tensile load, but using SolidWorks Simulation, this isvery easy. The analysis does not require an analysis of an assembly; it can becompleted on one part.For your information only, review the COLUMN assembly model, then openthe COLUMN part model which will be used for analysis.50
Vibration Analysis with SolidWorks Simulation 2014To find the magnitude of the buckling load we need to run a buckling analysis.Using the COLUMN part model, create a Buckling study titled 00 bucklingand define restraints as shown in Figure 4-7.A fixed restraint on thesplit line on the end face.A restraint on the split line onthe end face in the directionnormal to the Top referenceplane.Figure 4-7: Restraints applied to the COLUMN model.The fixture window shows restraint on the side of the moving wedge. Restrainton the side of fixed wedge is a fixed restraint. The fixed restraint window isnot shown.Notice that the Fixed restraint, as defined on the split line on the side of thefixed wedge will be transferred to nodes of solid elements which have threedegrees of freedom. Therefore, this Fixed restraint will effectively produce ahinge support.51
Vibration Analysis with SolidWorks Simulation 2014Next, define a load as shown in Figure 4-8.Figure 4-8: Load applied to the COLUMN model.The load is applied to the same split line where the restraint on the side ofmoving wedge has been applied.Notice that on the loaded end, the restraint and load are both applied to thesame entity (the split line), but in different directions. If the load was appliedin the direction of this restraint it would be ineffective.Mesh the model with the default element size and run the solution of thebuckling study. The first buckling mode is shown in Figure 4-9 and theBuckling Load Factor (BLF) is 1.5755, meaning that according to the linearbuckling model, buckling will happen at a load of 1575.5N.52
Vibration Analysis with SolidWorks Simulation 2014Figure 4-9: Buckled shape shown using displacement plot.Even though numerical values are shown, their values may be used only tofind a displacement ratio rather than absolute displacement. This is in closeanalogy to modal analysis.The linear buckling analysis was necessary to establish the range of loads inthe modal analysis with pre-stress. We’ll now conduct a numerical experimentsubjecting the model to different loads ranging from tensile to compressive tostudy the effect of pre-load on the fundamental natural frequency. Theexperiment will be conducted in twelve Simulation studies while the load ischanged from a 1500N tensile load, to a compressive load causing buckling.A tensile load is denoted as positive, compressive as negative.We should point out that numerical results presented in this experiment maydiffer slightly depending on the type of solver (we are using FFE Plus),software release, or service pack used.Create a Frequency study titled 01; you may copy loads, restraints and themesh from 00 buckling. Remember to reverse the load direction to tensile andmake it 1500N. Obtain the solution and record the first natural frequency.Next, proceed in load steps shown in Figure 4-10.53
Vibration Analysis with SolidWorks Simulation 2014Study 5212-1575.490.31Figure 4-10: A summary of the 12 studies illustrates the change of the firstnatural frequency with the applied pre-load. All runs are solved with thedefault element size of 3.11mm.Notice that the compressive pre-load in study 12 is just 0.01N less than thebucking load.54
Vibration Analysis with SolidWorks Simulation 2014Results summarized in the above table are presented as a graph in Figure 4-11.A very steep curve near the buckling load is why the last four steps wereconducted with small load increments.HzBucklingLoad NCompressiveTensileFigure 4-11: Frequency of the first mode of vibration as a function of pre-load.The frequency reaches zero when the compressive load equals the bucklingload.As Figure 4-11 shows, a pre-load causing the drop of the first naturalfrequency to zero is equal to the buckling load.Tensile stresses develop positive stress stiffness that adds up to the elasticstiffness; therefore the resultant stiffness increases, which is reflected by ahigher natural frequency as compared to the unloaded column. Compressivestresses develop negative stress stiffness that is subtracted from the elasticstiffness and this decreases the resultant stiffness; consequently the naturalfrequency decreases. When the pre-load approaches the magnitude ofbuckling load, the resultant stiffness is very low producing a very low naturalfrequency. When the pre-load reaches the buckling load, the stiffness dropsdown to zero and that leads to buckling.When the magnitude of a compressive load approaches the buckling load, theeffective stiffness is very close to zero; this is why it has a near-zero naturalfrequency. Therefore, we may use the model from study 12, the one preloaded with a 1575.49N compressive load, as a tool to investigate the effect ofdiscretization on the model stiffness. As you know, meshing adds somestiffness to a model; let’s call it artificial stiffness. The larger the elements are,55
Vibration Analysis with SolidWorks Simulation 2014the more artificial stiffness is added and vice versa. The artificial stiffnessdoes not change with pre-load; therefore in study 12, the artificial stiffness is amajor contributor to the model stiffness. The natural frequency of 0.31Hz isnot a real frequency under that load. Elastic stiffness and stress stiffness havealmost canceled themselves out and this 0.31Hz frequency is an artifactproduced by the artificial stiffness that is there due to discretization error. Thenumerical value of that frequency completely depends on the choice of meshsize.We will now conduct a numerical experiment to demonstrate that theremaining model stiffness in study 12 is a product of discretization, and not areal stiffness.Keeping in mind that all twelve studies were run with default element size3.1mm, we will now use 2mm element size. Copy study 12 into 12 fine andre-mesh it with a 2mm element size. With a smaller element size, the artificialstiffness is reduced and the effective stiffness becomes negative. An attemptto run the solution produces an error message shown in Figure 4-12.Figure 4-12: Error message caused by a negative effective stiffness.The explanation offered by the error message is generic and does not apply toour problem.56
Vibration Analysis with SolidWorks Simulation 2014We now realize that all that was “holding” the model stable in study 12 wasthe artificial stiffness produced by the process of discretization. Thecontribution of artificial stiffness to total stiffness is significant only for loadsvery close to buckling because the real stiffness is then very low.You may want to analyze the effect of element size on the natural frequencyin the model subjected to a compressive load that is very close to the bucklingload. You’ll find that the natural frequency strongly depends on the elementsize as shown in Figure 4-13.[Hz]1/hFigure 4-13: Natural frequency at a compressive load of 1575.49N as afunction of the inverse of element size, h.A strong dependence of frequency on the element size makes these resultsuseless.A fundamental rule of using FEA results states that before we use results tomake a design decision, we must prove that these results are not sig
Vibration Analysis with SolidWorks Simulation 2014 50 resultant stiffness and the natural frequency decreases. We will demonstrate this with the COLUMN model subjected to compression by two wedges as shown in Figure 4-6. This illustration schematically shows an apparatus used to demonstrate buckling of a rectangular column.