Transcription
11TH ANNUAL2020 Private SaaS Company Survey2020SAAS SURVEYRESULTSCOVID EDITIONTHROUGH MAY 31, 20201
KBCM TECHNOLOGY GROUP SAAS SURVEY – COVID EDITION2020 Private SaaS Company SurveyIn 2010, we created the Pacific Crest SaaS Survey to provide business leaders and investors meaningful benchmarks toassess performance, manage operations, and make well-informed strategic and financial decisions. Since then, the (now)KBCM SaaS Survey has become the industry’s go-to benchmarking report.In 2020, with the impact of COVID on everyone’s mind, gauging performance is more important than ever. We’ve redesignedthis year’s survey to help determine how things are changing. What does outperformance look like in this environment? Whois prospering and who is struggling? How are companies reacting?This initial report reviews data from over 500 private SaaS company respondents. Our focus is on baseline performance for2019 and 2020 year-to-date, through May 31st, with responses collected from mid-June through early July.Importantly, we recognize that we may still be in the early stages of the market disruptions caused by COVID. So this year,rather than a one-time check-in, we intend to reach back out to companies as things progress, and have established uniquesecret code names to allow continuity without sacrificing confidentiality and anonymity.Finally, we would like to acknowledge the following partners who assisted in the solicitation of responses:Andreessen HorowitzBattery VenturesBessemer Venture PartnersFLG PartnersFrancisco PartnersGGV CapitalJMI EquityMatrix PartnersMeritech Capital PartnersRedpoint VenturesRidge VenturesSage IntacctSapphire VenturesWarburg PincusAnd a special thanks, as always, to David Skok of Matrix Partners who has helped popularize the use of this report on hisblog, forEntrepreneurs.com.2
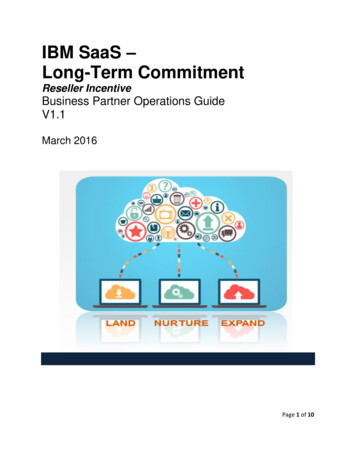
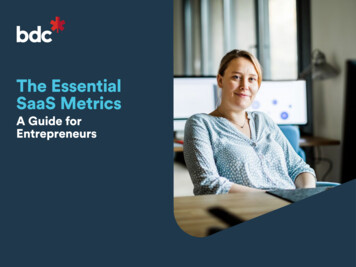
SUMMARY FINDINGS2020 Private SaaS Company Survey 2020E top-line growth projections have been nearly cut in half–– Median 2020E ARR growth now 20% vs. 36% in 2019, and 40%originally expectedTop quartile growers down similarly, at 50% growth vs. 100%last yearReduced bookings YTD is the primary driver of the decline for mostSelected Metrics1ARR Growth39%20%2020 OriginalForecast2020 CurrentForecastGross New Bookings as a% of Starting ARR51%14%2019 2020 YTDChurn has ticked up, but only incrementally (so far) for mostSales productivity is down, but not as severely as one might havepredictedChurn12.5%13.9%20192020 YTDAnnualizedBlended CAC Ratio Companies cutting burn rates through RIFs and/or other means 1.10 1.3220192020 YTD BUT . Let’s recognize that this is still a clear bright spot given theeconomic backdrop!‒In 2020, 20% growth is very strong; 50% is off-the-chartsFCF Margin(19%)20191 MedianValues for Companies with 5M in 2019 ARR(12%)2020 CurrentForecast3
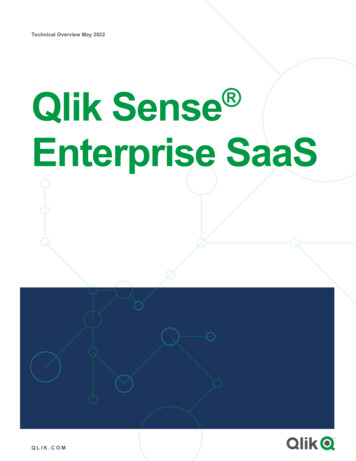
SUMMARY FINDINGS (CONT.)2020 Private SaaS Company SurveySelected (Relative) WinnersFastest Growers“Steady-Eddie” GrowersDev-OpsSecurityITSelected LosersAffected VerticalMarket SpecialistsHigh-Churn Players Unable toFund LossesUnderperformingPlayers Pre-COVID4
2020 Private SaaS Company SurveyLAST YEAR VS. THIS YEAR– DIFFERENT WORLDS!5
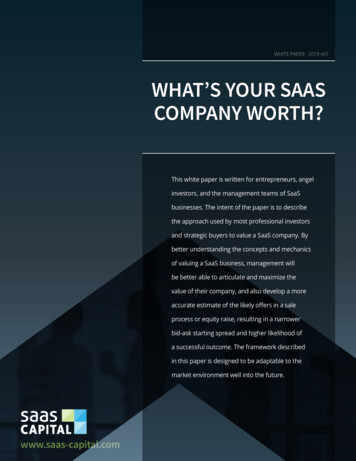
2019 LOOKED LIKE ANOTHER TYPICAL GROWTH YEAR IN SAAS 2020 Private SaaS Company Survey Median 5M ARR 35.7%41.2% across all Note: All annual recurring revenue (ARR) represents the committed ARR of SaaS subscriptions under contract (i.e., MRR*12) at the date indicatedRespondents: All: 484, 5M ARR: 3136
AND ORIGINAL EXPECTATIONS FOR 2020 WERE EVEN BETTER 2020 Private SaaS Company Survey Median 5M ARR 38.9%48.6% across all Respondents: All: 325, 5M ARR: 2297
NEEDLESS TO SAY, EXPECTATIONS HAVE CHANGED2020 Private SaaS Company Survey Median 5M ARR 20.5%26.3% across all % Change in 2020E ARR Forecast11 Original2020E Forecast vs. Current 2020E ForecastRespondents: All: 325, 5M ARR: 229 (45%) (25%)0%25% 45%8
HOW HAVE GROWTH AND CASH FLOW EXPECTATIONS CHANGED?2020 Private SaaS Company SurveyMedian Values for Companies with 5M in 2019 ARROverall MedianThroughout the survey, we will usescorecards to profile key summarymetrics.36%39% 2020E Original Forecast reflectsexpectations on 1/1/20 2020E Current Forecast reflectsrevised target as of 5/31/2020%ARR Growth7%2019AFCF Margin1(19% )2019A2020E2020EOriginal CurrentForecast Forecast(12% )Achievedthrough5/31/20 The dark green segment of 2020ECurrent ARR Forecast representsARR growth achieved through5/31/20(12% )2020E2020EOriginal 2 Current 2Forecast Forecast(Median ARR 19.0M n 313)1FCF Margins are based on GAAP revenues2020E FCF Margins estimated based on FCF projections directed provided by participants and derived estimates of 2020E GAAP revenues, sinceprojected GAAP figures were not directly asked for in the survey29
2020 Private SaaS Company SurveyWHAT IS IMPACTINGPERFORMANCE?10
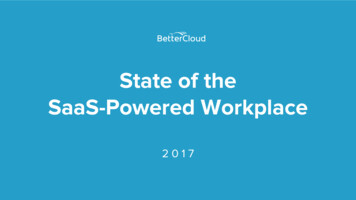
WHAT IS IMPACTING PERFORMANCE? – GROSS DOLLAR CHURN2020 Private SaaS Company SurveyMedian Values for Companies with 5M in 2019 ARRAnnual Gross Dollar Churn13.9%12.5%20% of 2020 YTD Churnwas Attributed to COVID2019 12020 YTD Gross Dollar Churn1Annualized% of Respondents2020 YTD Gross Dollar Churn Annualized25%Median 13.9%20%15%10%5%0%0% - 5% 5% - 10% 10% 15%15% 20%20% 25%25% 30%30% 35%35% 40%40% 45%45% 50%50% 55%55% 60%60% Net Dollar Retention22019: 102%2020 YTD: 99%12019 Annual Gross Dollar Churn measured on 2019 starting ARR; 2020 measured on 2020 starting ARR for the 5 months ended 5/31/20, thenannualized by multiplying by 12/52 Net Dollar Retention represents how much a company’s existing ARR base at the end of 2018 expanded or contracted, adding upsells andexpansion from existing customers, subtracting gross dollar churnNote: In the histogram, values that fall on the boundary between two bins are included in the bin to the rightRespondents: Annual Gross Dollar Churn 2019 / 2020 YTD Annualized: 249 / 249; Net Dollar Retention 2019 / 2020 YTD: 240 / 23111
WHAT IS IMPACTING PERFORMANCE? – NEW BOOKINGS2020 Private SaaS Company SurveyMedian Values for Companies with 5M in 2019 ARRGross New ARR Bookings % of Starting ARR51%38%64% of NewBookings fromNew Customers14%36% of NewBookings fromExisting Base 2019New BookingsAchieved YTD %of Starting ARR 2020E Current Forecast1Median 14%12020E forecast reflects 2020E bookings required to achieve 2020E ARR year-end forecast, assuming that full year gross churn is equal to YTDannualized gross churnRespondents: 2019: 249; 2020 YTD: 249; 2020E Current Forecast: 21912
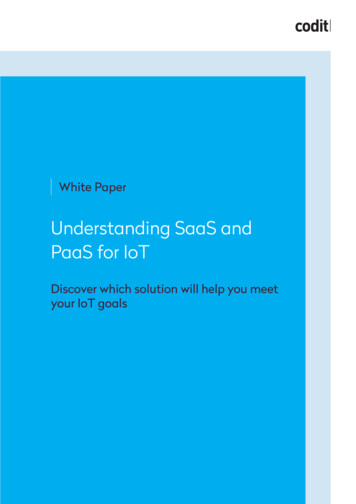
WHAT IS IMPACTING PERFORMANCE? – SALES EFFICIENCY2020 Private SaaS Company SurveyMedian Values for Companies with 5M in 2019 ARRCAC Ratio Comparison 1.60 1.35 1.32 1.10 0.69 0.61New Customer CAC RatioUpsell & Expansion CAC Ratio20192020 YTDNew Customer CAC RatioFully-loaded S&M spend to acquire 1 of new ARR from a new customerUpsell & Expansion CAC RatioFully-loaded S&M spend to acquire 1 of new ARR from upsells & expansionsBlended CAC RatioFully-loaded S&M spend to acquire 1 of new ARR across all customersBlended CAC Ratio1Fully-loaded S&M Targeted at New CustomersARR Bookings from New CustomersFully-loaded S&M Targeted at Upsell & ExpansionARR Bookings from Upsell & ExpansionFully-loaded S&MGross ARR Bookings12020 YTD CAC calculations assume the same S&M split between New Customer and Upsell & Expansion as in 2019Note: S&M costs do not factor in the costs attributed to renewals, for which the median was 9% of total S&M costsRespondents (2019 / 2020 YTD): New: 217 / 215, Upsell & Expansion: 207 / 192, Blended: 227 / 22413
WHAT IS IMPACTING PERFORMANCE? – CAC PAYBACK PERIOD2020 Private SaaS Company SurveyMedian Values for Companies with 5M in 2019 ARRCAC Payback Period (Years)(Adjusted Gross Margin Basis1)2.41.91.81.51.00.8New Customer CAC PaybackUpsell & Expansion CAC Payback20192020 YTDBlended CAC Payback2CAC Payback PeriodTime (years) it takes for recurring SaaS gross margin dollars, as adjusted forrecurring cost of renewals, to pay back the fully-loaded S&M cost of acquiringthe new bookingCAC RatioAdjusted SaaS Gross Margin11SaaS Gross Margin adjusted to include the S&M costs attributed to renewals2020 YTD CAC calculations assume the same S&M split between New Customer and Upsell & Expansion as in 2019; using 2019 Adjusted SaaSGross MarginRespondents (2019 / 2020 YTD): New: 213 / 203, Upsell & Expansion: 212 / 189, Blended: 222 / 220214
2020 Private SaaS Company SurveyWHICH COMPANIES AREMOST IMPACTED?15
WHO’S BEEN MOST AFFECTED?2020 Private SaaS Company SurveyMedian Values for Companies with 5M in 2019 ARRIn order to understand which companies have been most affected, we have plotted a histogram toillustrate the revisions to 2020 ARR forecasts and profiled two groups: Group N had the most negative adjustments Group P had the most positive adjustmentsMedian (13.0%)Group NGroup PNote: Group P respondents adjusted 2020 ARR forecasts most positively – from down less than 5% through no change, to increases in forecast(22% of total respondents); Group N respondents reduced their 2020E ARR forecasts by 20% or more (23% of total respondents)Note: Values that fall on the boundary between two bins are included in the bin to the rightRespondents: 22916
WHAT ATTRIBUTES DISTINGUISH GROUPS N AND P?2020 Private SaaS Company SurveyMedian Values for Companies with 5M in 2019 ARRGroup NGroup POverall Median59%54%39%36%31%28%ARR Growth28%20%8%9%6%2019A2019A2020E2020EOriginal CurrentForecast Forecast(21% )2020E2020EOriginal CurrentForecast Forecast(9% )(11% )(17% )(7% )7%2019A(19% )2020E2020EOriginal CurrentForecast Forecast(12% )(12% )(50% )FCF MarginSelected MetricsBookings YTD % of Starting ARR2019A2019A2020E2020EOriginal CurrentForecast Forecast(Median ARR 15.7M n 53)Respondents who revised 2020E ARRdown by 20%12020E2020EOriginal CurrentForecast Forecast(Median ARR 18.8M n 51)Respondents who revised 2020E ARRdown less than 5%, 0% or up22019A2020E2020EOriginal CurrentForecast Forecast(Median ARR 19.0M n 313)16%17%14%75% / 25%56% / 44%62% / 38% 44 59 3619% 20%12% 10%13% 14%GTM (Field / Inside / Mixed & Other)36% / 40% / 24%55% / 22% / 22%51% / 33% / 16%Ownership (VC / PE / Independent)Bookings Mix3 (New / Existing)Avg. Deal Size4 ( K)Gross Dollar Churn2019 2020 YTD Annualized77% / 12% / 10%49% / 29% / 22%62% / 23% / 14%New Customer CAC2019 2020 YTD5 1.06 1.53 1.07 1.17 1.35 1.60Blended CAC62019 2020 YTD 0.94 1.20 0.90 1.14 1.10 1. 32Pipeline / Close Rates Impact7(23%) / (18%)0% / (0%)(13%) / (8%)66%18%34%% Who Have Had RIFs1Reflects 23% of respondents2 Reflects 22% of respondents3 2020 YTD4 Across all customers5 2020YTD New Customer CAC assumes same S&M % targeted at newcustomers as in 20196 S&M costs do not factor in the costs attributed to renewals, for which the medianwas 9% of total S&M costs7 Impact of COVID on forward six-month pipeline and close rates vs. expectations17
ANALYSIS OF THE FASTEST GROWING COMPANIES2020 Private SaaS Company SurveyCompanies with 5M in 2019 ARRWe also wanted to evaluate how the fastest growing SaaS companies have beenimpacted relative to the overall median.2019 Growth Top Quartile2020 YTD Growth Top Quartile Respondents: 2019: 313, 2020 YTD: 304 18
HOW ARE THE FASTEST GROWING COMPANIES IMPACTED?2020 Private SaaS Company SurveyMedian Values for Companies with 5M in 2019 ARR2019 Top Growth Quartile2020 YTD Top Growth QuartileOverall Median96%80%83%63%60%41%39%36%ARR Growth20%24%17%2019A7%2019A2020E2020EOriginal CurrentForecast ForecastFCF Margin(23% )(49% )(71% )2019ASelected MetricsBookings YTD % of Starting ARR2020E2020EOriginal CurrentForecast Forecast2019A(19% )2020E2020EOriginal CurrentForecast Forecast(12% )(44% )(55% )2019A2020E2020EOriginal CurrentForecast Forecast(Median ARR 17.8M n 77)2020E2020EOriginal CurrentForecast Forecast(Median ARR 17.5M n 76)2019A2020E2020EOriginal CurrentForecast Forecast(Median ARR 19.0M n 313)24%30%14%67% / 33%67% / 33%62% / 38%13% 14%11% 13%13% 14%GTM (Field / Inside / Mixed & Other)51% / 31% / 19%48% / 27% / 25%51% / 33% / 16%Ownership (VC / PE / Independent)82% / 9% / 8%72% / 13% / 12%62% / 23% / 14%New Customer CAC2019 2020 YTD2 1.05 1.59 1.25 1.04 1.35 1.60Blended CAC32019 2020 YTD 0.81 1.28 0.97 0.85 1.10 1. 32Bookings Mix1 (New / Existing)Gross Dollar Churn2019 2020 YTD AnnualizedNumber of Companies in BothTop Quartile GroupsNumber of Companies in P Group41 (53%)12 (16%)(12% )(28% )NM15 (20%)51 (22%)12020 YTD2 2020 YTD New Customer CAC assumes same S&M % targeted at new customers as in 20193 S&M costs do not factor in the costs attributed to renewals, for which the median was 9% of total S&M costsIn order to maintain a balanced distribution of companies by size, we chose the top quartile growers for each of three separate ARR ranges: 5 – 15M, 15 – 40M and 40M in 2019 ARR. We then combined them into a single group19
AVERAGE DEAL SIZE (INITIAL CONTRACT)2020 Private SaaS Company SurveyCompanies with 5M in 2019 ARRAverage Deal Size(Initial Contract)Gross New ARR Bookings from New Customers in 2019 # of Paying Customers Added in 2019Over 250K9%Sub 15K32% 50 - 250K29% 15 - 50K30%Respondents: 24120
CORRELATION OF PERFORMANCE WITH AVERAGE DEAL SIZE(INITIAL CONTRACT)2020 Private SaaS Company SurveyMedian Values for Companies with 5M in 2019 ARR 15 – 50KSub 15K42%39%36% 50 – 250KOver 250K41%39%37%38%31%ARR Growth25%22%19%8%2019A(17% )FCF Margin2020E2020EOriginal CurrentForecast Forecast(11% )7%2019A2020E2020EOriginal CurrentForecast Forecast(8% )(25% )(30% )2019A2020E2020EOriginal CurrentForecast Forecast(Median ARR 22.0M n 77)Selected MetricsBookings YTD % of Starting ARRBookings Mix1 (New / Existing)Gross Dollar Churn2019 2020 YTD Annualized2019A(21% )2020E2020EOriginal CurrentForecast Forecast(Median ARR 20.4M n 72)19%6%6%2019A(21% )2020E2020EOriginal CurrentForecast Forecast(11% )2019A2020E2020EOriginal CurrentForecast Forecast(5% )(11% )2019A2020E2020EOriginal CurrentForecast Forecast(Median ARR 24.3M n 69)2019A2020E2020EOriginal CurrentForecast Forecast(Median ARR 15.0M n 23)17%13%11%12%62% / 38%62% / 38%65% / 35%71% / 29%18% 22%13% 16%10% 9%8% 6%GTM (Field / Inside / Mixed & Other)21% / 51% / 28%45% / 47% / 8%80% / 12% / 8%78% / 4% / 17%Ownership (VC / PE / Independent)59% / 22% / 18%67% / 22% / 10%62% / 28% / 9%65% / 17% / 17%New Customer CAC2019 2020 YTD2 1.25 1.20 1.50 1.68 1.38 2.16 1.15 2.16Blended CAC32019 2020 YTD 0.84 1.03 1.16 1.39 1.31 1.61 0.90 1.4939%53%29%30%% Who Have Had RIFs(10% )(40% )12020 YTDYTD New Customer CAC assumes same S&M % targeted at new customers as in 20193 S&M costs do not factor in the costs attributed to renewals, for which the median was 9% of total S&M costs2 202021
PRIMARY BUYER GROUP2020 Private SaaS Company SurveyCompanies with 5M in 2019 ARRWho is the Primary Buyer of Your Product at Your Customer?Other8%IT / Ops. /Security27%CEO / Owner14%Product / Dev. /Engineering8%Sales &Marketing24%Customer Support &Success5%Respondents: 311HumanResources9%Finance & Legal5%22
CORRELATION OF PERFORMANCE WITH PRIMARY BUYER GROUP2020 Private SaaS Company SurveyMedian Values for Companies with 5M in 2019 ARRIT / Ops. / SecurityProduct / Dev. / EngineeringHuman ResourcesFinance & Legal62%59%50%45%39%36%ARR Growth34%33%26%25%17%10%9%2019AFCF Margin2020E2020EOriginal CurrentForecast Forecast(12% )(29% )2019A2020E2020EOriginal CurrentForecast Forecast(32% )2020E2020EOriginal CurrentForecast Forecast(43% )(31% )Selected Metrics2020E2020EOriginal CurrentForecast Forecast(Median ARR 19.0M n 83)Bookings YTD % of Starting ARRBookings Mix1 (New / Existing)Avg. Deal Size2 ( K)Gross Dollar Churn2019 2020 YTD AnnualizedGTM (Field / Inside / Mixed & Other)New Customer CAC2019 2020 YTD34Blended CAC2019 2020 YTD% Who Have Had RIFs2019A2019A(22% )2020E2020EOriginal CurrentForecast Forecast(32% )(33% )(60% )(63% )2019A7%4%2019A(15% )(38% )15%2020E2020EOriginal CurrentForecast Forecast(Median ARR 25.4M n 24)2019A2020E2020EOriginal CurrentForecast Forecast(Median ARR 21.0M n 29)2019A2020E2020EOriginal CurrentForecast Forecast(Median ARR 22.0M n 15)14%16%16%13%60% / 40%59% / 41%73% / 27%70% / 30% 55 45 28 3510% 9%17% 14%13% 16%10% 10%65% / 17% / 18%47% / 47% / 5%48% / 42% / 10%67% / 33% / 0% 1.72 2.23 1.34 1.82 1.47 1.43 1.72 2.04 1.32 1.50 1.15 0.98 1.10 1.33 1.27 1.6230%25%52%53%12020 YTDAcross all customers3 2020 YTD New Customer CAC assumes same S&M % targeted at new customers as in 20194 S&M costs do not factor in the costs attributed to renewals, for which the median was 9% of total S&M costs223
CORRELATION OF PERFORMANCE WITH PRIMARY BUYER GROUP(CONT.)2020 Private SaaS Company SurveyMedian Values for Companies with 5M in 2019 ARRCustomer Support & SuccessARR GrowthSales & Marketing34%31%13%12%(9% )(13% )2019ASelected MetricsBookings YTD % of Starting ARRBookings Mix1 (New / Existing)Avg. Deal Size2 ( K)Gross Dollar Churn2019 2020 YTD AnnualizedGTM (Field / Inside / Mixed & Other)New Customer CAC2019 2020 YTD34Blended CAC2019 2020 YTD% Who Have Had RIFs2020E2020EOriginal CurrentForecast Forecast(4% )2020E2020EOriginal CurrentForecast Forecast(Median ARR 14.0M n 14)10%6%5%FCF Margin37%33%25%23%2019ACEO / Owner2019A(16% )2019A5%2020E2020EOriginal CurrentForecast Forecast(10% )2019A(8% )(10% )2019A2020E2020EOriginal CurrentForecast Forecast(Median ARR 20.1M n 76)2020E2020EOriginal CurrentForecast Forecast(3% )(7% )2020E2020EOriginal CurrentForecast Forecast(Median ARR 11.6M n 45)9%12%14%54% / 46%60% / 40%87% / 13% 60 39 613% 13%18% 17%12% 19%44% / 44% / 11%51% / 36% / 13%24% / 46% / 30% 1.75 2.17 1.12 1.43 0.85 1.00 1.02 1.75 1.10 1.12 0.80 0.8536%47%40%12020 YTDAcross all customers3 2020 YTD New Customer CAC assumes same S&M % targeted at new customers as in 20194 S&M costs do not factor in the costs attributed to renewals, for which the median was 9% of total S&M costs224
APPLICATION TYPE2020 Private SaaS Company SurveyCompanies with 5M in 2019 ARRWhich category best fits your SaaS Product? 1) Horizontal Application; 2) Vertical Market Application; 3)Infrastructure Software; 4) OtherOther2%Infrastructure ontalApplication53%Vertical Market Application(Serving Significantly Impacted1Industries)5%1Indicates Vertical Market Application companies who have at least 70% of their YE 2019 customers in industries which have experienced a significantnegative impact from COVIDRespondents: 31225
CORRELATION OF PERFORMANCE WITH APPLICATION TYPE2020 Private SaaS Company SurveyMedian Values for Companies with 5M in 2019 ARRVertical (Significantly Impacted)1HorizontalOther RR Growth20%18%9%0%6%2019A2020E2020EOriginal CurrentForecast Forecast2019A2020E2020EOriginal CurrentForecast Forecast12%7%2019A2020E2020EOriginal CurrentForecast Forecast2019A2020E2020EOriginal CurrentForecast Forecast4%(18% )FCF Margin2019ASelected Metrics(19% )(12% )2020E2020EOriginal CurrentForecast Forecast(Median ARR 19.5M n 164)Bookings YTD % of Starting ARR2019A(8% )(18% )(11% )(8% )2020E2020EOriginal CurrentForecast Forecast(Median ARR 9.7M n 17)(13% )(29% )(11% )2019A2020E2020EOriginal CurrentForecast Forecast(Median ARR 14.2M n 68)2019A2020E2020EOriginal CurrentForecast Forecast(Median ARR 22.3M n 56)13%11%12%17%66% / 34%63% / 37%62% / 38%59% / 41% 35 11 36 5417% 16%13% 19%10% 9%11% 11%GTM (Field / Inside / Mixed & Other)50% / 32% / 18%41% / 47% / 12%46% / 43% / 11%64% / 20% / 16%Ownership (VC / PE / Independent)Bookings Mix2 (New / Existing)Avg. Deal Size3 ( K)Gross Dollar Churn2019 2020 YTD Annualized62% / 22% / 14%65% / 24% / 12%57% / 24% / 19%66% / 23% / 11%New Customer CAC2019 2020 YTD4 1.46 1.47 0.82 1.44 1.03 1.42 1.73 2.10Blended CAC52019 2020 YTD 1.11 1.34 0.81 1.60 0.93 1.07 1.32 1.5046%29%38%25%% Who Have Had RIFs(17% )1Indicates Vertical Market Application companies who have at least 70% of their YE 2019 customers in industries which have experienced a significantnegative impact from COVID2 2020 YTD3 Across all customers4 2020 YTD New Customer CAC assumes same S&M % targeted at new customers as in 20195 S&M costs do not factor in the costs attributed to renewals, for which the median was 9% of total S&M costs26
PRIMARY MODE OF DISTRIBUTION2020 Private SaaS Company SurveyCompanies with 5M in 2019 ARRPrimary Mode of Distribution is defined by determining the greatest contributor to newsales and confirming that it is at least a 20% point higher contributor than any other.If no mode satisfies these conditions, then it is MixedChannel &Other3%Web-BasedSales2%Mixed11%Field Sales51%Inside Sales33%Respondents: 22727
CORRELATION OF PERFORMANCE WITH PRIMARY MODE OFDISTRIBUTION2020 Private SaaS Company SurveyMedian Values for Companies with 5M in 2019 ARRField SalesInside Sales40%38%36%33%22%20%ARR Growth7%2019AFCF Margin(18% )2019ASelected MetricsBookings YTD % of Starting ARR2020E2020EOriginal CurrentForecast Forecast(11% )(14% )2020E2020EOriginal CurrentForecast Forecast(Median ARR 25.2M n 115)7%2019A2020E2020EOriginal CurrentForecast Forecast(24% )2019A(18% )2020E2020EOriginal CurrentForecast Forecast(Median ARR 18.0M n 76)12%14%61% / 39%64% / 36% 89 1665% / 22% / 11%70% / 18% / 12%10% 10%18% 17%New Customer CAC2019 2020 YTD3 1.52 2.05 1.21 1.42Blended CAC42019 2020 YTD 1.20 1.56 1.00 1.1230%51%Bookings Mix1 (New / Existing)Avg. Deal Size2 ( K)Ownership (VC / PE / Independent)Gross Dollar Churn2019 2020 YTD Annualized% Who Have Had RIFs(13% )12020 YTDAcross all customers3 2020 YTD New Customer CAC assumes same S&M % targeted at new customers as in 20194 S&M costs do not factor in the costs attributed to renewals, for which the median was 9% of total S&M costs228
OWNERSHIP2020 Private SaaS Company SurveyCompanies with 5M in 2019 ARRCharacterize the current ownership of the business: 1) VC-Backed (no majority owner);2) Sponsor / PE-backed (controlled); 3) Independent and/or bootstrapped; 4) OtherIndependent /Bootstrapped14%Other1%Sponsor / PEBacked23%VC-Backed62%Respondents: 31129
CORRELATION OF PERFORMANCE WITH OWNERSHIP2020 Private SaaS Company SurveyMedian Values for Companies with 5M in 2019 ARRVC-BackedSponsor / PE-BackedIndependent / Bootstrapped47%42%ARR al CurrentForecast Forecast2019A3%2020E2020EOriginal CurrentForecast Forecast0%(3% )FCF Margin(43% )(30% )7%2019A2020E2020EOriginal CurrentForecast Forecast(1% )(23% )8%2019ASelected MetricsBookings YTD % of Starting ARR1Bookings Mix (New / Existing)Avg. Deal Size2 ( K)Gross Dollar Churn2019 2020 YTD AnnualizedGTM (Field / Inside / Mixed & Other)2020E2020EOriginal CurrentForecast Forecast2019A2020E2020EOriginal CurrentForecast Forecast2019A6%2020E2020EOriginal CurrentForecast Forecast(Median ARR 19.0M n 193)(Median ARR 25.9M n 70)(Median ARR 8.5M n 45)15%11%12%65% / 35%59% / 41%63% / 37% 39 44 2314% 15%10% 11%12% 13%51% / 36% / 13%52% / 29% / 19%45% / 31% / 24%New Customer CAC2019 2020 YTD3 1.48 1.74 1.20 1.72 0.95 1.12Blended CAC42019 2020 YTD 1.18 1.40 1.08 1.30 0.85 0.9643%39%27%% Who Have Had RIFs8%12020 YTDAcross all customers3 2020 YTD New Customer CAC assumes same S&M % targeted at new customers as in 20194 S&M costs do not factor in the costs attributed to renewals, for which the median was 9% of total S&M costs230
SIZE OF COMPANY (2019 ARR)2020 Private SaaS Company SurveyDistribution of 2019 Ending ARROver 75M8%Sub 5M38% 15 - 75M28% 5 - 15M26%Respondents: 50331
CORRELATION OF PERFORMANCE WITH SIZE OF COMPANY (2019 ARR)2020 Private SaaS Company SurveyMedian Values 5 – 15M 15 – 75MOver 75M48%37%36%37%31%26%25%19%ARR Growth9%2019AFCF Margin(13% )Bookings YTD % of Starting ARR(13% )(26% )2019ASelected Metrics2020E2020EOriginal CurrentForecast Forecast2020E2020EOriginal CurrentForecast Forecast(Median ARR 8.6M n 133)17%6%2019A(22% )2019A2020E2020EOriginal CurrentForecast Forecast(12% )(12% )2020E2020EOriginal CurrentForecast Forecast(Median ARR 27.7M n 140)6%2019A(16% )2019A2020E2020EOriginal CurrentForecast Forecast(11% )2020E2020EOriginal CurrentForecast Forecast(Median ARR 99.0M n 40)15%13%11%67% / 33%62% / 38%56% / 44% 35 37 3913% 14%13% 14%11% 13%GTM (Field / Inside / Mixed & Other)42% / 40% / 18%52% / 34% / 14%69% / 16% / 16%Ownership (VC / PE / Independent)60% / 13% / 26%64% / 28% / 7%63% / 35% / 0% 1.16 1.36 1.46 1.98 1.41 1.45Blended CAC2019 2020 YTD 1.03 1.16 1.13 1.50 0.89 1.26Pipeline / Close Rates Impact5(14%) / (11%)(13%) / (8%)(9%) / (6%)35%45%30%Bookings Mix1 (New / Existing)Avg. Deal Size2 ( K)Gross Dollar Churn2019 2020 YTD AnnualizedNew Customer CAC2019 2020 YTD34% Who Have Had RIFs(8% )12020 YTD3 Across all customers3 2020 YTD New Customer CAC assumes same S&M % targeted at new customers as in 20194 S&M costs do not factor in the costs attributed to renewals, for which the median was 9% of total S&M costs5 Impact of COVID on forward six-month pipeline and close rates vs. expectations32
2020 Private SaaS Company SurveyWHAT’S HAPPENINGIN THE FIELD ANDWHAT’S BEEN THERESPONSE?33
IMPACT OF COVID ON FORWARD SIX-MONTH SALES PIPELINE2020 Private SaaS Company SurveyCompanies with 5M in 2019 ARRMedian -12.5%(–)( ) 52% of these companies have had RIFsRespondents: 23034
IMPACT OF COVID ON CLOSE RATES2020 Private SaaS Company SurveyCompanies with 5M in 2019 ARRMedian -8.0%Respondents: 229(–)( )35
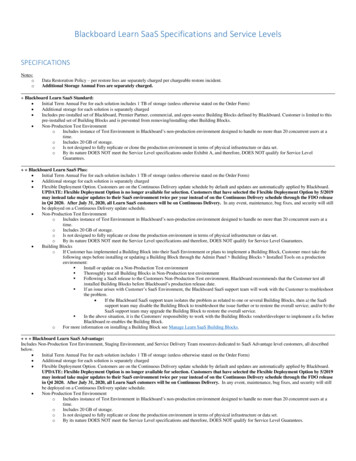
LAYOFFS AND FURLOUGHS2020 Private SaaS Company SurveyMedian Values for Companies with 5M in 2019 ARRCuts by % of Employees / s for Those Who ActedHave you had a Reduction in Force (RIF) orFurloughed FTEs since March 15, 2020?RIF Savings % of 2019 Ending ARRMedian: 9.2%RIF % of FTEsMedian: 12.6%34%Yes39%% of Respondents30%23%22%15%12%11%8%7%Less than 5% 5% - 10%12%9%5%9%3%10% - 15% 15% - 20% 20% - 25% 25% - 30%Over 30%Savings Allocation by DepartmentNo61%35%15%SalesCustomer Support/ Success15%R&D10%10%MarketingG&A1Only includes respondents that had a RIF since March 15, 2020Note: In the histogram, values that fall on the boundary between two bins are included in the bin to the rightRespondents: RIFs: 122, No RIFs: 19036
2020 Private SaaS Company SurveyOTHER HIGHLIGHTS37
SURVEY PARTICIPANT GEOGRAPHY (HQ)2020 Private SaaS Company Survey95 223435U.S. RegionsNorthern California / Silicon ValleyMidwest / ChicagoBoston / New EnglandNew York Metropolitan AreaSoutheast U.S.Pacific NorthwestSouthern CaliforniaColorado / UtahTexasMid-Atlantic / DCOther U.S.Total U.S.382013212919Other Locations3778334111131316Number ofRespondents953835342922212019137333Number ofRespondentsMedian 2019Ending ARR( in M) 14.39.45.216.56.68.78.614.06.012.510.0 10.2Median 2019Ending ARR( in M)EuropeCanadaAustralia / New ZealandLatin AmericaAsiaIsraelMiddle East – AfricaOtherTotal Non-U.S.78371613111131170 7.07.52.02.23.06.00.913.0 5.9TOTAL503 8.238
SURVEY PARTICIPANT SIZE DISTRIBUTION2020 Private SaaS Company SurveyAnnual Recurring Revenue at Year-End 201970Median Across All 8.2M60Median 5M ARR 19.0M# of Respondents50403020100Under 500K - 750K - 1.25M - 2.5M - 5M - 7.5M - 10M - 15M 500K 750K 1.25M 2.5M 5M 7.5M 10M 15M 25M2019 Ending ARRNote: Values that fall on the boundary between two bins are included in the bin to the rightRespondents: All: 503, 5M ARR: 313 25M - 40M - 60M - 75M - 100M - Over 40M 60M 75M 100M 200M 200M39
HUMAN CAPITAL EFFICIENCY2020 Private SaaS Company Survey2019 ARR per FTE 248K 250K75thPercentile 212K 206K 194K 200K 180K2019 Ending ARR per FTEMedian 146K 146K 120K 123K 137K 115K 134KMedian 5M ARR 138K 113K across all 100K 100K 187K 163K 164K 150K 172K25thPercentile 91K 103K 93K 76K 53K 50K 57K 28K 0K 2.5M 2.5M - 5M 5M - 10M 10M - 25M 25M - 50M2019 Ending ARR 50M - 75M 75M - 100M 100MNote: Values that fall on the boundary between two bins are included in the bin to the rightRespondents: All: 495, 2.5M: 127, 2.5M - 5M: 60, 5M - 10M: 83, 10M - 25M: 101, 25M - 50M: 51, 50M - 75M: 33, 75M - 100M: 21, 100M: 1940
LIFETIME TO-DATE CAPITAL CONSUMPTION RATIO12020 Private SaaS Company SurveyCompanies with 5M in 2019 ARRLifetime To-DateCapital Consumption RatioTotal Lifetime To-Date Capital Consumed1ARR Achieved5.0x4.4x4.5xCapital Consumption x2.0x1.8x1.8x1.6x1.5x1.3xMedian1.4x1.2x1.1xMedian 0.6x0.5x0.1x0.0xOverall ( 5M ) 5M - 10M 10M - 20M 20M - 30M2019 Ending ARR 30M - 50M 50M - 75M 75M1 Definedas total primary cumulative equity raised plus debt drawn minus cash on the balance sheet (adjusted for dividends / distributions) as ofyear-end 2019Note: Values that fall on the boundary between two bins are included in the bin to the rightRespondents: All: 198, 5M - 10M: 46, 10M - 20M: 48, 20M - 30M: 32, 30M - 50M: 22, 50M - 75M: 26, 75M: 2441
LIFETIME TO-DATE CAPITAL CONSUMPTION RATIO1 HISTOGRAM2020 Private SaaS Company SurveyCompanies with 5M in 2019 ARRLifetime To-DateCapital Consumption RatioTotal Lifetime To-Date Capital Consumed1ARR AchievedLess Capital EfficientMore Capital EfficientMedian 1.3x20%18%16%% of Respondents14%12%10%8%6%4%2%0%5x 4x13x2x1xDefined as total primary cumulative equity raised plus debt drawn minus cash on the balance sheet (adjusted for dividends / distributions) asof year-end 20192 Negative capital consumption implies net capital creation of the company over its life-to-dateNote: Values that fall on the bounda
2020 Private SaaS Company Survey 3 SUMMARY FINDINGS 2020E top-line growth projections have been nearly cut in half Selected Metrics1 - Median 2020E ARR growth now 20% vs. 36% in 2019, and 40% originally expected - Top quartile growers down similarly, at 50% growth vs. 100%