Transcription
2019 Private SaaS Company Survey2019SAASSURVEYRESULTS10TH ANNUAL1
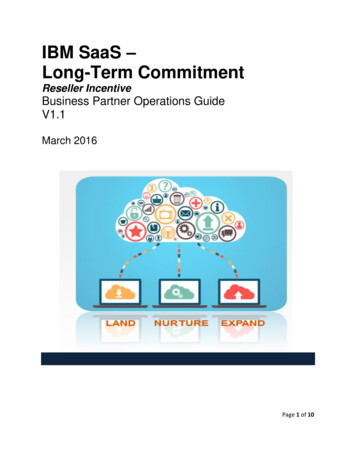
KBCM TECHNOLOGY GROUP 2019 PRIVATE SAAS COMPANY SURVEY2019 Private SaaS Company Survey This report provides an analysis of the results of a survey of private SaaS companies which KBCMTechnology Group’s software investment banking team (formerly Pacific Crest Securities) conducted inJune – July 2019 Results include responses from senior executives of 424 companies Special thanks to our partners at Matrix Partners and the ForEntrepreneurs blog for help solicitingparticipants and republishing this report Representative statistics on the survey participants: 8.7MM median 2018 Ending ARR1, with 97 companies 25MM Median organic growth in ARR in 2018 was 40% and 35% for companies 25MM Median employees (FTEs): 90 Median customer count: 300 28K median annual contract value 65% headquartered in the U.S.Our goal is to provide useful operational and financial benchmarking data toexecutives and investors in SaaS companies.1 ARRis defined as committed annual recurring revenue run-rate2
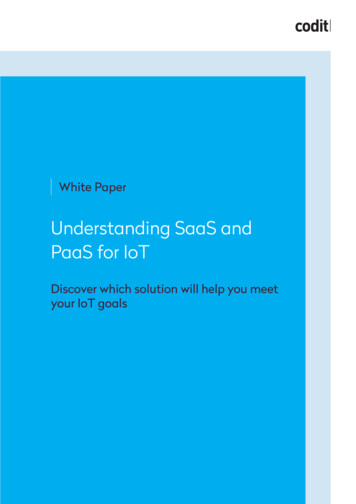
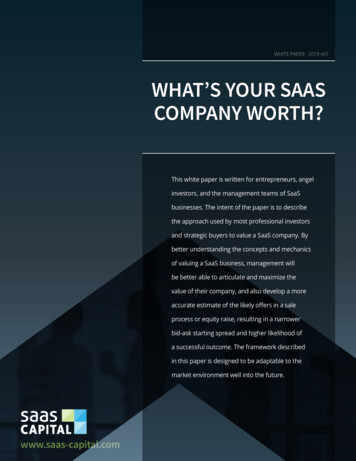
SUMMARY VIEW OF MEDIAN 2018 SAAS METRICS PERFORMANCE2019 Private SaaS Company SurveyExcluding Companies 5MM in 2018 Ending ARR2018 ARRBookings2018 GrossDollar ChurnM&A &Other( 13% of 2017year-end ARR)Median 2018 OrganicARR Growth 36%2017 Year-End ARR2018 Year-End ARR(excl. M&A)2018 Sources of Gross NewARR Bookings37%CAC and CapitalConsumption2018 Blended CAC RatioFully-loaded S&M spend to acquire 1 of new ARRacross all customers 1.14Capital Consumption63%Cumulative capital consumed for each 1 of ARRachieved to date by year-end 2018New Customers 1.47Upsells and ExpansionsRespondents: Organic ARR Growth: 225, Sources of Gross New ARR Bookings: 214, Blended CAC: 197, 2018 In-Year CapitalConsumption Ratio: 175, Cumulative Capital Consumption Ratio: 158, Gross Dollar Churn: 2163
2019 Private SaaS Company SurveySURVEY PARTICIPANTCOMPOSITION4
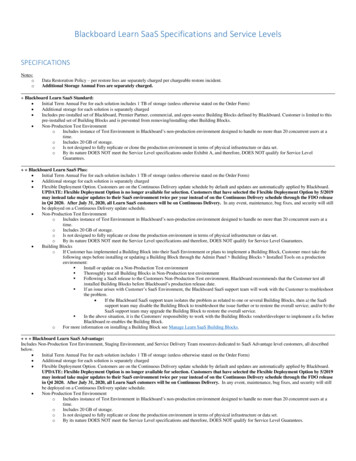
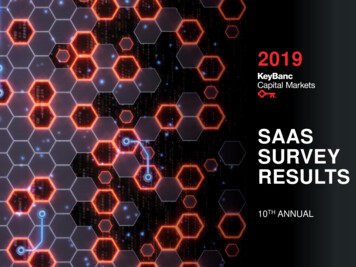
SURVEY PARTICIPANT GEOGRAPHY (HQ)2019 Private SaaS Company Survey19713631U.S. RegionsNorthern California / Silicon ValleyNew York Metropolitan AreaBoston / New EnglandMidwest / ChicagoSoutheast U.S.Pacific NorthwestMid-Atlantic / DCTexasColorado / UtahSouthern CaliforniaOther U.S.Total U.S.29121792014Other Locations30812745811213Number ofRespondents713631292019171412916274Number ofRespondentsMedian 2018Ending ARR( in MM) 19.216.010.48.39.26.89.08.67.614.76.2 11.3Median 2018Ending ARR( in MM)EuropeCanadaAustralia / New ZealandLatin AmericaIsraelAsiaMiddle East – AfricaTotal Non-U.S.81301312851150 6.65.21.82.018.75.00.1 5.0TOTAL424 8.75
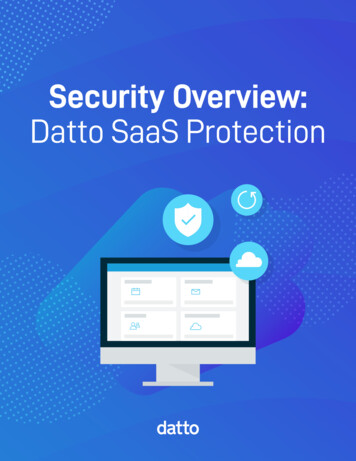
SURVEY PARTICIPANT SIZE DISTRIBUTION2019 Private SaaS Company Survey2018 ARR: Contracted Annual Recurring Revenue at Year-End 2018Median 8.7MM6053535050Number of Companies4445403030262027271815111010960 500K 500K - 750K - 1.25MM 2.5MM - 5MM - 7.5MM - 10MM - 15MM - 25MM - 40MM - 60MM - 75MM - 100MM - 200MM 750K 1.25MM - 2.5MM 5MM 7.5MM 10MM 15MM 25MM 40MM 60MM 75MM 100MM 200MM2018 Ending ARR424 respondents6
HUMAN CAPITAL EFFICIENCY2019 Private SaaS Company SurveyARR per FTE 300K 265KMedian 2018 Ending ARR per FTE 250K 226K 204K 200K 200K 168K 149K 150K 162K 150K 5M ARRMedian 139K 130K 120K 100K 83K 59K 87K 127K 93K75thpercentile 68K 71K 2.5MM - 5MM 5MM - 10MMMedian 117K 92K 178KOverallMedian 110K 50K 35K25thpercentile K 2.5MM 10MM - 25MM 25MM - 50MM 50MM - 100MM 100M2018 Ending ARRRespondents (ARR per FTE Efficiency): 422, 2.5MM: 99, 2.5MM- 5MM: 52, 5MM- 10MM: 71, 10MM- 25MM: 103, 25MM 50MM: 46, 50MM- 100MM: 36, 100MM: 157
2019 Private SaaS Company SurveyGROWTH RATES8
ORGANIC ARR GROWTH2019 Private SaaS Company Survey60%57%50%2018 Organic ARR Growth Rate50%45%44%OverallMedian 40.3%41%40%38% 5MMMedian 36.3%32%32%30%26%26%20%10%0% 2.5MM 2.5MM 5MM 5MM 10MM 10MM 15MM 15MM 25MM 25MM 35MM 35MM 50MM 50MM 75MM 75MM 100MM 100MM2018 Ending ARRNote: Excludes growth from M&ARespondents: Total: 324, 2.5MM: 60, 2.5MM- 5MM: 39, 5MM- 10MM: 57, 10MM- 15MM: 36, 15MM- 25MM: 47, 25MM 35MM: 17, 35MM-50MM: 23, 50MM- 75MM: 25, 75MM- 100MM: 8, 100MM: 129
ORGANIC ARR GROWTH HISTOGRAM2019 Private SaaS Company SurveyExcluding Companies 5MM in 2018 Ending ARR5047Median 36.3%Number of Companies403028282520169101011128664542111102018 Organic ARR Growth225 respondents10
HOW FAST DID YOU GROW ARR ORGANICALLY IN 2018?2019 Private SaaS Company SurveyScatter View of Companies 10MM in 2018 Ending ARR200% Median 36.4% Note: Excludes companies with negative or no organic ARR growth162 respondents11
GROWTH VS. BURN TRADEOFF2019 Private SaaS Company SurveyScatter View of Companies 10MM in 2018 Ending ARR200% Free Cash Flow Margin (100%)(66%)(30%)0% 30% Note: Excludes companies with negative or no organic ARR growth128 respondents12
MEDIAN GROWTH AS A FUNCTION OF CONTRACT SIZE2019 Private SaaS Company SurveyExcluding Companies 5MM in 2018 Ending ARR45%There appears to be no obvious relationshipbetween median contract size and growth43%40%40%36%35%34%33% 50K- 100K 100K- 250KMedian 34.5%31%2018 Organic ARR Growth30%30%25%20%15%10%5%0% 5K 5K- 15K 15K- 25K 25K- 50KMedian Annual Contract Value 250K(ACV)11Median Annual Contract Value (ACV): annual recurring SaaS revenues, excluding professional services, perpetual licenses and relatedmaintenance for the median customer contractNote: Median value may vary due to different sample populationRespondents/Median ARR: Total: 183, 5K: 27/ 14MM; 5K- 15K: 30/ 13MM; 15K- 25K: 15/ 18MM; 25K- 50K: 37/ 16MM; 50K 100K: 25/ 19MM; 100K- 250K: 30/ 24MM; 250K: 19/ 33MM13
MEDIAN GROWTH RATE AS A FUNCTION OF TARGET CUSTOMER12019 Private SaaS Company SurveyExcluding Companies 5MM in 2018 Ending ARRCompanies focusing mainly on mid-sized and smallercustomers, grew modestly faster than the other groups50%45%43%39%40%2018 Organic ARR Growth35%35%34%34%EnterpriseEnterprise / Middle MarketMedian 36.3%30%25%20%15%10%5%0%Middle Market / SMBSMB / VSBMixedTarget Customer Focus – At least 2/3rds of revenue come from designated customer baseNote: Enterprise companies defined as primarily targeting customers with 1000 employees, Middle Market as 100-999 employees, SMBas 20-100 employees and VSB as 20 employeesRespondents: Total: 225, Enterprise: 78, Enterprise / Middle Market & Middle Market: 85, Middle Market / SMB & SMB: 34, SMB / VSB &VSB: 17, Mixed: 11114
RELIANCE ON UPSELLS & EXPANSIONS2019 Private SaaS Company SurveyExcluding Companies 5MM in 2018 Ending ARRThe median respondent gets 37% of newARR bookings from upsells & expansions;larger companies rely more heavily ( 1.4xmore) on upsells & expansions.% New ARR Bookings from Upsells & Expansions1% New ARR Added in 2018 fromUpsells& %OverallAverage 25thpercentile18%17%0% 5MM- 10MM 10MM- 15MM 15MM- 25MM 25MM- 50MM 50MM - 100MM 100M2018 Ending ARR1Includes 2.5% attributable to Price IncreasesRespondents: Total: 214, 5MM- 10MM: 52, 10MM- 15MM: 35, 15MM- 25MM: 44. 25MM- 50MM: 39, 50MM- 100MM: 32, 100MM: 1215
2019 Private SaaS Company SurveyGO-TO-MARKET ANDSALES AND MARKETING16
PRIMARY MODE OF DISTRIBUTION12019 Private SaaS Company SurveySmaller CompaniesLarger Companies 10MM in 2018 Ending ARR 10MM in 2018 Ending ARRChannel MixedSales8%4%InternetSales9%Field Sales41%Channel Mixed12%Sales4%InternetSales2%Field Sales54%InsideSales38%InsideSales28%1Primary Mode of Distribution defined by determining the greatest contributor to new sales and confirming that it is at least a 20% point highercontributor than any other. If no mode satisfies these conditions, then it is Mixed144 and 155 respondents, respectively17
MEDIAN GROWTH RATE AS A FUNCTION OF SALES STRATEGY2019 Private SaaS Company SurveyExcluding Companies 10MM in 2018 Ending ARR60%50%2018 Organic ARR Growth50%40%36%Median 36.3%33%30%20%10%0%Field SalesInside SalesPrimary Mode of Distribution1Mixed1See definition on page 17Respondents/Median ARR: Total: 141, Field Sales: 84/ 22MM, Inside Sales: 40/ 15MM, Mixed: 17/ 24MMNote: Internet Sales and Channel Sales excluded due to small sample size: Internet Sales: 3/ 17MM, Channel Sales: 5/ 12MM18
1PRIMARY MODE OF DISTRIBUTION AS A FUNCTION OFINITIAL MEDIAN CONTRACT SIZE2019 Private SaaS Company SurveyField SalesInside SalesInternet SalesChannel Sales100%90%6%10%9%9%5%5%29%4%10%12%7%13%89%87% 100K 250K 250K5%7%80%15%14%Field Sales dominatesfor companies withmedian initial contractsover 50K. Inside Salesstrategies are mostpopular amongcompanies with 1K 25K initial deal 20%36%29%21%10%26%0% 1K 1K - 5K 5K - 15K 15K - 25K 25K - 50K 50K 100KMedian Initial Contract Size (ACV)1See definition on page 17Respondents: Total: 251, 1K: 7, 1K- 5K: 47, 5K- 15K: 42, 15K- 25K: 22, 25K- 50K: 48, 50K- 100K: 42, 100K- 250K: 28, 250K: 15.19
ANALYSIS OF FIELD VS. INSIDE SALES IN KEY CROSSOVER DEALSIZE TIERS2019 Private SaaS Company SurveyExcluding Companies 5MM in 2018 Ending ARR 15K– 50K Median Initial Annual Contract SizeMedianField-DominatedInside-Dominated 16MM 20MM30%29%(18%)(28%)16%(1%)2018 ARR per FTE 134K 143KS&M % of Revenue45%45%Median Initial ACV per Customer 30K 31K1.5 Years1 YearProfessional Services Attach Rate5.0%2.5%Commissions for New Sales to New Accounts –Direct10%10%Annual Gross Dollar Churn114%16%% of New ARR from Upsells and Expansions36%29%Net Dollar Retention Rate2103%96%New CAC Ratio3 1.43 1.39Capital Consumption Ratio1.61x2.32x2018 Ending ARR2018 Organic ARR Growth Rate2018 FCF Margin2018 Rule of 40Average Contract Length1 TheAmongcompaniesselling 15K 50K averageACV, wecompared thosefavoring Field vs.Inside and foundField Salesdrivencompanies hadlower churn andhigher net dollarretention ratesalthough CACRatios werecomparable.% of dollar ARR under contract at the end of the prior year which was lost during the most recent year (excludes the benefits of upsells and expansions)% change in ACV from existing customers, resulting only from the effect of churn, upsells / expansions and price increases3 Fully-loaded sales & marketing spend divided by new ARR components excluding churn20Respondents: Total: 44, Field-Dominated: 27, Inside-Dominated: 172 The
SALES & MARKETING SPEND VS. GROWTH RATE2019 Private SaaS Company SurveyExcluding Companies 5MM in 2018 Ending ARR140%131%120%Median 2018 Organic ARR Growth 0%12%12% 20%20-40%41%31%27%0%40-60%60-80%80-100%100-120% 120%2018 Sales & Marketing Spend as % of RevenueRespondents: Total: 199; 20%: 28, 20-40%: 65, 40-60%: 45, 60-80%: 22, 80-100%: 15, 100-120%: 15, 120%: 921
S&M COMPOSITION: SALES VS. MARKETING COST2019 Private SaaS Company SurveyExcluding Companies 10MM in 2018 Ending ARRSales vs. Marketing Spend of Companiesby Primary Mode of 0%OverallField SalesInside Sales80%60%40%78.0%20%0%SalesMixedMarketing1See definition on page 17Respondents: Overall: 132, Field Sales: 78, Inside Sales: 38, Mixed: 16Note: Internet Sales 3 and Channel Sales 5, excluded due to small sample size.22
S&M COMPOSITION: SALES VS. MARKETING COST CLOSE-UP2019 Private SaaS Company SurveyExcluding Companies 10MM in 2018 Ending ARRSales vs. Marketing Spend of Companiesby Primary Mode of Distribution1100%Sales: 85%Marketing: 15%90%Sales: 80%Marketing: 20%80%75thPercentile70.0%70%Sales: 77%Marketing: 23%70.0%Sales: 80%Marketing: 20%78.0%70.0%Median25thPercentile Sales: 63%Sales: 63%Marketing: 37%Marketing: 37%60%Sales: 63%Marketing: 37%50%Sales: 50%Marketing: 50%40%OverallField SalesInside SalesMixed1 Seedefinition on page 17above the 75th percentile3 Respondents below the 25th percentileRespondents: Overall: 132, Field Sales: 78, Inside Sales: 38, Mixed: 162 Respondents23
2019 Private SaaS Company SurveyCAC RATIOS ANDCAC PAYBACK24
CAC RATIO DEFINITIONS2019 Private SaaS Company SurveyBlended CAC RatioFully-loaded S&M spend to acquire 1 of new ARR across all customersNew Customer CAC RatioFully-loaded S&M spend to acquire 1 of new ARR from a new customerUpsell CAC RatioFully-loaded S&M spend to acquire 1 of new ARR from upsellsExpansion CAC RatioFully-loaded S&M spend to acquire 1 of new ARR from expansions2018 Fully-loaded S&M2018 Gross ARR Bookings2018 Fully-loaded S&MTargeted at New Customers2018 ARR Bookings fromNew Customers2018 Fully-loaded S&MTargeted at Upsell2018 ARR Bookings fromUpsell2018 Fully-loaded S&MTargeted at Expansion2018 ARR Bookings fromExpansionNote that we acknowledge some companies may believe it’s appropriate to assume a slight timing difference in their CAC Ratioanalysis – S&M expenses determining future period ARR bookings, but for simplicity and consistency, we do not attempt to capturesuch assumptions here25
DISTRIBUTION OF 2018 CAC RATIOS2019 Private SaaS Company SurveyExcluding Companies 5MM in 2018 Ending ARRThe median blendedCAC of 1.14 providesan all-in benchmark.Median new customerCAC of 1.34 is almostdouble upsell CAC( 0.78) and nearly 3.0xexpansion CAC ( 0.50). 2.40 2.16 2.00 1.71 1.6025thpercentile 1.51 1.34 1.20 1.14Median 0.80 0.7775thpercentile 1.03 0.78 0.85 0.50 0.40 0.37 0.08 Blended CAC Ratio1New Customer CAC Ratio1Upsell CAC Ratio1Expansion CAC RatioNote: Based on 2018 CAC Ratios1 See definitions on page 25Respondents: Blended CAC: 197, New ARR from New Customer: 195, Upsells to Existing Customer: 152, Expansions: 137126
1CAC PAYBACK PERIOD (GROSS MARGIN BASIS)2019 Private SaaS Company SurveyExcluding Companies 5MM in 2018 Ending ARRNumber of CompaniesHow Long Does It Take to Recover Blended CAC vs. New Customer CAC, Based on Gross MarginSubscription Dollars Received?Blended CACPayback PeriodMedian 17 Months1 Year2 Years3 Years 4 Years3 Years 4 YearsMedian 20 MonthsNew Customer CACPayback Period1 Year2 Years1Implied CAC Payback Period: Defined as # of months of subscription gross profit required to recover the fully-loaded cost of acquiringa customer; calculated by dividing CAC ratio by subscription gross marginRespondents: New Customer CAC Payback: 162, Blended CAC Payback Period: 17527
CAC AND CAPITAL EFFICIENCY2019 Private SaaS Company SurveySize-Growth Scatter View of Companies 10MM in 2018 Ending ARR200% Blended CAC Ratio10.000.611.141.67 2.30Capital Consumedthrough 20182 0MM 50MM 100MM 150MM 200MM 1See definition on page 25Capital consumed defined as total primary cumulative equity raised plus debt drawn minus cash on the balance sheet (adjusted fordividends / distributions)Note: Excludes companies with negative or no organic ARR growth122 respondents228
NEW CUSTOMER CAC RATIO BY PRIMARY MODE OF DISTRIBUTION12019 Private SaaS Company SurveyExcluding Companies 5MM in 2018 Ending ARRLess than 0.25 0.81- 1.00 1.51- 2.00 0.25- 0.50 1.01- 1.30 2.01- 3.00 0.51- 0.80 1.31- 1.50Over 3.00100%75%Median 1.21Median 1.52Median 1.3950%Median 1.2025%0%OverallField SalesInside SalesMixed1Primary Mode of Distribution1See definition on page 17Respondents: Total: 181, Field Sales: 102, Inside Sales: 57, Mixed: 22. Excludes Channel Sales: 6, Internet Sales: 829
2019 Private SaaS Company SurveyOPERATIONS30
SUBSCRIPTION GROSS MARGIN2019 Private SaaS Company SurveyExcluding Companies 5MM in 2018 Ending ARR“What is Your Gross Profit Margin on Just Subscription / SaaS Revenues?”Over 90%2585-90%2580-85%3175-80%3570-75%Median 78.0%2465-70%2160-65%1355-60%450-55%1Less than 50%60510152025185 respondentsNote: Respondents asked to back out stock-based comp. expenses and include customer support expenses30354031
SAAS APPLICATION DELIVERY1 TRENDS SINCE 20142019 Private SaaS Company SurveySelf ManagedServersOther Third-PartyIaaS or PaaS2015 SurveyHybrid / MultiCloud88% of participants usethird partiespredominantly;expectations for the futureshow a continuing shift tothird-party applicationdelivery.2017 Survey2016 Survey2%Other10%4%51%2018 Survey3%6%With increasingcompetitive pressure fromGoogle Cloud andMicrosoft Azure, AWS’sshare declined from 64%last year to 58%.33%2019 Survey3 Years from Now1% 1% 1%11%3%6%8%5%64%13%12%59%7%Reported “predominant” mode of deliveryRespondents: 2014: 297; 2015: 282; 2016: 289; 2017: 384; 2018: 245; 2019: 274; 3 Years from Now: 270132
SAAS APPLICATION DELIVERY MODE AS A FUNCTION OFSIZE OF COMPANY2019 Private SaaS Company %9%15%2%4%6%4%12%9%60%30%26%5%10%5%10%10%AWS dominatesacrosscompanies ofevery scale.While SelfManaged isused by agreater share oflarger firms,Azure / Googlehave grabbedmarket share inthe mid-sizedspace.40%71%56%59%55%65%58%50% 5MM- 10MM 10MM- 15MM 15MM- 25MM 25MM- 40MM 40M- 60M 60M- 100M 100M20%0%2018 Ending ARRAnother third-party IaaS or PaaSHybrid / Multi-CloudSelf Managed ServersOtherRespondents: Total: 192, 5M- 10M: 47, 10M- 15M: 32, 15M- 25M: 41, 25M- 40M: 20, 40M- 60M: 23, 60M- 100M: 19, 100M: 1033
SUBSCRIPTION GROSS MARGIN AS A FUNCTION OFAPPLICATION DELIVERY2019 Private SaaS Company 83%80%Median89%82%85%80%79%81%78%88%Median subscriptionmargins for all the majorproviders arecomparable (around79%), while othermethods are showslightly higher varianceMedian eApp CloudMicrosoftAzureAnotherthird-partyIaaS orPaaSHybrid /Multi-CloudOtherSelfManagedServersRespondents: Total: 252, Amazon Web Services (AWS): 148, Google Cloud: 18, Salesforce: 5, Microsoft Azure: 23, Other Third-Party: 8,Hybrid / Multi-Cloud: 10, Others: 9, Self Managed Servers: 3134
PROFESSIONAL SERVICES (% OF 1ST YEAR ARR) AS AFUNCTION OF TARGET CUSTOMER12019 Private SaaS Company SurveyExcluding Companies 5MM in 2018 Ending ARR12%11%10%P.S. % of 1st Year ARR10%Median 9.2%8%6%6%5%4%2%0%EnterpriseEnterprise / Middle MarketMiddle Market / SMBSMB / VSBPrimary Target Customer1See definition on page 14Respondents: Total: 137, Enterprise: 52, Enterprise / Middle Market: 56, Middle Market / SMB: 22, SMB / VSB: 7, excludes Mixed: 4, dueto small sample size and respondents indicating no professional services35
ANALYSIS OF SALES COMMISSION LEVELS2019 Private SaaS Company SurveyFieldDominatedInsideDominatedMedian Direct Sales Commission 10.0% 10.0%Median Fully-Loaded SalesCommission 12.0% 14.0%The survey results donot point to a significantdifference in salescommission ratesbetween companieswhich predominantlyuse a field go-to marketversus inside sales.3531Number of Respondents302523201415109107654522229663220786 663112001-3%3-5%5-6%6-7%7-8%8-9% 9-10% 10-11% 11-12% 12-13% 13-15% 17-20% 20-22% 22-25% 25% Sales Commission Paid to Direct Rep (as % of first year ARR)Field SalesInside SalesNote: For the definition of Primary Mode of Distribution, please see page 17Note: Lower bound is inclusiveRespondents: Total: 208, Field Sales: 126, Inside Sales: 8236
SALES COMMISSIONS AS A FUNCTION OF MEDIAN INITIALCONTRACT SIZE2019 Private SaaS Company SurveyMedian Direct Salesand Fully-Loadedcommission rates didnot vary significantlyacross contract sizes.30%25%Median Sales %16%15%20%16%15%15%15%14%14%Median 8%8%8%10%10%75th12%10%8%10%10%10%8%12%10%Median 10.0%8%5%4%5%0% 5K 5K 5K- 15K 5K- 15K 15K- 25K 15K- 25K 25K- 50K 50K- 100K 25K- 50K 50K- 100K 100K- 250K 250K 100K- 250K 250KMedian Initial Contract SizeDirectFully-LoadedRespondents: Total: 222, 5K: 38, 5K- 15K: 37, 15K- 25K: 20, 25K- 50K: 49, 50K- 100K: 31, 100K- 250K: 27, 250K: 2037
DIRECT COMMISSIONS FOR RENEWALS, UPSELLS ANDMULTI-YEAR DEALS2019 Private SaaS Company SurveyExcluding Companies 5MM in 2018 Ending ARRCommissions on simple renewals are going downevery year– this year, almost 50% of the time notpaid at all (vs. 35% last year). Meanwhile,commissions on upsells are also trending down(53% pay full commission in this year’s results,vs. 68% last year).RenewalsMedian commission rate onrenewals1Percentage of respondentsnot paying any commissionon renewalsAdditional Commission forExtra Years on Initial ContractUpsells3%47%Median commission rate onupsells1Percentage (%) ofrespondents paying fullcommission2Percentage of Respondents Paying9%53%No additional commission27%Partial commission20%Full commission10%1Among companies paying a commissionSame rate (or higher) than new sales commissionsRespondents: Renewals: 177, Upsells: 178, Extra Years on Initial Contract: 187238
2019 Private SaaS Company SurveyCOST STRUCTURE39
COST STRUCTURE2019 Private SaaS Company SurveyExcluding Companies 5MM in 2018 GAAP RevenueGross Margins:2018 Median1Subscription Gross Margin78%Total Gross Margin273%Operating Expense Margins:Sales & Marketing43%Research & Development27%General & Administrative20%Profitability & Growth:EBITDA Margin(19%)FCF Margin(14%)YoY Organic ARR Growth Rate35%1 Allmargins based on 2018 GAAP, adjusted for stock-based compensation add-backmargin determined based on including customer support in COGSNote: Margins may differ from margins on other pages due to the fact that the 5MM size threshold is based on companies’ 2018 GAAPRevenue instead of 2018 ARR (consistent with previous years’ surveys).Respondents reporting: Subscription Gross Margin: 180, Gross Margin: 171, Sales & Marketing: 170, Research & Development: 166,General & Administrative: 168, EBITDA Margin: 173, FCF Margin: 170, YoY Organic ARR Growth Rate: 2242 Gross40
MEDIAN COST STRUCTURE BY SIZE2019 Private SaaS Company SurveyExcluding Companies 5MM in 2018 GAAP RevenueSize of Company (2018 GAAP Revenue)All Respondents 5MM – 25MM 25MM – 50MM 50MM – 100MM 100MMSubscription Gross Margin78%77%78%79%77%Total Gross Margin73%73%74%72%66%Sales & Marketing43%45%39%50%36%Research & Development27%29%27%28%17%General & Administrative20%22%18%18%11%EBITDA Margin(19%)(31%)(15%)(23%)3%FCF Margin(14%)(19%)(14%)(15%)2%35%39%40%30%21%Gross Margins:Operating Expense Margins:Profitability and Growth:YoY Organic ARR Growth RateNote: Margins may differ from margins on other pages because here companies are excluded based on their 2018 GAAP Revenueinstead of 2018 ARR, which is consistent with previous years’ surveysNote: Numbers do not add due to the fact that medians were calculated for each metric separately and independentlyAverage Number of Respondents: 5MM- 25MM: 113, 25MM- 50MM: 34, 50MM- 100MM: 21, 100MM: 1041
FOR COMPARISON: HISTORICAL RESULTS OF SELECTEDPUBLIC SAAS COMPANIES2019 Private SaaS Company SurveyPublic SaaS at Historical Revenue Run-Rates 25MM 50MM 100MMMedian ValuesGross Margins:Total Gross Margin63%66%68%Sales and Marketing47%44%46%Research and Development23%21%20%General and Administrative23%21%20%EBIT Margin(32%)(22%)(21%)Adj. EBITDA Margin(28%)(12%)(9%)FCF Margin(34%)(19%)(15%)88%48%40%Operating Expense Margins:Profitability and Growth:YoY Revenue Growth Rate11YoY Revenue Growth compares against previous year’s revenue of the companies at the timeNote: Excludes stock-based compensation (SBC)Median includes ALRM, AMBR, APPF, APPN, APTI, ATHN, AVLR, AYX, BCOV, BL, BNFT, BOX, BV, CARB, CNVO, COUP, COVS, CRM, CRWD, CSLT, CSOD,CTCT, CVT, DMAN, DOMO, DWRE, ECOM, ELLI, EOPN, ESTC, ET, EVBG, FIVN, FLTX, FSLY, HUBS, INST, JIVE, KXS, LOGM, MB, MDB, MIME, MKTG,MKTO, MRIN, MULE, N, NEWR, NOW, OKTA, OPWR, PAYC, PCTY, PD, PFPT, PLAN, QLYS, QTWO, RNG, RNOW, RP, SEND, SFSF, SHOP, SMAR, SPSC,SQI, TENB, TLEO, TWLO, TWOU, TXTR, ULTI, VEEV, VOCS, WDAY, WK, WORK, XRO, XTLY, YDLE, ZS and ZUO 25MM median excludes ALRM, AMBR, APPN, APTI, ATHN, AVLR, BL, BNFT, CBLK, COUP, COVS, CRWD, CSLT, CVT, DOMO, ECOM, ELLI, EOPN, ESTC,FIVN, FLTX, FSLY, KXS, MB, MDB, MIME, MKTG, MKTO, MULE, N, OKTA, PAYC, PCTY, PD, PFPT, PLAN, QLYS, RNG, RP, SEND, SFSF, SMAR, TENB,TWLO, ULTI, WK, WORK, WTC, XRO, YDLE, ZS and ZUO 50MM median excludes ALRM, APPN, APTI, AVLR, BNFT, BV, CBLK, DOMO, FLTX, FSLY, MDB, N, NEWR, PD, PLAN, RP, SFSF, TENB, WDAY, WORKand ZUO 100MM median excludes BOX, EOPN, NOW and VEEV42
MEASURING SURVEY PARTICIPANTS AGAINST “THE RULE OF 40%”2019 Private SaaS Company SurveyExcluding Companies 10MM in 2018 Ending ARRJust 20% (26of 132) of theparticipantswith 10MMARR meet orexceed “TheRule of 40%”.The median{Growth Profitability}for the groupis 19%.“The Rule of40%” lineNote: Some of the 132 respondents fall outside of the graphRespondents: Total: 132, {G P} 40%: 26, {G P} 40%: 10643
COMPARISON OF “THE RULE OF 40%” QUALIFIERS VS. OTHERS2019 Private SaaS Company SurveyExcluding Companies 10MM in 2018 Ending ARRRule of 40%(1){G P} 40%{G P} 40%(Medians)(Medians)RespondentsScale / Growth / Profitability:2018 Ending ARR (MM)2018 Organic ARR Growth Rate2018 FCF Margin% of Gross Bookings from New Customers26106 2366%0%56% 2530%(21%)61%Churn & CAC:Annual Gross Dollar ChurnNet Dollar Retention Rate% of Bookings from Upsells and ExpansionsBlended CAC RatioCAC Ratio for New Customers13%109%42% 0.51 0.7812%102%36% 1.26 1.51Margins:Subscription Gross MarginsSales & Marketing ExpenseResearch & Development ExpenseGeneral & Administrative Expense80%31%22%17%78%46%30%20%Business Focus / Go-To-Market:% of Companies with a Vertical Focus% of Companies with an Enterprise / Middle Market Focus% of Companies with an SMB / VSB Focus% of Companies with an Inside Sales GTM% of Companies with a Field Sales GTMMedian ACV per Customer35%54%38%23%46% 24K19%77%17%21%41% 46K 10MM0.7x 42MM1.5xCapital / Maturity:Capital ConsumedCapital Consumption RatioThe median results ofthose respondentsmeeting or exceeding“The Rule of 40%”shows that while thebest G P performersare of similar size(ARR) vs. thoseunder “Rule of 40”,they have significantlylower CAC andcapital consumptionratios. Gross churnrates are notsubstantively differentthough Net DollarRetention is better forthe strong G Pperformers.1G P equals 2018 organic ARR growth rate plus 2018 FCF marginRespondents: Total: 132, {G P} 40%: 26, {G P} 40%: 10644
FOR COMPARISON: “THE RULE OF 40%” FORPUBLIC SAAS COMPANIES2019 Private SaaS Company Survey“The Rule of40%” lineFor comparison, publicSaaS companies’ mediangrowth profitability is36%. Notably, 74% of themarket cap of public SaaSis above the 40%threshold, as of the date ofthis report.2018 GAAPRevenue 100MM 500MM 1,000MM 1,500MM 2,000MM 3,000MMEV / 2018 Revenue Multiple0.0xSource: Capital IQ; market data as of 9/30/1910.0x20.0x45
2019 Private SaaS Company SurveyCONTRACTING ANDPRICING46
MEDIAN / TYPICAL CONTRACT TERMS FOR THE GROUP2019 Private SaaS Company SurveyAverage Contract LengthAverage Billing FrequencyMedian 1 yearMedian 1 yearMultiple years inadvance2%1.5 year14%Monthly25%2 years9%1 year53%Other1%2.5 years4%1 Year57%3 years12%4 years or more3%Less than a year5%Respondents: Average Contract Length: 261, Average Billing Frequency: 272Quarterly10%Quarterly to 1year5%47
CONTRACT LENGTH AS A FUNCTION OF CONTRACT SIZE2019 Private SaaS Company SurveyMonth to monthLess than a year1 to 1.5 years2 to 3 years3 years or more100%80%60%40%20%0% 1K 1K- 5K 5K- 15K 16K- 25K 26K- 50K 51K- 100K 100K- 250K 250K- 1MMMedian Annual Contract Value (ACV)Respondents: Total: 261, 1K: 6, 1K- 5K: 43, 5K- 15K: 47, 15K- 25K: 29, 25K- 50K: 46, 50K-100K: 38, 100K- 250K: 33, 250K- 1MM: 1948
WHAT IS YOUR PRIMARY PRICING METRIC?2019 Private SaaS Company ployees8%Modules orfunctionality10%Usage ortransactions20%“Other” includes various size-based pricing metrics (shareholders, host count, brand portfolio size and other financial metrics)284 respondents49
2019 Private SaaS Company SurveyRETENTION AND CHURN50
ANNUAL GROSS DOLLAR CHURN2019 Private SaaS Company SurveyExcluding Companies 5MM in 2018 Ending ARROn a dollar basis, what percent of ARR contracted as of 12/31/17, churned during 2018?(Excluding benefits of upsells and expansions) 45%640-45%5Annual Gross Dollar 5%23Median 12.7%10-12.5%317.5-10%175-7.5%172.5-5%19 2.5%200216 respondents510152025303551
ANNUAL NON-RENEWAL RATE2019 Private SaaS Company SurveyExcluding Companies 5MM in 2018 Ending ARROn a dollar basis, what percent of ARR up for renewal during 2018 did not renew?(Excluding benefits of upsells and expansions) 40%1035-40%7Annual Non-Renewal Rate30-35%1125-30%1820-25%1715-20%3110-15%Median 13.2%355-10%360-5%250%220212 respondents51015202530354052
ANNUAL NET DOLLAR RETENTION FROM EXISTING CUSTOMERS2019 Private SaaS Company SurveyExcluding Companies 5MM in 2018 Ending ARR7 150%(upsells / expansionsgreater than churn)100% Net RetentionHow much did your existing ARR base at the end of 2017 expand or contract, adding upsellsand expansions from existing customers, subtracting gross dollar 362895%-100%(Churn greater thanupsells / expansions)Net Churn100%-105%Median 5%-70%3 60%05101520253035401Chart reflects calculated 2018 net dollar retention data200 respondents53
ANNUAL LOGO CHURN2019 Private SaaS Company SurveyExcluding Companies 5MM in 2018 Ending ARRAnnual Logo Churn: Number of Pre-existing Customers Lost During 2018 Divided by TotalNumber of Customers at Year-End 2017 40%5Annual Logo Churn Rate35-40%830-35%1525-30%1520-25%2115-20%30Median 15.0%10-15%465-10%261-5%1905191 respondents10152025303540455054
ANNUAL GROSS DOLLAR CHURN AS A FUNCTION OFCONTRACT LENGTH2019 Private SaaS Company SurveyExcluding Companies 5MM in 2018 Ending ARR20%19.2%19.1%Annual Gross Dollar Churn Rate16.0%14.5%15%Median
2019 Private SaaS Company Survey 3 37% 63% 2017 Year-End ARR 2018 Year-End ARR SUMMARY VIEW OF MEDIAN 2018 SAAS METRICS PERFORMANCE Respondents: Organic ARR Growth: 225, Sources of Gross New ARR Bookings: 214, Blended CAC: 197, 2018 In-Year Capital Consumption Ratio: 175, Cumulative Capital Consumption Ratio: 158, Gross Dollar Churn: 216 2018 Gross