Transcription
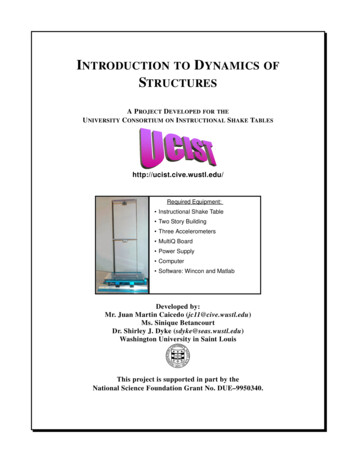
INTRODUCTION TO DYNAMICS OFSTRUCTURESA PROJECT DEVELOPED FOR THEUNIVERSITY CONSORTIUM ON INSTRUCTIONAL SHAKE TABLEShttp://ucist.cive.wustl.edu/Required Equipment: Instructional Shake Table Two Story Building Three Accelerometers MultiQ Board Power Supply Computer Software: Wincon and MatlabDeveloped by:Mr. Juan Martin Caicedo (jc11@cive.wustl.edu)Ms. Sinique BetancourtDr. Shirley J. Dyke (sdyke@seas.wustl.edu)Washington University in Saint LouisThis project is supported in part by theNational Science Foundation Grant No. DUE–9950340.
Introduction to Dynamics of StructuresStructural Control & Earthquake Engineering LaboratoryWashington University in Saint LouisObjective: The objective of this experiment is to introduce you to principles in structural dynamics through the use of an instructional shake table. Natural frequencies, mode shapes and dampingratios for a scaled structure will be obtained experimentally.1.0 IntroductionThe dynamic behavior of structures is an important topic in many fields. Aerospace engineersmust understand dynamics to simulate space vehicles and airplanes, while mechanical engineersmust understand dynamics to isolate or control the vibration of machinery. In civil engineering, anunderstanding of structural dynamics is important in the design and retrofit of structures to withstand severe dynamic loading from earthquakes, hurricanes, and strong winds, or to identify theoccurrence and location of damage within an existing structure.In this experiment, you will test a small test building of two floors to observe typical dynamicbehavior and obtain its dynamic properties. To perform the experiment you will use a bench-scaleshake table to reproduce a random excitation similar to that of an earthquake. Time records of themeasured absolute acceleration responses of the building will be acquired.2.0 Theory: Dynamics of StructuresTo understand the experiment it is necessary to understand concepts in dynamics of structures. This section will provide these concepts, including the development of the differential equation of motion and its solution for the damped and undamped case. First, the behavior of a singledegree of freedom (SDOF) structure will be discussed, and then this will be extended to a multidegree of freedom (MDOF) structure.The number of degrees of freedom is defined as the minimum number of variables that are required for a full description of the movement of a structure. For example, for the single storybuilding shown in figure 1 we assume the floor is rigid compared to the two columns. Thus, thedisplacement of the structure is going to be completely described by the displacement, x, of thefloor. Similarly, the building shown in figure 2 has two degrees of freedom because we need todescribe the movement of each floor separately in order to describe the movement of the wholestructure.Introduction to Dynamics of Structures1Washington University in St. Louis
x2p(t)mxmx1p(t)k,cmk,cyyxxFigure 1. One degree of freedom structure.Figure 2. Two degree of freedom structure.2.1 One degree of freedomWe can model the building shown in figure 1 asthe simple dynamically equivalent model shown infigure 3a. In this model, the lateral stiffness of thecolumns is modeled by the spring (k), the dampingis modeled by the shock absorber (c) and the massof the floor is modeled by the mass (m). Figure 3bshows the free body diagram of the structure. Theforces include the spring force f s ( t ) , the dampingforce f d ( t ) , the external dynamic load on the structure, p ( t ) , and the inertial force f i ( t ) . These forcesare defined as:xkmp(t)ca. mass with spring and damperfsfdfip(t)fs k x(1)b. free body diagramf d c x·(2)Figure 3. Dynamically equivalentmodel for a one floor building.f i m x··(3)where the x· is the first derivative of the displacement with respect to time (velocity) and x·· is thesecond derivative of the displacement with respect to time (acceleration).Summing the forces shown in figure 3b we obtainΣF m x·· p ( t ) – cx· – kx(4)mx·· cx· kx p ( t )(5)where the mass m and the stiffness k are greater than zero for a physical system.Introduction to Dynamics of Structures2Washington University in St. Louis
2.1.1 Undamped systemConsider the behavior of the undamped system (c 0). From differential equations we knowthat the solution of a constant coefficient ordinary differential equation is of the formx( t) eαt(6)and the acceleration is given by2 αtx·· ( t ) α e .(7)Using equations (6) and (7) in equation (5) and making p ( t ) equal to zero we obtainmα 2 e αt ke αt 0(8)e αt [ mα 2 k ] 0 .(9)Equation (9) is satisfied when–kα 2 ----m(10)kα i ---- .m(11)The solution of equation (5) for the undamped case isx ( t ) Ae ωn it Be –ωn it(12)where A and B are constants based on the initial conditions, and the natural frequency ω n is defined ask--.mωn (13)Using Euler’s formula and rewriting equation (12) yieldse iαt cos α t i sin αt(14)x ( t ) A ( cos ( ω n t ) i sin ( ω n t ) ) B ( cos ( – ω n t ) isin ( – ω n t ) )(15)x ( t ) A cos ( ω n t ) Ai sin ( ω n t ) B cos ( – ω n t ) Bisin ( – ω n t ) .(16)Using cos ( –α ) cos ( α ) and sin ( – α ) – sin ( α ) we havex ( t ) A cos ( ω n t ) Ai sin ( ω n t ) B cos ( ω n t ) – Bisin ( ω n t )or,Introduction to Dynamics of Structures3Washington University in St. Louis(17)
x ( t ) ( A B ) cos ( ω n t ) ( A – B )i sin ( ω n t ) .(18)Letting A B C and A – B D we obtainx ( t ) C ( cos ω n t ) Di ( sin ω n t )(19)where C and D are constants that are dependent on the initial conditions of x(t).From equation (19) it is clear that the response of the system is harmonic. This solution iscalled the free vibration response because it is obtained by setting the forcing function, p(t), to zero. The value of ω n describes the frequency at which the structure vibrates and is called the natural frequency. Its units are radians/sec. From equation (13) the natural frequency, ω n , isdetermined by the stiffness and mass of the structure.The vibration of the structure can also be described by the natural period, Tn . The period ofthe structure is the time that is required to complete one cycle given byT n 2π------ .ωn(20)2.1.2 Damped systemConsider the response with a nonzero damping coefficient c 0 . The homogenous solutionof the differential equation is of the formx ( t ) e αt(21)x· ( t ) αe αt(22)x·· ( t ) α 2 e αt .(23)andUsing equations (21), (22) and (23) in equation (5) and making the forcing function p ( t ) equal tozero we havee αt [ mα 2 cα k ] 0 .(24)– c c 2 – 4kmα 1, 2 -------------------------------------2m(25)Solving for α we haveDefining the critical damping coefficient asc cr 4km(26)and the damping ratio asIntroduction to Dynamics of Structures4Washington University in St. Louis
cζ -----c cr(27)α 1, 2 – ζω n iω n 1 – ζ 2 .(28)we can rewrite equation (25)Defining the damped natural frequency asωd ωn 1 – ζ 2(29)α 1, 2 – ζω n iω d .(30)equation (28) can be rewritten asThus, the solution for the differential equation of motion for a damped unforced system isx ( t ) Ae –ζω n t e – iωd t Be –ζωn t e iωd t , or(31)x ( t ) e –ζω n t ( Ae –iωd t Be iωd t )(32)Using equation (14) (Euler’s formula)x ( t ) e –ζω n t ( C cos ( ω d )t Di sin ( ω d )t )(33)where C and D are constants to be determined by the initial conditions.Civil structures typically have low damping ratios of less than 0.05 (5%). Thus, the dampednatural frequency, ω d , is typically close to the natural frequency, ω n .Comparing the solutions of the damped structure in equation (19) and the undamped structurein equation (33), we notice that the difference is in the presence of the term e –ζω n t . This term forces the response to be shaped with an exponential envelope as shown in figure 4.e –ζω n t term (exponential envelope)time2πT -----ωdTFigure 4. Response of damped structures.Introduction to Dynamics of Structures5Washington University in St. Louis
Summary: In this section you learned basic concepts for describing a single degree of freedomsystem (SDOF). In the followings section you will extend these concepts to the case of multipledegree of freedom systems.2.2 Multiple degree of freedom systemsA multiple degree of freedom structure and its equivalent dynamic model are shown in figure5. The differential equations of motion of a multiple degree of freedom system isMx·· Cx· Kx p ( t )(34)where M, C and K are matrices that describe the mass, damping and stiffness of the structure, p(t)is a vector of external forces, and x is a vector of displacements. A system with n degrees of freedom has mass, damping, and stiffness matrices of size n n, and n natural frequencies. The solution to this differential equation has 2n terms.The structure described by Eq. (34) will have n natural frequencies. Each natural frequency,ω n , has an associated mode shape vector, φ n , which describes the deformation of the structurewhen the system is vibrating at each associated natural frequency. For example, the mode shapesfor the four degree of freedom structure in figure 5 are shown in figure 6. A node is a point that remains still when the structure is vibrating at a natural frequency. The number of nodes is relatedwith the natural frequency number by\#nodes n – 1(35)where n is the frequency number associated with the mode shape.p1(t)p2(t)mmp3(t)p4(t)mmFigure 5. Multiple degree of freedom system and dynamic model.NodeMode #11st frequency(lowest)Mode #2Mode #3Mode #44th frequencyFigure 6. Diagram of mode shapes for a four degree of freedom structure.Introduction to Dynamics of Structures6Washington University in St. Louis
2.3 Frequency Domain AnalysisThe characteristics of the structural system can also be described in the frequency domain.The Fourier transform of a signal x(t) is defined byX( f) – x ( t )e– i2πftdt(36)and is related to the Fourier transform of the derivatives of this function by[ x· ( t ) ] i2πfX ( f )(37)2[ x··( t ) ] – ( 2πf ) X ( f )(38)Plugging this into the equation of motion (equation (5)) for the SDOF system, we obtain2[ – ( 2πf ) m i2πfc k ]X ( f ) P ( f )(39)and the ratio of the frequency domain representation of the output to the frequency domain representation of the input is determined( f -) [ k – ( 2πf ) 2 m i2πfc ] –1H( f) X--------.P(f)(40)Amplitude (dB)which is called the complex frequency response function, or transfer function. Note that this is afunction of the frequency, f, and provides the ratio of the structural response to the input loading ateach frequency.Figure 7 shows an example of a transfer functionfor a two degree of freedom structure. Here the magniNatural frequencies.tude of the complex function in Eq. (40) is graphed.The X axis represents frequency (in either radians persecond or Hz) and the Y axis is provided in decibels.One decibel is defined asdB 20 log ( Amplitude )(41)Peak(s) in the transfer function correspond to the natural frequencies of the structure, as shown in Figure 7.Frequency (Hz)Figure 7. Transfer function.2.4 Experimental determination of the damping in a structureA structure is characterized by its mass, stiffness and damping. The first two may be obtainedfrom the geometry and material properties of the structure. However, damping should be determined through experiments. For purposes of this experiment you will assume that the only damping present in the structure is due to viscous damping. Two commonly used methods to determinethe damping in structures are the logarithmic decrement method and the half power bandwidthmethod. The logarithmic decrement technique obtains the damping properties of a structure froma free vibration test using time domain data. The half power bandwidth method uses the transferfunction of the structure to determine the amount of damping for each mode.Introduction to Dynamics of Structures7Washington University in St. Louis
2.4.1 Exponential decayUsing free vibration data of the acceleration of the structure one may obtain the damping ratio. Figure 8 shows a free vibration record of a structure. The logarithmic decrement, δ , betweentwo peaks is defined asyδ ln ----1y2(42)where y 1 and y 2 are the amplitudes of the peaks.Amplitudey1y2timeFigure 8. Free vibration of a damped system.From the solution of the damped system (equation (33)) we can say that y 1 and y 2 can bewritten asy 1 Ce – ζωn t(43)y 2 Ce – ζωn ( t T )(44)where the constant C includes the terms of the sine and cosines in equation (33), and T is the period of the system. Using equations (43) and (44) in equation (42)yCe –ζωn tδ ln ----1- ln ----------------------------- ζω n Ty2Ce –ζωn ( t T )(45)and when the damping ratio is small, can be approximated asδ 2πζ .(46)Solving for ζyln ----1y2δ- ---------ζ ----2π2πIntroduction to Dynamics of Structures8(47)Washington University in St. Louis
Using equation (47) we can obtain the damping ratio ζ of the structure using the amplitude of thesignal at two consecutive peaks in a free vibration record of displacement or acceleration.2.4.2 Half power bandwidth methodThe second method to obtain an estimation of the damping of a structure is the half powerbandwidth method. In contrast to the previous method, the half power bandwidth method uses thetransfer function plot to obtain the damping. The method consists of determining the frequenciesat which the amplitude of the transfer function is A 2 whereAA 2 ------12(48)and A 1 is the amplitude at the peak. The frequencies f a and f b associated with the half powerpoints on either side of the peak are obtained, as shown in figure 9. Then the damping ratio ζ isobtained using the formulafb – f aζ -------------fb f a(49)The damping ratio associated with each natural frequency can be obtained using the half powerbandwidth method.AmplitudeA1AA 2 ------12fafbFrequency (Hz)Figure 9. Half Power Bandwidth method.Introduction to Dynamics of Structures9Washington University in St. Louis
3.0 Experimental Setup: Equipment3.1 Required Equipment Data acquisition system (MultiQ board and computer) Instructional shake table Standard test structure Three accelerometers (one on the shake table) Power unit for sensors and shake table Relevant cables Software: Wincon and Matlab (signal processing toolbox required) Passive control device (optional, instructions provided)3.2 Data Acquisition SystemA data acquisition system is used to obtain measurements of physical quantities using sensors. These measurements may be temperature, pressure, wind, distance, acceleration, etc. In civilengineering applications the most common types of sensors measure displacement, acceleration,force and strain. In this experiment, we are going to use acceleration sensors to obtain records ofacceleration over time for a simple model of a building.Photos of the experimental components are shown in figure 10. The data acquisition systemconsists of a computer and a MultiQ board. Accelerometers are attached to each floor of the teststructure to measure accelerations. A power supply is used to provide current to the accelerometers and to the shake table. The accelerometers are connected to the power supply. The ground accelerometer should be connected at “S1”, the first floor accelerometer should be connected at“S2”, and the second floor accelerometer should be connected at “S3”. The MultiQ board shouldbe connected to the power supply as well. To make this connection use the appropriate cable toconnect the “From MultiQ” on the power supply to the “Shaker X” on the MultiQ board. (Hint:Also, be sure that all the accelerometers are facing in the same direction as the ground accelerometer).3.3 Shake TableFigure 11 shows the bench-scale shake table used to excite the structure. This small shake table is a uniaxial shake table with a design capacity of 25 pounds. It is controlled by a computerwhich has the capability to excite the building with different types of signals including sine wave,random or step signals. With this instrument, it is also possible to reproduce an earthquake andstudy the characteristics of structures under specific earthquakes. A safety circuit is providedwhich stops the shake table in case it travels beyond the range of operation. To enable the shaketable, one must depress the deadman button. The shake table stops when the deadman button is released. For a more detailed guide on how to operate the shake table see the “Bench-Top Shake Table User’s Guide” available in the University Consortium of Instructional Shake Tables web page(http://ucist.cive.wustl.edu/)Introduction to Dynamics of Structures10Washington University in St. Louis
MultiQ BoardComputerPower supplySensor (accelerometer)Figure 10. Data acquisition system.Figure 11. Bench scale shake table.Figure 12. Deadman button.3.4 Test StructureThe test structure is a simple model of a two story building.The building’s height is 50 centimeters (19.68 inches) per floorand has a weight of 2 kilograms per floor. A small shock absorber can be attached to the structure as a passive control device andan active mass driver can be adapted to the structure as an activecontrol device.Figure 13. Test structure.Introduction to Dynamics of Structures11Washington University in St. Louis
4.0 Experimental ProcedureImportant Notes: Safe Operation of the Shake Table The “safety override” button on the power supply should ALWAYS remain inthe off position. Turn the power supply off if you turn off or reboot the computer. The deadman switch must be depressed to excite the shake table. Pressthis button and hold it before you begin each segment of the experiment(before you hit the “Start” button on the Wincon server). It may be necessary to reboot the computer if it locks up during the test.4.1 Transfer function calculation1. Check that all the connections are correct(accelerometers, shake table, MultiQ board, etc.).2. Turn on the power supply and wait to see that theright and left indicator lights blink.3. On the computer, use Windows Explorer to openUCIST directory: C:/UCIST/boot4. Double click on the file boot.exe . The left andright indicator lights on the power supply shouldstop blinking.5. Double click on the shortcut sample . This program will start matlab and a figure window with amenu will appear (see figure 14). Now you areready to begin the experiment.Figure 14. Menu.6. Calibrate and center the shake table by clicking the first button of the menu “Calibrateshake table” (see figure 14). When the Wincon server starts hit the “Start” button to perform the calibration. The program will ask you if you can download the program and youshould select “yes”.7. Click on the second button, “Obtain data”, to run a sine sweep excitation. Hit the “Start”button on the Wincon server to generate the excitation. Graphs of the acceleration responses obtained with the data acquisition system will appear. Three plots should appear, onefor the acceleration on the ground (shake table) and one for each floor of the building.8. Click the third button “Plot transfer functions”, to calculate the transfer functions. Thiswill take a few seconds. Two transfer functions will be computed, including Ground excitation to first floor Ground excitation to second floorIntroduction to Dynamics of Structures12Washington University in St. Louis
When the plots are displayed another menu will appear. This tool is provided so that you cangraphically determine the frequencies of the structure. You should identify the natural frequenciesof the structure using this tool. Be sure to hit “quit” when you have identified all of the frequencies, or you will lock up the computer.You will use the transfer function data to obtain the damping ratio using the half-power bandwidth method. Zoom in on the peaks in the transfer functions and make a printout of these plots sothat you can obtain the peaks and the half-power points from the graphs. Remember that the datain the plot is in decibels.Please answer the following questions. How many natural frequencies does the structure have? What are the values of the natural frequencies? Are these values the same in the two transfer functions? Why or why not?4.2 Determination of Mode ShapesIn Section 4.1 you found the natural frequencies of the test structure. Now you are going toidentify the mode shapes of the structure using a sine wave excitation. Use the next button of themenu, “Sine Wave Excitation Test” (see figure 14). A new window will appear with two dials.One dial allows you to change the frequency and the second allows you to change the amplitude.Make sure that the structure is at rest before starting the excitation. Please keep the amplitude lowas you are exciting the structure at resonance. Also, change the frequency of the excitation slowly.Excite the building with each of the natural frequencies obtained in Section 4.1. Turn the frequency indicator that appears on the screen until you reach the value you are looking for. The value of the frequency chosen appears above the control dial.Please do the following. Sketch each of the mode shapes of the structure. Obtain the number of nodes in each mode shape. Does this result satisfy equation (35)? Explain.4.3 Damping estimation4.3.1 Exponential decayIn this test you will excite the structure with a finite duration sinusoidal excitation to examinethe free response in each mode of the structure. The sinusoidal excitation lasts for 30 seconds, andIntroduction to Dynamics of Structures13Washington University in St. Louis
then the structure is in free vibration. Then a record of the acceleration of the two floors of thestructure will appear.The next button on the menu, “Free Vibration Test” (See figure 14), will perform this test.When you hit this button a control panel will appear and you must insert the frequency into theblue box for each test. You must then hit the “Start” button on the Wincon server to begin the excitation. Be sure that the structure is at rest before performing this test. When the test is over, aplot will appear for the free vibration portion of the response. Do this test for each mode of thestructure. Using these records obtain the damping ratio using the exponential decay method described in 2.4.1.Please do the following. What is the damping ratio obtained using this method? Compare this damping ratio with that obtained in 4.3.2.4.3.2 Half Power Bandwidth methodUse the half power bandwidth method (section 2.4.2) and transfer function obtained in section 4.1to determine the damping in the structure.Please do the following. From the transfer functions obtained in 4.1 estimate the damping using thehalf power bandwidth method described in 2.4.2. What is the damping ratioassociated with each natural frequency? Compare the damping values for each of the two modes. Discuss the advantages and disadvantages of these two methods?5.0 ReferencesCHOPRA, A. K., Dynamics of Structures, Prentice Hall, N.J., 1995HUMAR, J. L., Dynamics of Structures, Prentice Hall, N.J., 1990PAZ, M., Structural Dynamics, Chapman & Hall, New York, 1997Introduction to Dynamics of Structures14Washington University in St. Louis
that the solution of a constant coefficient ordinary differential equation is of the form (6) and the acceleration is given by .(7) Using equations (6) and (7) in equation (5) and making equal to zero we obtain (8).(9) Equation (9) is satisfied when (10).(11) The solution of equation (5) for the undamped case is (12)