Transcription
WHITE PAPER - 2019 v01WHAT’S YOUR SAASCOMPANY WORTH?This white paper is written for entrepreneurs, angelinvestors, and the management teams of SaaSbusinesses. The intent of the paper is to describethe approach used by most professional investorsand strategic buyers to value a SaaS company. Bybetter understanding the concepts and mechanicsof valuing a SaaS business, management willbe better able to articulate and maximize thevalue of their company, and also develop a moreaccurate estimate of the likely offers in a saleprocess or equity raise, resulting in a narrowerbid-ask starting spread and higher likelihood ofa successful outcome. The framework describedin this paper is designed to be adaptable to themarket environment well into the future.www.saas-capital.comwww.saas-capital.com
INTRODUCTIONLike all businesses, a SaaS company is worth what a buyer and seller agree upon, and is basedon an estimate of the current value of its future cash flows. That simple sentence includes twoessential concepts:1)The marketplace determines SaaS company valuations during a process of negotiationbetween two parties.2)A set of assumptions about the size, timing, and predictability of the future cash flowsgenerated by the business are the basis for negotiation.In the following pages, we will try to add insight into both the general valuation parameters of themarketplace and also the fundamental assumptions about future cash flows of an individual SaaSbusiness.The paper consists of seven sections:1. The Basic Valuation Formula2. Public Company Valuations3. Translating Public Valuations to Private Companies4. Company-Specific Value Drivers5. The Balance Sheet6. Other Valuation Drivers7. Sample Valuations From Our PortfolioWhat's Your SaaS Company Worth – 2019– SaaS Capital1
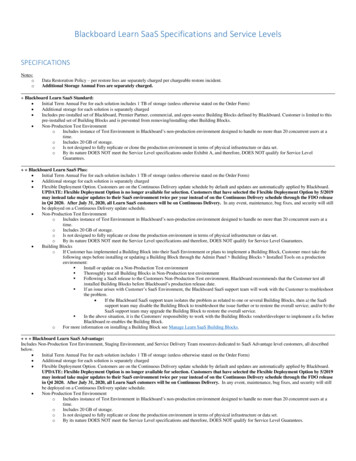
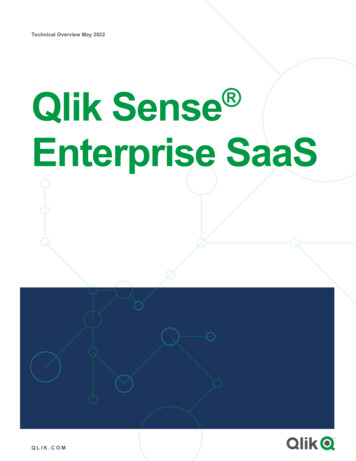
THE BASIC VALUATION FORMULAFor private SaaS businesses, the net present value of future cash flows can be reduced to ashorthand formula based on a multiple of the company’s annualized revenue.Annualized Revenue x Multiple Company ValuationAnything that affects the projected size, timing, and predictability of future cash flows impactsthe revenue multiple. Those factors include company-specific drivers such as growth rate, grossmargins, retention, etc. and external or macro factors such as economic growth expectations,fear of war, tax policy, etc.The company-specific factors drive the projected cash flows, while public company valuationmultiples reflect the implicit macroeconomic discount rate. Said differently, the current publicmarket valuation multiples incorporate all known macroeconomic uncertainty, and the companyspecific factors adjust it from there. Sometimes the baseline valuation multiple is 9.0 timesrevenue; sometimes it is 4.0 times; it just depends on when you are selling. Figure 1 depicts themedian public SaaS valuation multiples since 2008. We will further explore the public marketbaseline multiple below in the “Using Public Company Valuations” section.So why do SaaS companies trade on revenue, while allother businesses trade on EBITDA or net income, bothof which are closer approximations of cash flow?Net income takes a long time to materialize for growingSaaS businesses, even if underlying unit economics areFigure 1Median Public SaaS Company Valuation Multiplerobust. Sales and marketing expenses are recognized12.0xupfront, while revenue persists over many years. This10.0x“lag” makes new customers unprofitable in the shortterm, even though they clearly will be profitable overtheir lifetime. If a SaaS business is growing quickly,there are a lot of new (temporarily unprofitable)9.0x8.0x6.0x4.0xcustomers making net income negative. This is true2.0xfor a SaaS business than net income or EBITDA. evenue is a better indicator of long-term cash flow 2019 - SaaS CapitalJan10.0xJan09would immediately throw off cash. For this reason,Jan08even though the business could stop growing and itSource: The SaaS Capital Indexapproach to valuation will likely change as the sectormatures, but even for the largest SaaS businessestoday, there is little relationship between overallprofitability and valuation.What's Your SaaS Company Worth – 2019– SaaS Capital2
How should revenue be measured?Before moving on to the different drivers of the valuation multiple, let’s discuss the first part ofthe equation – revenue. When a buyer or investor evaluates a business, they will look closely atthe different revenue streams, and when possible, value them differently. High gross marginrecurring license fees generate more future cash-flow and are more highly valued. One-timeservices fees like implementation are valued less, with recurring services falling somewhere in themiddle. Refer to the Gross Margin & Revenue Mix section below for more detail.The generally available data on public and private valuation multiples include companies withvarying percentages of services revenue, which is not necessarily disclosed separately. We doknow, however, from our survey of over 1,000 SaaS businesses, and available public data, that theaverage mix of license fees to services revenue is 80% to 20%, respectively. So, if your businesshas a similar 80/20 revenue mix, the revenue multiple developed here applies to your entirerevenue stream, not just your license revenue or Annual Recurring Revenue (ARR). However, ifyour services mix is significantly higher, or you have hardware or other types of revenue, you willneed to calculate separate adjustments downward for individual revenue streams.It’s also important to note that when looking at most public company data, valuations are typicallyreported as a multiple of either last year’s revenue, next year’s revenue, or the trailing 12months of revenue. All of these revenue figures add unnecessary noise to determininga precise measure of current revenue, which is the company’s annualized run-raterevenue. The SaaS Capital Index, referenced throughout this paper, calculatesvaluation multiples based on run-rate revenue to make a comparison toyour business more direct. If you are using another index, it will beimportant to keep this nuance in mind and adjust accordingly.“Anything that will impactthe size, timing, andpredictability of future cashflows will be incorporatedinto the revenue multiple.”Having outlined the basic approach to valuation, let’snow take a more in-depth look at public SaaScompany valuations.What's Your SaaS Company Worth – 2019– SaaS Capital3
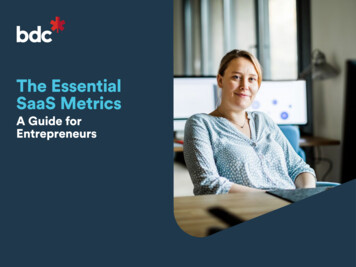
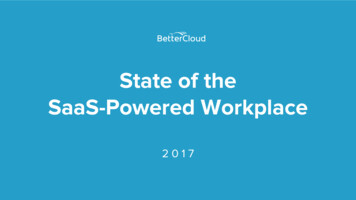
PUBLIC COMPANY VALUATIONSPublic market valuations reflect real-time information and have high data integrity becausethey include many different companies and are based on audited financial statements. Publicvaluation data is the primary starting point for valuation analysis by both buyers and sellers.There are several different public SaaS indices available, including one developed by SaaS Capital– aptly called The SaaS Capital Index. The companies in our index were selected to representpure B2B SaaS companies, and specifically excludes companies like LinkedIn (when public),PayPal, Carbonite, and Dropbox. The index also excludes legacy and conglomerate softwarevendors such as Microsoft and Oracle, who have a mix of perpetual and SaaS revenue.Because public valuation data changes constantly,any valuation analysis should begin by downloadingthe most current SaaS Capital Index datasetFigure 2SaaS Capital Index vs. S&P 500 & NASDAQavailable to download from the SaaS Capital website.Before we discuss the mechanics of using the publicvaluations, let’s pause here to understand a bit abouthow the public company valuations have behavedover time. Figure 2 compares the SaaS Capital Index700%SaaS Capital IndexS&P 500NASDAQ Composite600%500%400%to the S&P 500 and NASDAQ composite index since300%2013.200%First, it’s impossible not to notice how SaaS company0%valuations have outperformed the broader Jan17Jul-17Jan18Jul-18Jan19Jul-19100%in the last three and a half years. Broadly speaking, 2019 - SaaS Capitalsince early 2017, the valuations of SaaS businesseshave increased three times more than the broaderstock market.The increase in SaaS valuations over the broader market during this period primarily resultedfrom SaaS companies growing revenue (their key valuation metric) faster than the rest of thecompanies grew net income (their key valuation metric). Also contributing, but to a somewhatlesser extent, was the fact the average SaaS company revenue valuation multiple increased moreover this period than the price-to-earnings multiple increased for the rest of the market.The other thing that’s easy to see is the SaaS index is bumpier than the other indices indicatingits higher volatility. The higher volatility is explained by the fact that the index is comprised offewer companies, and SaaS is still an emerging space comprised of smaller market capitalizationcompanies with higher stock price volatility.What's Your SaaS Company Worth – 2019– SaaS Capital4
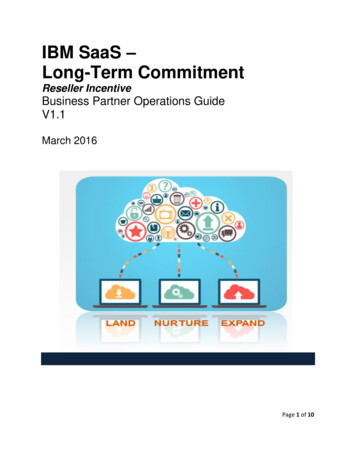
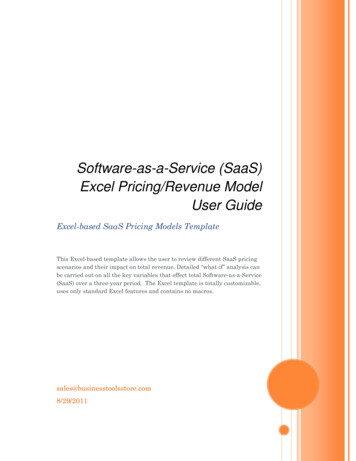
We are not public market investors, however, there have been two recent,apparent over-corrections in SaaS valuations in early 2016, and late in 2018“Awareness of historicalwhen SaaS valuations fell much more aggressively than the broader market.In each case, the underlying companies’ performance was relatively consistentpublic SaaS valuationand it was mostly the market expectations that changed. In both occurrences,trends can providecompany values rebounded and eventually out-performed the broader market.The upshot of this pattern is that if you are looking to sell your business duringmeaningful guidancea period of “correction” in SaaS values, choosing not to sell and waiting for it tofor fundraising andpass has historically been a successful strategy. It would also be fair to note thatsale decisions.”as of the writing of this report, the median public SaaS revenue multiple of 9.0 issubstantially above historical norms. The timing of an equity raise or companysale is difficult to manage, and future public SaaS valuations are difficult topredict, however, an awareness of historical public SaaS valuation trends can provide meaningfulguidance for fundraising and sale decisions. Therefore, selling a SaaS business in the macroenvironment of the fall of 2019, for example, would generally be constructive.Figure 3 shows that the median public B2B SaaS business has 562 million in revenue, is growingat 22.7% year-over-year, has gross margins of 73%, and is worth about 9.0 times run-rate revenueas of October 1, 2019. This baseline now becomes the starting point of our analysis and wewill build from here. The great thing about public market data is you can easily find it, and it’supdated constantly. The drawback of public valuation data, however, is that it does not representthe realities of the typical private SaaS company, which is much smaller.Figure 3SaaS Capital Index: Company MetricsRevised 10/1/2019Market Cap( Billions)EV/Run RateRevenueRun RateRevenue( Millions)GrowthRateGrossMargin 5.139.0x 56222.7%73% 13. 5410.1x 1,38424.6%73%Low 0.441.8x 167- 5.5%45%High 134.3527.9x 15,98885.1%90%MedianMeanSource: SaaS Capital IndexTo value your SaaS business, start by downloading the mostcurrent SaaS Capital Index dataset from our website.What's Your SaaS Company Worth – 2019– SaaS Capital5
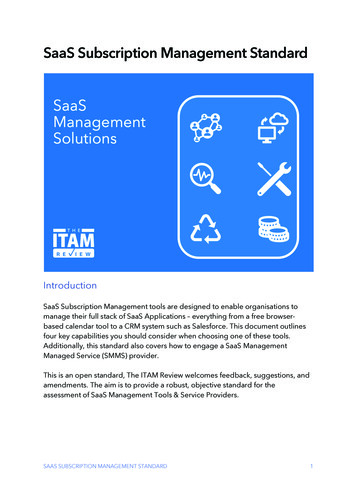
TRANSLATING PUBLIC VALUATIONS TO PRIVATE COMPANIESThe valuation drivers in private markets are the same as in the public markets, although the private companyvaluations tend to be lower because the companies are smaller (riskier) and shareholders do not have liquidity. Thatis, they can’t buy or sell their shares in the company whenever they want.Unfortunately, valuations in private transactions are rarely disclosed and valuation multiples alone, without knowingthe growth rate of the underlying businesses, are not particularly useful. Fortunately, SaaS Capital has been directlyinvolved in 30 SaaS companies that have either raised equity or sold their business over the last five years, and weknow the growth rates and valuation multiples for allthese companies.Taking the private company valuation multiples fromFigure 4Private vs. Public Multiplesour portfolio and overlaying them on the publicPrivate16.0xcompanies with similar growth rates yields the graph14.0xshown in Figure 4.The Valuation Multiple SpreadIf you look closely at Figure 4, you will notice that thedifference between the public and private revenuemultiples is about 2.0x across the spectrum of growthVALUATION MULTIPLE OF TTM REVENUEcompany multiples over the same period and acrossPublicLinear (Private)Linear (Public)12.0x10.0xrates. Please note, this chart is only intended to8.0x6.0x4.0x2.0x.0x-20%0%20%40%60%GROWTH RATE80%100%120% 2019 - SaaS Capitaldemonstrate the discount applied to private versuspublic companies and should not be used for anycurrent valuation calculations because it relies ondata some of which is five years old. The 2.0 timesFigure 5Private Company Discount Factor10.0x 2019 - SaaS Capitalrevenue discount represents a 28% discount to the9.0xaverage public valuation multiple over that period.8.0xSo, mechanically, start your valuation analysis with7.0x-28%the most current median public valuation multiple in6.0x-2.5the SaaS Capital Index, and then apply the private5.0xcompany discount of 28%.1 Therefore, as of our4.0xpublication date in October 2019, the current baseline3.0xprivate company revenue multiple is 6.5x, depicted in2.0xFigure 5.9.0x6.5x1.0x0.0xPublic Multiple Oct-19- Private Discount -Private Multiple Oct-191 While SaaS Capital will update the private company discount factor on aregular basis, 28% has shown to be a relatively stable value over time.What's Your SaaS Company Worth – 2019– SaaS Capital6
COMPANY-SPECIFIC VALUE DRIVERSHaving established both the basic formula of SaaS valuations as a function of revenue andprovided a way to calculate a baseline revenue multiple at any point based on public companyvaluations, we will now explore the company-specific factors that will cause a multiple to behigher or lower.To maximize company value, individual company characteristics need to be carefully evaluated,isolated, and considered in the overall context of the broader market. Drawing upon ourexperience selling and financing hundreds of companies and seven years of proprietary surveydata from 1,000 private SaaS companies, we have assembled the following list of value driversevery operator should consider as they prepare for an equity raise or sale of their company.Listed in order of importance, the company-specific drivers of financial valuation are:1.Growth & Scale of Revenue2.Market Size3.Revenue Retention4.Gross Margin & Revenue Mix5.Customer Acquisition Efficiency & Unit Economics6.Profitability“To maximize company value,individual company characteristicsneed to be carefully evaluated,isolated, and considered in theoverall context of thebroader market.”What's Your SaaS Company Worth – 2019– SaaS Capital7
VALUATION DRIVER #1GROWTH & SCALE OF REVENUEHow much revenue is there now? How long will it take to get bigger?How likely is it to happen?A company’s historical growth rate is the single biggest driver of the valuation multiple. It hasdwarfed all other factors for a long time. The reason high historical growth is so valuable is thatit is predictive of both the timing (sooner), and size (larger), of future profits. And because of therecurring revenue model, high historical growth rates make projected future profits more likely(lower risk).The relationship between growth and valuation multiples was shown in Figure 4 and it appliesequally to public and private businesses. The correlation between growth and valuation is notperfect, but it is solid and outweighs all other metrics.Faster-growing businesses get higher multiples, whilethe slower-growing businesses get lower multiples.Figure 6Revenue Multiples vs. GrowthGrowth rate alone, however, does not tell the full story. 2019 - SaaS CapitalIt is much easier and more common for a 5 millionbusiness to grow at 40% than it is for a 500 millionrevenue business. This relationship is simply due tomath (based on the size of the denominator) and thestandard growth curve, which slows over time for allbusinesses. (Refer to SaaS Capital Research Brief 6,The Daunting Math of Growth, for more details.)The size of the bubbles in Figure 6 indicates the relativesize of revenue for each company. You’ll see in the chartthat for a given growth rate, the larger bubbles (largerSource: The SaaS Capital Indexcompanies) generally receive a higher valuation multiplethan a smaller company growing at the same rate.Larger companies are less risky, and if they are still growing nicely at scale, by definition, theyhave a significant addressable market.Byron Deeter at Bessemer Ventures likes to tell the story that many early-stage SaaS companiespoint out to him that they are growing much faster than their public competitors and, therefore,should get a premium valuation. The more relevant comparison, however, is to compare thegrowth rates of the companies when they were both the same size. Many public SaaS businessesnow growing at 30% were growing at 200% when they were 5 million or 10 million in revenue.The basis for supporting a “growth premium” is to demonstrate that your company is growingWhat's Your SaaS Company Worth – 2019– SaaS Capital8
faster than its similarly-sized peers. To help you figure thatFigure 7Median Growth Rate by ARRout, we have included Figure 7: the median growth ratesfor SaaS businesses of different sizes based on our 201960%survey of over 1,000 private SaaS companies.50%If your business is growing faster than its peers based onmultiple. How much higher? You could look to the slope ofthe line on the public market graph for guidance, keepingin mind, however, that as companies scale, growth ratesMEDIAN GROWTH RATEthe data in Figure 7, you should be able to garner a higher40%converge, and each percentage point difference in growthis a much bigger deal and garners a larger premium forbigger companies.30%20%10%0% 1M 1 - 3 M 3-5 M 5-10 M 10-20 MARR 20 M 2019 - SaaS CapitalSource: SaaS Capital Survey 2019More pragmatically, and building off the SaaS Capitalsurvey data, if your SaaS business generates from zero to 3 million in ARR, it needs to be growing at least 50% toreceive the average private revenue multiple. Growth rates of 60% to 70% would garner multiple premiums of 1.0x to2.0x, and above 75% could push multiples up by 3.0x to 5.0x if accompanied by a verifiably large addressable market.For SaaS businesses in the 3 to 10 million range, a growth premium will become relevant above 40% revenuegrowth. SaaS businesses in this size range that are growing above 50% could easily see premiums of 1.0x to 3.0xrevenue. Growth of 60% or more with annual revenues above 20 million puts the business in more rarefied companywith growth premiums reaching 6.0x to 10.0x.For companies with more than 10 million in ARR, growth above 30% to 50% earns a premium. These largerbusinesses can achieve outsized premiums of 5.0x to 10.0x if growth rates push north of 50%.For private companies raising money from VCs, the growth imperativeaccounts not only for differences in valuation but also in the likelihood ofsuccess. Slower growing SaaS businesses are difficult to get funded at anyprice. These businesses must find a way to demonstrate some source oforganic growth that can be leveraged with additional capital. Only thenwill it be worthwhile to invest the time and energy in external fundraising.“The basis for supportinga ‘growth premium’is to demonstrateOn the M&A front, the growth imperative is almost as strong. There arethat your company isexceptions when a corporate buyer is looking for a particular need thatgrowing faster than itscan only be filled by a single company; however, typical buying scenariosgenerally revolve around growth. “I can’t even take an acquisitionsimilarly-sized peers.”opportunity to my CEO unless they are growing faster than we are,” saidan SVP in a large SaaS business growing at 29%.What's Your SaaS Company Worth – 2019– SaaS Capital9
To illustrate each company-specific value driver we haveinvented “SlowCo,” a hypothetical business. SlowCo is aFigure 8Growth Impact on Valuation: SlowCo Examplegood SaaS company with many positive attributes, but10.0xit is growing more slowly than its peers with 5 million9.0xin recurring revenue and an annual growth rate of 20%.8.0xAs Figure 8 shows, all valuations start with the mostcurrent public market multiple from the SaaS CapitalIndex, then the private market discount of 2.5x isapplied along with company-specific premiums ordiscounts. In our example, a 1.5x to 2.5x multiple 2019 - SaaS eduction is supported by the data since SlowCo’s1.0xgrowth rate is approximately half the rate of its peers.0.0xPublic MultiplePrivate Discount- Growth -ValuationVALUATION DRIVER #2MARKET SIZEHow big can your business be?Determining an addressable market size is a key valuation battleground. Your business mustbe able to clearly and credibly articulate how it will generate large profits in the future. Keepingin mind that small businesses in small markets do not ever generate large profits, the size ofyour addressable market establishes the upper bounds of your future cash flow and therefore,ultimately determines an upper limit to your valuation.For this reason, VCs and buyers dig deeply into thecompany’s market size, particularly for more matureFigure 9Market Size Impact on Valuation: SlowCo Example10.0xcompanies. They want to understand your total9.0xaddressable market (TAM). In other words, if you sold8.0xall your current products to all the potential buyers7.0xof those products, how big would your company be?6.0xInvestors will not pay a 50 million valuation for a SaaS5.0xbusiness in a 100 million market. The upside is too4.0xlimited.3.0x 2019 - SaaS Capital9.0x-2.5x-0.5x6.0x2.0xIn our experience, managers and owners do not do1.0xa good job framing the market-sizing discussion.0.0xThis omission is unfortunate because operators arePublic MultiplePrivate Discount- TAM -Valuationin a much better position to build the case for theirown business. With a bit of research, a management team can put together a well-organizedaddressable market presentation that will generally be accepted by the investor.What's Your SaaS Company Worth – 2019– SaaS Capital10
Little public data is available that connects the size of an addressable market to a revenuemultiple because TAM itself is subjective. Generally speaking, TAM enters the valuation equationas a negative factor if the market size is small.In the specific case of SlowCo, the business is entrenched in a relatively limited vertical marketwhich lowers their valuation multiple for this factor, as Figure 9 shows. However, their verticalmarket orientation will have some accretive benefits in other factors, such as retention andcustomer acquisition costs, which are discussed next.VALUATION DRIVER #3REVENUE RETENTIONHow reliable is the business you are building?Revenue retention is a significant driver of enterprise value because it touches upon all the keyfactors that impact the future cash flows of a SaaS business. High retention increases revenuegrowth rate, improves unit economics, increases profitability and even increases the size of theaddressable market. Most importantly, it improves revenue predictability, thereby reducingperceived risk. Lastly, it is also cumulative, so small changes in churn will have a significant impactover time.SaaS Capital has published numerous articles on SaaS company retention rates over the yearsand in our white paper No Churn: Keep Customers and Improve Your SaaS Company Valuation, wenumerically demonstrate how a 1% improvement in net retention will increase a SaaS company’svalue by 12% over five years. That paper was written a few years ago, and using 2019 valuationmultiples, a 1% increase in retention should now create a 15% increase in value over five years.In the context of the valuation framework, however, it is essential to isolate how retention impactsvaluation. Better retention improves a company’sFigure 10Retention by Annual Contract ValueThese two factors, however, are already incorporated105%into a company’s valuation based on its run-raterevenue and growth premiums. Additional value iscreated, however, when a company’s retention rateis above that of its peers because high-retentionbusinesses are less risky and have better uniteconomics. Buyers and investors will pay a premium forefficient businesses they perceive as predictably losingvery few customers.MEDIAN ANNUAL RETENTION PERCENTAGEgrowth rate and results in higher revenue over time.Net Revenue RetentionGross Revenue Retention100%95%90%85%80% 6,000 6k 12k 12k 25k 25k 50k 50k 100kANNUAL CONTRACT VALUE 100k 250k 250k 2019 - SaaS CapitalSource: SaaS Capital Survey 2019What's Your SaaS Company Worth – 2019– SaaS Capital11
From our 2019 survey data, the median net retentionrate (including cross-sell, up-sell, and price increases)for private SaaS businesses is 100%, see Figure 10.Above that level, a premium is justifiable. How muchof a premium is hard to determine because retentionrates are not consistently reported in public or privateFigure 11Retention Impact on Valuation: SlowCo Example10.0xvaluation data, and its impact, as we mentioned, is9.0xhighly correlated with other value drivers.8.0x 2019 - SaaS Capital9.0x0.7x7.0xAll that said, based on the 30 valuation events that6.0xwe have been a part of, we estimate the impact to be5.0xsignificant for companies that deviate meaningfully4.0xfrom 100% net retention. Less than 85% net retention3.0xwill undoubtedly lower a business’ value, and above2.0x105% will certainly increase it.1.0x0.0xIn the case of SlowCo, retention is a strength as it is-2.5x7.2xPublic MultiplePrivate Discount- NRR -Valuationfor many vertically focused SaaS companies. It’s NetRevenue Retention of 107% earns it a 0.7x multipleupgrade, shown in Figure 11.VALUATION DRIVER #4GROSS MARGIN & REVENUE MIXGiven the revenue generated by your business, how much profit can you make?Gross margin indicates the potential profitability level of the business per dollarof revenue when it reaches a more mature phase. Gross margin also determineshow much cash a company can reinvest back into sales, marketing, and productdevelopment and, therefore, indicates the capital efficiency of the business. Forthese reasons, the less direct costs required to deliver a SaaS revenue stream, themore valuable that revenue is.Our private company survey data indicates that the median gross marginis 74% corresponding to an average mix of license revenue to professional“ The less direct costsrequired to deliver a SaaSrevenue stream, the morevaluable that revenue is.”services of 80%/20%. This is also consistent with the average SaaS CapitalIndex gross margin of 73% for public companies. The costs typically includedin the gross margin calculation are: professional service costs, hosting andrelated personnel costs, customer support, customer success, and anyWhat's Your SaaS Company Worth – 2019– SaaS Capital12
other direct cost associated with delivering theproduct. For more information, read our blog postFigure 12Gross Margin Impact“What Should Be Included in COGS for my SaaS Business?”If your SaaS business is generating significantly more ofits revenue from services or has a meaningfully lowerAVERAGE SAAS CORevenue 10,000,000gross margin than a traditional SaaS company (i.e., yourRevenue Multipleproduct requires a lot of third party data or services, orCompany Valuationyou have unusually high hosting costs), your revenuevaluation multiple will be lower.It is possible to convert a revenue-based valuation to a6.5x 65,000,000Gross Margin %74%Gross Margin 7,400,000Implied Gross Margin Multiple8.8xgross margin multiple to quantify the potential impacton valuation. As discussed above, the average privateLOW MARGIN SAAS COrevenue multiple is approximately 28% less than thecurrent SaaS Index multiple of 9.0, and the averageRevenueprivate gross margin is 74% (based on SaaS CapitalGross Margin %research data.) Using those two figures, we can derivea baseline private company gross margin valuation 10,000,00060%Gross Margin 6,000,000multiple of 8.8x. Figure 12 shows how to estimate theGross Margin Multiplevaluation impact of different gross margins. This basicCompany Valuationapproach is useful regardless of what gross marginImplied Revenue Multiplepercentage is assumed to be the base case.8.8x 52,800,0005.3xAn alternative approach to account for revenue mixand gross margin variations is to assess the value ofdifferent revenue streams separately. To do this, andFigure 13Gross Margin Impact on Valuation: SlowCo Examplealso operate the business effectively, services revenue10.0xand license revenue should be isolated, along with the9.0xdirect COGS needed to support each. This approach8.0xis particularly useful for SaaS businesses that can7.0xdemonstrate significant gross margin contribution from6.0xtheir services work.5.0x 2019- SaaSCapital 2019- SaaSCapital9.0x0.5x-2.5x4.0xSlowCo has an efficient software application and3.0xsupport organization driving an 80% overall gross2.0xmargin, which justifies a 0.5x multiple premium, as1.0xFigure 13 shows.0.0xWhat's Your SaaS Company Worth – 2019– SaaS Capital7.0xPublic MultiplePrivate Discount- GM -Valuation13
VALUATION DRIVER #5CUSTOMER ACQUISITIONEFFICIENCY & UNIT ECONOMICSIf I put a dollar in my SaaS money-making-machine, how much will I get out?Both investors and strategic buyers are typically looking to continue growing a SaaS business by deploying morecapital for sales and marketing. How efficiently the business converts that spending in
to the S&P 500 and NASDAQ composite index since 2013. First, it's impossible not to notice how SaaS company . valuations have outperformed the broader market in the last three and a half years. Broadly speaking, since early 2017, the valuations of SaaS businesses have increased three times more than the broader stock market.