Transcription
S-PLUS Comprehensive Feature ListSTATISTICAL & NUMERICALTECHNIQUESBasic Statistics Summary statistics Crosstabulations Correlation and covariance Probabilities, quantiles, anddensities Random number generation frommany distributions Durbin-Watson statisticHypothesis Tests and ConfidenceIntervals One-sample t-test and Wilcoxon Two-sample t-test and Wilcoxon Paired t Correlation: Pearson, Kendall's tau,Spearman's rho Goodness-of-Fit: Chi-square,Kolmogorov-Smirnov, Shapiro-Wilk Proportions: exact Binomial test,Normal approximation Contingency tables and tests forindependence: Chi-square, Fisher,Mantel-Haenszel, McNemarRegression Basic linear regression Polynomial regression Model diagnostics Prediction and confidence intervals Stepwise selection of models Parametric spline models Least trimmed squaresregression Constrained regression Logistic regression Generalized linear models Minimum absolute residualregression Robust MM regressionAnalysis of Variance Flexible specification of variables,interactions, nesting,transformations Automatic generation of dummyvariables Choice of contrasts Type III sums of squares Rank tests: Kruskal-Wallis,Friedman Designed experiments: one-way,two-way, factorial, split-plot,unbalanced Variance component estimation Multivariate ANOVA Multiple comparisons: Fisher,Tukey, Dunnett, Sidak, Bonferroni,Scheffé, simulation-basedNonlinear Regression andMaximum Likelihood Nonlinear regression Nonlinear maximum likelihood Quasi-likelihood Constrained nonlinear regressionNonparametric Regression Generalized additive models(GAMs) Local regression (loess) Projection Pursuit, ACE, and AVAS Tree models Classification trees Regression trees Prediction from trees Pruning, shrinking, and splittingSmoothing Loess smoother Super smoother Kernel smoothers Spline smoothers Linear and spline interpolationLinear and Nonlinear MixedEffects Models Longitudinal data analysis Repeated measures models Advanced graphics for repeatedmeasures data Flexible covariance matrixstructures Built-in nonlinear mixed-effectmodels for biostatistics (biexponential, first-order compartment, fourparameter logistic) Virtually any user-defined modelcan be easily createdResampling Bootstrap JackknifeMultivariate Analysis Canonical correlation Discriminant analysis Factor analysis Multidimensional scaling Principal components BiplotsCluster Analysis K-means Hierarchical clustering Monothetic clustering Model-based clustering Crisp and fuzzy clustering Divisive and agglomerativemethodsQuality Control Shewhart chart Cusum chart Charts based on xbar, s, np, p, c, uPower and Sample Size Normal mean Binomial proportionSurvival Analysis Kaplan-Meier curves Cox proportional hazardsmodels Left, right, and intervalcensoring Time-dependent covariates andstrataMultiple event modelsCompeting risk modelsFrailty modelsParametric survivalExpected survivalPerson years analysisTime Series Analysis Autocovariance, autocorrelationand partial autocorrelation Smoothed periodograms Box-Jenkins ARIMA models Classical and robust AR "Long memory" models Seasonal decompositions Fourier transformations Classical and robust smoothers andfiltersDate, Time, and Calendar Data Univariate and multivariate timeseries Subscripting and operators Aggregation, alignment, merging,and interpolation Times and dates from millisecondsto several millenia Time zones with daylight savingsrules world-wide Holidays and market closures Flexible time and date format Publication-quality graphics withspecialized time series chart types Relative time, time sequence, andevent objectsMathematical Computations Vector and matrix computations Matrix decompositions Systems of linear equations Locate roots Nonlinear optimization Constrained optimization Ordinary differential equations Numerical integrationRobust Methods New dialog design; check box forrobust analysis in ordinary methods New plots for outlier detection andcomparing fits New multiple model fits and comparisons paradigmMissing Data Library Multiple imputation Gaussian, logistic, and conditionalGaussian modelsLarge Data Set Support Memory mapping Reference counting Control over copies in externalcalls to C Variable selection on import(keep/drop) Support for sequential processingGRAPHICS & VISUALIZATIONPlot Type Highlights 2-D plots: barplots, pareto plots,probability plots, boxplots, densityplots, dot charts, histograms, piecharts, quantile-quantile plots,scatter plots, strip plots, and more Scatterplot extensions: scatterplotmatrices, linear fits, smooth fits,vary symbol color and size, text aspoints 3-D plots: point clouds, surfaceplots, contour plots, color imageplots Time series plots: high-low-openclose, candlestick, stacked bar Quality control charts Hexagonal binning for spatial data Statistical model summaries anddiagnosticsAdvanced Data Visualization Exclusive Trellis graphics for conditioning data on additional variablesin multiple views Trellis banking for optimal aspectratios Multiple simultaneous 3-D rotationviews 2-D projections in 3-D space Multiple graphs per page withauto-formatting Brush and spin dynamic visualization Interactive observation identification on Trellis plots Multiple, user-defined color maps GraphletsCustomizability and Editing Flexible page layout Overlay graphs or display side byside Variety of lines and symbols Control over line style, marker type,colors, labels, tick marks, text, fillpattern Multiple, independently scaled xand y axes Multiple-line text annotationImport and Export Import SAS, SPSS, Excel, Matlab,and other file formats Query Oracle, Sybase, Informix,and ODBC databases Export graphics as PDF, postscript,or HPGL Variable length argument listsSpecial representation ofcategoricals, missing values, andinfinite quantitiesValidation suite of test cases toconfirm accuracy of S-PLUS outputInteractive browser for debuggingInterconnectivity Call C, C , and Fortran Language support for pipes, sockets, and files Use as front-end for commerciallibraries (NAG, IMSL, ) Spawn subprocesses Access to operating system editors Call S-PLUS from JAVA/Call Javaapps from S-PLUS (Unix) Call S-PLUS from C programs/Call C programs fromS-PLUS (Windows)MS Office Integration (Windows) Edit Excel files directly inS-PLUS Embed S-PLUS graphics in Wordand edit them in place Create PowerPoint slides fromS-PLUS graphics automatically Use Excel and SPSS wizards tocreate S-PLUS graphs from withinExcel or SPSSUser Contributed Code Libraries associated with the bookModern Applied Statistics withS-PLUS by Venables and Ripley Hmisc and design libraries for biostatistical and epidemiologic modeling by HarrellHelp and Documentation Extensive documentation Command line recall and editing Telephone and e-mail helpline Self-documenting objects60-DAY MONEY-BACKGUARANTEECall now to discuss your businessneeds.PROGRAMMING &EXTENSIBILITYObject-Oriented Language Uses the object-oriented Sprogramming language Over 4200 built-in functions Users may modify functions andwrite new functions Rich data structures includevectors, matrices, arrays, and lists1700 Westlake Avenue North Suite 500Seattle, WA 98109Tel: 206.283.8802 800.569.0123Fax: 206.283.6310email: info@insightful.comwww.insightful.comInternational DivisionKnightway House, Park StreetBagshot, Surrey GU19 5AQ, UKTel: 44 1276 450111Fax: 44 1276 451224email: info@uk.insightful.comwww.insightful.comPart No. MS0001-General. 2001 Insightful Corporation. All rights reserved. Printed in the United States of America. This data sheet is for informational purposes only. INSIGHTFUL MAKES NO WARRANTIES, EXPRESS OR IMPLIED,IN THIS SUMMARY. S-PLUS and StatServer are registered trademarks of Insightful Corporation. All product names mentioned herein may be trademarks or registered trademarks of their respective companies.
Make Better Decisions Faster Statistics Data Mining Predictive Analysis Business Intelligencewww.insightful.com
Discover Why S-PLUS is the PremierFor more than ten years, InsightfulCorporation has been a leading supplier ofdata analysis solutions that drive better decisions faster by revealing patterns, trends,and relationships.Critical business decisions depend on preciseanalysis of data. Industry-leadingprofessionals from Fortune 1000 companiessuch as AT&T, Merrill Lynch, MerckPharmaceutical and The Pillsbury Companyrely on S-PLUS because it offers a flexible,interactive environment for analyzing,visualizing and presenting data.S-PLUS, our flagship product, is one of themost powerful data analysis packages on themarket. With S-PLUS you can streamlineyour data analysis process from accessingyour data to sharing your results withcolleagues or other decision-makers. Fromunderstanding your customers toensuring product quality, S-PLUSgives you the tools to make betterdecisions today.Award-winning S Language.S-PLUS 6 is based on S version 4, an awardwinning, object-oriented language developedat Lucent Technologies’ Bell Labs specificallyfor data visualization, exploration and programming with data. The S System has beenrecognized with the prestigious Associationfor Computing Machinery Software SystemsAward, (other recipients include UNIX,TCP/IP and Mosaic). With more than 4,200statistical, graphical and programmingfunctions built in, you can create applications in S in a fraction of the time it wouldtake using lower-level languages like C orVisual Basic. The S language is platformindependent, so your applications will runon either Windows or Unix.www.insightful.comAccessAccessing your data easily and effectively is essential in your analysis. S-PLUS hasa smooth, intuitive user interface and comprehensive import/export capabilities,enabling instant access to your data wherever it is, whatever format it's in. Data insight at your fingertips.S-PLUS's intuitive graphical user interface offers the look-and-feel of Microsoft Office,applications making it easy for you to access and analyze data. Embed graphs into Word orPowerPoint presentations with point-and-click ease and share your results with key decision-makers. Microsoft Excel integration improves data import and transfer capabilities.You can open Excel worksheets within S-PLUS, perform analyses and create graphics directly fromyour data. Since your data stays in Excel, you won’t spend time transferring results back and forthbetween Excel and S-PLUS. Easily import and export data from Oracle, SAS, SPSS and other standard formats.S-PLUS makes it easy to access data from virtually any source including Excel, SAS, SPSS and databases including Oracle, Sybase and SQL Server. S-PLUS offers extensive import and exportcapabilities to help you move data from one file format to another.Easily import and export data from the following formats SAS SPSS Excel Text (ASCII) Quattro Pro Paradox Lotus 1-2-3 dBase Sigma Plot Systat STATA Gauss Access MATLAB LIM Bloomberg FAME Minitab FoxPro Epi Info Informix Oracle Sybase SQL Server ODBCExport graphics in the following fomats Windows Bitmap (.BMP) Encapsulated PostScript (.EPS) CompuServe (.GIF) GEM Bitmap (.IMG) JPEG (.JEG) Adobe Photoshop (.PSD) Adobe PDF (.PDF) HP Printer Control Language (.PCL) PaintBrush (.PCX) Tagged Image Format (.TIF) True Vision Targa (.TGA) Windows Metafile (.WMF) Portable Network Graphics (.PNG)“The S System has forever alteref the way peopleanalyze, visualize and manipulate data”Association for Computing Machinery (ACM)
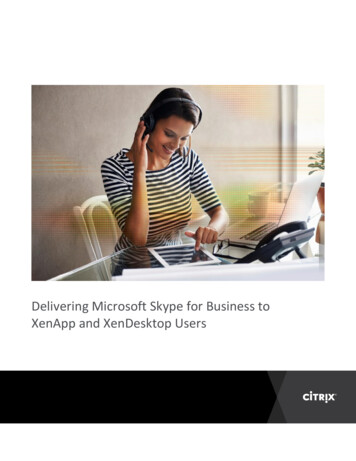
Solution for Data AnalysisVisualizePowerful graphics play a critical role in discovering key features of your data andcommunicating the results of your analysis. As you dig deeper into your data, hiddentrends and relationships can get lost in summary statistics and text output. WithS-PLUS's exploratory graphing techniques, you can visualize and reveal patterns inyour data and make discoveries you never thought possible. Share your discoveries usinginteractive graphics.S-PLUS graphics are object-oriented soyou can customize every level of detailto create the perfect graphic for yourpresentation. S-PLUS lets you interactwith your data and identify unusualvalues or select relevant subsets. AndS-PLUS's new Graphlets technologyallows you to publish your graphics onthe Web and give your readers theopportunity to interact with your datain real time.S-PLUS Graphlets offer real-timeWeb-based interactive graphics.Inroducing a new graphics format thatallows you to add interactivity directlyinto graphics published on the Web.S-PLUS Graphlets offer the flexibility ofthe S-PLUS graphics engine to create exactly the graph you want, and then make itdynamic by allowing the viewer to drilldown into your data or create hyperlinksfrom your data points to other information or graphics located elsewhere on theWeb. Examples of S-PLUS Graphlets can befound at www.insightful.com/graphlets. Visualize multi-dimensionaldata using Trellis graphics.S-PLUS is the only data analysis package to offer Trellis graphics, a revolutionary way to visualize relationships in multi-dimensional data. Developed by researchers at Bell Labs, Trellis graphics help youdiscover hidden relationships in your data by computing graphical views sliced on one or more conditioning variables. No other graphing technique has as much power and flexibility. Select from more publication-quality graphics and formats.S-PLUS offers an extensive selection of 2D and 3D graph types. From histograms to bar charts toscatterplots, the graphics library in S-PLUS is truly comprehensive. Easily customize your graphsincluding line weights, colors and fonts for publication-quality graphics.NEW! S-PLUS GraphletsNow you can create interactive graphicswhere viewers can drill-down into the graphicto view information or linked Web pages.“We selected S-PLUS software after an extensive review of competitive productsbecause it was the best decision support tool available. S-PLUS provided uswith a powerful data analysis tool for sophisticated and precise analysis of manufacturing data to reduce our production risks, improve chip yields and enhanceprofitability.”Andy BlackIntersil Corporation“The S-PLUS graphics are truly impressive. I racked my brains to come up with adisplay or permutation they had missed and I failed.”Wall Street and Technologywww.insightful.com
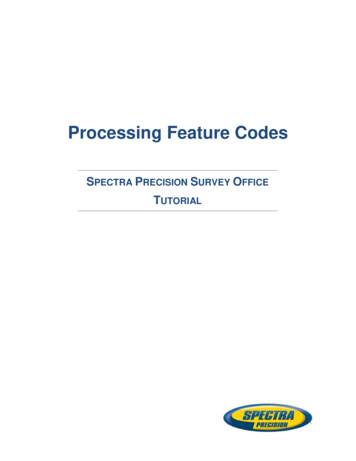
Visualize Your Data With S-PLUSNEW! Excel Link. Now you can open Excelworksheets from within S-PLUS. Performanalyses and create publication-quality graphics easily.On Unix and Linux platforms, you can now access the powerfulstatistical and graphing techniques of S-PLUS through a graphicaluser interface. Easily import and export your data, run statisticalanalyses, and create revealing graphs, all through convenientmenus and dialogs like those available on Windows. For programming, an interactive commands window gives you access to all thepower and flexibility of the S language.Change the Details of Your Graph WithEase Point-and-click control over every detailof your graphs makes it easy to produce stunning, publication-quality output. Change lineweights, axes, colors, labels, fonts, symboltypes and more with ease.www.insightful.com
“Our bank needed a powerful data analysis software package for managing risk. We selected S-PLUS for Windows for its powerful statisticalcapabilities and interactive graphics. S-PLUS has led to importantinsights that would not have been made using other, less flexible creditrisk software packages.”Eileen LeeRoyal BankCompletely Customize the User InterfaceChange toolbars, menus and dialogs to suityour working style. Add and delete optionswith ease.Produce Publication-Quality OutputAnalyze, visualize and present your data usingover 80 2D and 3D graph types.Automate Repetitive Tasks With Powerful Scripting CapabilitiesAll S-PLUS operations are recorded in scripts which can be saved and executed to automate repetitive tasks. Drag-and-drop objects into a scriptwindow to instantly generate S-PLUS interface commands, and create yourown buttons by dragging your scripts onto the toolbar. Share your workwith your colleagues by giving them your toolbar and script files.www.insightful.com
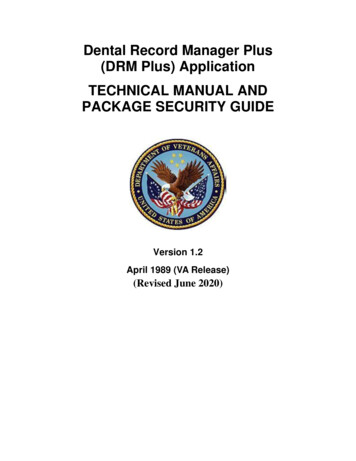
AnalyzeS-PLUS offers you powerful analytics and cutting-edge methods for statistics, data mining and predictive analytics so you cangain insight from your data. Better insight leads to more informed decision-making, a critical strategic advantage in today’scompetitive climate. Perform analysis using the most comprehensiveS-PLUS starts where yourspreadsheet leaves off.Spreadsheets are great for entering andorganizing data, but if you're also tryingto analyze your data with a spreadsheetyou're potentially missing valuableinsights by limiting yourself toinadequate methods. With S-PLUS 6 youget the best of both worlds just openyour Excel worksheet from within S-PLUS,select a region of data you wish to analyze, and instantly gain access to all ofS-PLUS's advanced statistical andgraphical functionality applied to yourExcel data.“.none has approached S-PLUS interms of accuracy.”DM Reviewsolution available today.S-PLUS offers over 4,200 built-in data analysis functionsincluding modern and classical techniques.Convenient menus, toolbars and dialogs let you access andanalyze your data easily. Choose from the most comprehensive set of modern and robust methodsavailable.Tap into the power of linear and nonlinear regression, generalized linear models, generalized additivemodels, tree models, smoothing splines, survival analysis, time series, cluster analysis, robustmethods, analysis of data with missing values, multiple comparisons and much, much more. The S language gives you controlover your data.Precise, in-depth analysis may require extensive data manipulation and cleansing. Withthe S anguage at the core of S-PLUS you caneasily prepare your data for analysis andgraphing. From data transformations to datacleansing and validating data integrity, the Slanguage provides the tools to get the job doneefficiently, leaving you with a script file oftransformations made to validate your actions. Select the model that can provide you with the best results easily.With the object-oriented S-PLUS environment, all functions, data and fitted models are handled asobjects. This allows you to fit alternative models using both classical and modern methods so you canbe confident the model you have selected will deliver the best results. Create or extend analysis methods to meet your specific needs.S-PLUS offers a powerful programming language allowing you to create or extend analyses. As youranalyses become more complex, S-PLUS can be extended to meet the challenge. Tap into the power,flexibility and extensibility of S-PLUS to take your analyses to the next level. Cutting-edge methods available as Web downloads.S-PLUS is the environment of choice for researchers world-wide developing advanced statisticalmethods for new problems in the world of data analysis. New S-PLUS functions and programsare available for download from third-party websites or from our own S-PLUS Community forum.www.insightful.com
Present & DeployThe data analysis process doesn't end when the results are returned and the graphics created. Whether you are presenting to company executives, preparing a research paper or sharing your discoveries with colleagues, you'll want your work to lookprofessional and be accessible to your audience. Create Powerpoint presentation slides with a click of a mouse.S-PLUS graphics can be embedded in standard Microsoft Office products from PowerPoint slides toWord documents. Translate your results into professional-looking reports using S-PLUS's uniquegraphic capabilities. Total control over your results.With S-PLUS you're not limited to pre-defined templates for your results. The S language gives you thefreedom to present your results in any way you need: graphically, as free-form text, or as Web-readyHTML tables. Export your graphs into versatile formats for Webor print presentations.Export publication-quality S-PLUS graphs to popular graphicalformats including PostScript, GIF, PDF, and Windows MetaFile.Create interactive graphics on your web pages using Java-basedS-PLUS Graphlets .S-PLUS: Power where you need itS-PLUS has a completely open interface, allowing it to be integrated into virtually any system.Regular analyses can be automated usingS-PLUS's batch processing system, employingthe flexibility of the S command language. OnUnix systems, S-PLUS's CONNECT/JavaInterface allows S-PLUS to be integrated withany Java application. On Windows, the CONNECT/C Interface allows you to accessS-PLUS's complete range of analytic methodsfrom C applications you develop. AndS-PLUS's DDE and OLE Automation interfacesallow you to integrate S-PLUS with otherWindows applications, allowing you to accessS-PLUS functionality within Excel or fromVisual Basic applications.Business Benefit Leverage Statistical Expertise Deploy Analyses Quickly and Easily“By launching a Web browser, employeescan crunch data that analysts at headquarters once had to do”Business Week Access Analyses Through the WebDistribute Analytics Enterprise-wideToday's decision-makers need access to real-time analysis of business data to anticipate risk,predict customer behavior and capitalize on emerging market opportunities. Insightful'sclient/server products can provide decision makers with up-to-the-minute results on their desktop, based on analytic or graphical methods using S-PLUS. With a custom-created applicationdesigned expressly for the problem at hand, decision makers gain insight from their data sooner, allowing them to make actionable decisions and providing them with a strategic advantageover the competition. www.insightful.com/enterprise.www.insightful.com
2-D plots: barplots, pareto plots, probability plots, boxplots, density plots, dot charts, histograms, pie charts, quantile-quantile plots, scatter plots, strip plots, and more Scatterplot extensions: scatterplot matrices, linear fits, smooth fits, vary symbol color and size, text as points 3-D plots: point clouds, surface