Transcription
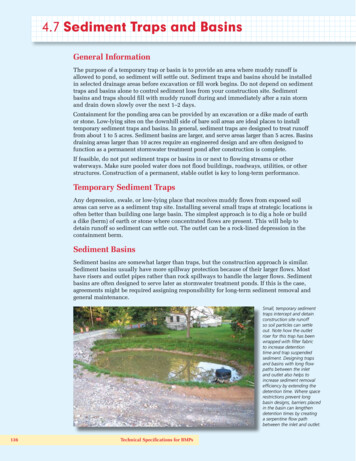
soil layer 1Numerical Simulation of Sediment Loads and ChannelChanges along the Kalamazoo River between Plainwell andOtsego, Michiganslice iWiassumed groundwater surfacesoil layer 2actual groundwater surfaceSisoil layer 3Nifailure surface andbank profile after failureβlateral erosion andbank profile after erosion1Robert R. Wells1, Eddy J. Langendoen2 and Andrew Simon2Department of Geological Engineering, University of Mississippi, Oxford, MS2USDA-ARS, National Sedimentation Laboratory, Oxford, MSResearch Report No. 44December 2003
EXECUTIVE SUMMARYConcerns over the fate of PCB-laden channel sediments in the Kalamazoo Riverbetween Plainwell and Otsego, Michigan resulted in the U.S. Geological Survey (USGS)supporting a study by the USDA-ARS National Sedimentation Laboratory to simulatesediment loads and channel changes in the reach. The 8.8 km reach of the KalamazooRiver contains two low-head dams. The state of Michigan is interested in removing thesedams while minimizing impacts to the study reach and downstream reaches, and toprovide for improved fisheries. This study was designed to evaluate the erosion,transport, and deposition of sediments in the Kalamazoo River between Plainwell andOtsego, Michigan. Numerical modeling of channel-erosion processes over a 17.7-yearperiod was conducted using CONCEPTS for three specific scenarios, Dams In orbaseline, Dams Out, and Design. The USGS conducted channel surveys, collected andanalyzed bed-sediment cores, and performed particle-size analysis for all channelmaterial samples collected by the USDA-ARS. USDA-ARS conducted in-situmeasurements on the erodability of channel materials. Flows for all three scenarios arebased on a modified discharge record from the USGS gage on the Kalamazoo River atComstock, Michigan (04106000).The total change in the mass of sediment emanating from the channel boundary(17.7 year simulation), for the Dams In (baseline) case, shows net erosion of 3670 T/y forthe study reach. The Plainwell reach contributed 9660 T/y (erosion), the PlainwellOtsego reach was a net sink of 8480 T/y (deposition), and the Otsego reach contributed2490 T/y (erosion). Passing the downstream boundary there is net transport of 5010 T/y(suspended and bed load). For the Dams Out case (17.7 year simulation), net erosionjumps to 41,600 T/y for the entire study reach with net transport (suspended and bedload) of 59,200 T/y passing the downstream boundary. This is primarily due to channelincision and headward migration of knickpoints, particularly in the Plainwell reach whereerosion of about 29,600 T/y was simulated. The Plainwell-Otsego reach contributed27,700 T/y (erosion). The Otsego reach became a sink for sediment (15,600 T/y) due torelatively flat channel gradients and the greatly heightened loads emanating from theeroding reaches upstream. The total mass of sediment derived from the channelboundary for the Design case (17.7 year simulation)showed net erosion of 3870 T/y. ThePlainwell reach contributed 24,800 T/y (erosion), the Plainwell-Otsego reach contributed4790 T/y (deposition), and the Otsego reach was again a sink for sediment eroded fromupstream (16,100 T/y). Sediment loads passing (suspended and bed load) the downstreamboundary were about one-third of the Dams Out case (20,100 T/y) but still 4 times greaterthan the Dams In baseline case.Fine-grained erosion (sediment particle diameters 65µm, clay and silt, and 10µm, clay and very fine silt) shows a similar pattern as total erosion in comparing thedifferent modeling scenarios(17.7 year simulation): Dams In case, contributing 3570( 65µm) and 993 ( 10µm) T/y; Dams Out case, contributing 5790 and 2220 T/y,respectively; and Design case, contributing 5100 and 1500 T/y, respectively. For theDams In case, the banks contributed 42% of the total in the 65µm class and 99% of thetotal in the 10µm class. For the Dams Out case, the banks contributed 56% of the total inii
the 65µm class and 98% of the total in the 10µm class. For the Design case, the bankscontributed 40% of the total in the 65µm class and 95% of the total in the 10µm class.The most significant findings of this research are that: Removal of the low-head dams will cause erosion in the study reach andsediment loads passing the downstream boundary to increase significantly, Bed erosion is the major source of eroded sediment, and The Plainwell reach is the greatest contributor of total sediment and finegrained sediment.iii
Table of Contents1.0INTRODUCTION and PURPOSE of STUDY. 11.1Modeling Scenarios . 11.1.1Modeling Reach . 21.1.2Flows Entering the Modeling Reach. 21.1.3Cross-Section Schematization . 52.0PHYSICAL PROPERTIES of the CHANNEL BOUNDARY . 62.1Borehole Shear Testing and Bulk Unit Weights. 62.2Submerged Hydraulic Jet Testing: Erodibility of Fine-Grained Materials. 82.3Bank-Toe Erodibility . 112.4Texture of Bed Materials . 122.5Hydraulic Roughness . 122.6CONCEPTS Values Used. 123.0RESULTS of CONCEPTS MODELING . 163.1Evaluation of POC Reach . 163.2Interpretation of Bank-Erosion Results along Upper Half of POC Reach . 173.3Dams In (DI) - Baseline. 173.4Dams Out (DO). 213.5Design Channel (D) . 253.6Comparison of the Three Modeling Scenarios: General. 293.7Comparison of the Three Modeling Scenarios: By Sub-Reach . 304.0SUMMARY and CONCLUSIONS . 375.0ACKNOWLEDGMENTS . 386.0REFERENCES. 39iv
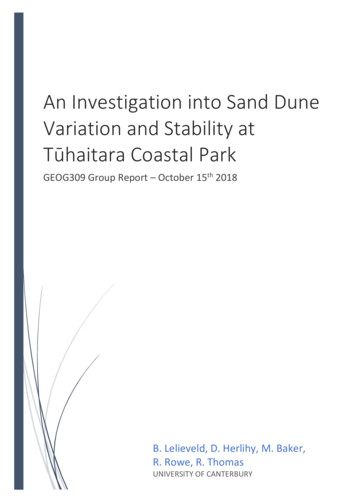
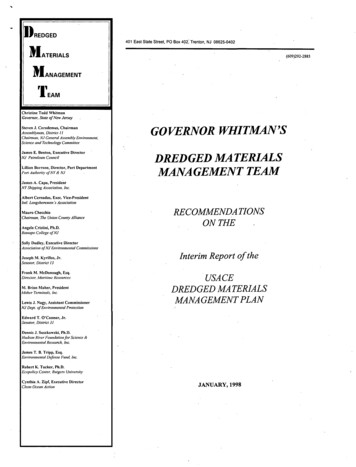
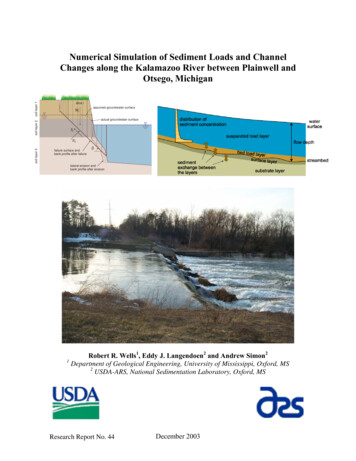
List of FiguresFigure 1 – Map of study reach showing modeled cross sections and locations of thePlainwell and Otsego City Dams. . 4Figure 2 – Mean-daily discharge at Kalamazoo River at Comstock (04106000) showingmean for period of record and for modeling period. 5Figure 3 - Schematic representation of borehole shear tester (BST) used to determinecohesive and frictional strengths of in situ streambank materials. Modified fromThorne et al., 1981. . 7Figure 4 - Schematic of submerged jet-test device used to measure the erodibilitycoefficient (k), and the critical shear stress (τc), of fine-grained materials. . 9Figure 5 - General relation between the erodibility coefficient k, and critical shear stressτc for fine-grained materials based on jet tests from across the United States(Hanson and Simon, 2001). . 10Figure 6 – Relation between erodibility coefficient (k) and critical shear stress (τc) forfine-grained materials based on jet tests from the Kalamazoo River. . 10Figure 7 – Initial and final thalweg profiles for the Dams In (DI) baseline modelingscenario. . 18Figure 8 – Sediment load at the downstream boundary of the study reach (OC8) for theDams In (DI) baseline modeling scenario. . 18Figure 9 – Map of the study reach showing bed, bank, and total erosion/deposition for theDI scenario from data in Table 5. . 20Figure 10 – Initial and final thalweg profiles for the Dams Out (DO) modeling scenario. 21Figure 11 – Sediment load at the downstream boundary of the study reach (OC8) for theDams Out (DO) modeling scenario. . 22Figure 12 – Map of the study reach showing bed, bank, and total erosion/deposition forthe DO scenario from data in Table 6. 24Figure 13 – Initial and final thalweg profiles for the Design Channel (D) modelingscenario shown in relation to the current configuration. 25Figure 14 – Sediment load at the downstream boundary of the study reach (OC8) for theDesign channel (D) modeling scenario. 26Figure 15 – Map of the study reach showing bed, bank, and total erosion/deposition forthe D scenario from data in Table 7. 28Figure 16 – Sediment loads broken out by size class at the downstream boundary (OC8)for the three modeling scenarios. . 29Figure 17 - Final thalweg profiles for the three modeling scenarios. . 30Figure 19 – Contributions from the channel boundary for the three modeling scenarios,by size class in the Plainwell reach. 31Figure 20 - Contributions from the channel banks for the three modeling scenarios, bysize class in the Plainwell reach. 32Figure 21 – Contributions from the channel boundary for the three modeling scenarios,by size class in the Plainwell to Otsego (POC) reach. 33Figure 22 - Contributions from the channel banks for the three modeling scenarios, bysize class in the Plainwell to Otsego (POC) reach. 34v
Figure 23 – Contributions from the channel boundary for the three modeling scenarios,by size class in the Otsego (OC) reach. . 35Figure 24 – Contributions from the channel banks for the three modeling scenarios, bysize class in the Otsego (OC) reach. . 36vi
List of TablesTable 1. Borehole shear tests (BST) conducted at sites along the Kalamazoo River. 7Table 2. Submerged jet-test values obtained for the Kalamazoo River. 11Table 3. Bank material and physical properties data used in the CONCEPTS simulations. 13Table 4. Bed material properties used in the CONCEPTS simulations. 15Table 5. Dams In (DI) baseline modeling results. . 19Table 6. Dams Out (DO) modeling results. . 23Table 7. Design Channel (D) modeling results. 27vii
1.0 INTRODUCTION and PURPOSE of STUDYConcerns over the fate of PCB-laden channel sediments in the Kalamazoo Riverbetween Plainwell and Otsego, Michigan resulted in the U.S. Geological Survey (USGS)supporting a study by the USDA-ARS National Sedimentation Laboratory to simulatesediment loads and channel changes in the reach. The 8.8 km reach of the KalamazooRiver contains two low-head dams. The state of Michigan is interested in removing thesedams while minimizing impacts to the study reach and downstream reaches, and toprovide for improved fisheries.PCBs tend to be adsorbed on to the fine-grained sediments comprisingstreambeds, banks and floodplains. Prediction of the erosion, transport and deposition ofthese materials requires a model that can simulate streambank erosion processes, be theydue to hydraulic shear stresses at the bank toe or to gravity-induced mass failure as wellas the conventional hydraulic and entrainment processes typical of non-cohesivesediments. The CONCEPTS channel-evolution model, developed by the USDA-ARSNational Sedimentation Laboratory (Langendoen, 2000) provides for a deterministicsimulation of these processes and allows for identification of sediment sources byparticle-size class. In this way, river managers and action agencies involved with theKalamazoo River can make informed decisions regarding stream rehabilitation measures.To evaluate the impacts of removing the Plainwell and Otsego City Dams on erosion inthis 8.8 km reach of the Kalamazoo River, the CONCEPTS model was run for threedifferent scenarios as outlined by the U.S. Geological Survey.1.1Modeling ScenariosTo estimate volumes and rates of sediment transport within the study reach and toaddress specific objectives of the study, three modeling scenarios were identified, onerepresenting current channel conditions and two others representing alternative schemes.These three scenarios are termed:1. Dams In (DI) or baseline,2. Dams Out (DO), and3. Design (D).The DI scenario assumes current channel geometries and boundary sediments asinitial conditions. This simulation is used as a baseline by which to compare the twoalternative scenarios in terms of gross amounts of channel change, the mass of materialeroded from channel banks, and fine-grained sediment transport. The DO scenario alsoassumes current channel geometries as initial conditions but with the Plainwell andOtsego City Dams no longer in place, leaving 3 to 4 m-high knickpoints. This scenariosimulates channel-adjustment processes such as headward-progressing streambederosion resulting from their removal. This simulation does not model a dam breach, onlythe resulting hydraulic and sediment-transport processes associated with the“instantaneous” change resulting from removal of the non-erodable structures. Finally,1
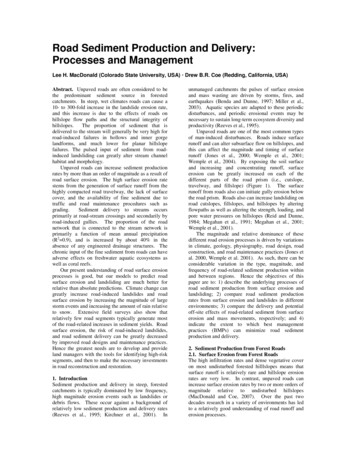
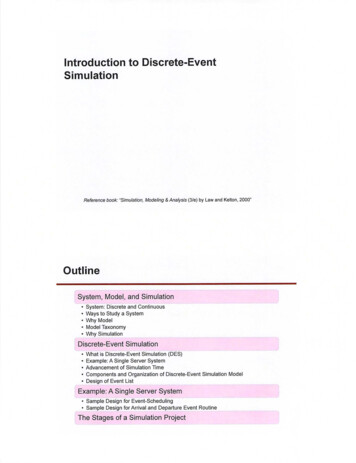
the Design scenario also assumes that the two dams are no longer in place, however, achannel geometry designed by the U.S. Geological Survey is used instead of the currentchannel geometry for initial conditions.1.1.1Modeling ReachThe modeling reach of the Kalamazoo River extends 8.8 km from approximately82.4 km above the confluence with Lake Michigan (cross-section OC8), to cross-sectionP3, approximately 91.2 km above the confluence with Lake Michigan (Figure 1). Thestudy area can be separated into three distinct sub-reaches based on location relative tothe Plainwell and Otsego City Dams. The Otsego (OC) reach extends from km 82.4 tothe Otsego City Dam at km 85.3. The Plainwell-Otsego (POC) reach extends from theupstream end of the Otsego City Dam to the Plainwell Dam at km 88.3. The Plainwellreach extends from the Plainwell Dam to the upstream boundary of the study reach at km91.2.CONCEPTS assumes gradually varying flow and therefore cannot simulate therapidly varying flow on hydraulic structures. Plainwell and Otsego City Dams arerepresented as internal boundaries. At internal boundaries flow is calculated using acontinuity and a dynamic equation (Langendoen, 2000). The continuity equation statesthat the discharges immediately upstream and downstream of the dam are equal. Thedynamic equation relates discharge to water surface elevations immediately upstream anddownstream of the dam. The flow on the Plainwell and Otsego City Dams is assumed tobe a free overfall and therefore critical. The dynamic equation then simply states that theFroude number equals one. Sediment particles transported in suspension will pass thedams, whereas sediment particles transported as part of the bed load will depositimmediately upstream of the dam as long as the upstream invert of the dam is above theelevation of the streambed. Once the streambed elevation reaches the elevation of thedam, all sediment particles will pass the structure.1.1.2Flows Entering the Modeling ReachFlows for all three modeling scenarios are based on a modified 17.7-yeardischarge record (October 1984 to June 2002) from the USGS gage on the KalamazooRiver at Comstock, Michigan (04106000) (Figure 2). This period was selected because itprovides the most recent continuous period of flow record. The gage was not operationalfor a number of years prior to October 1984. On average, mean-daily flows at theComstock gage for the modeling period are 30% higher than for the discontinuous periodstretching back to 1934 (Figure 2). Rather than adjust flows to better represent the longerperiod of record, we decided to use the higher, more recent flows to provide conservativeestimates of current sediment loads and potential channel changes. This recent periodcontains a peak flow in 1985 that is similar in magnitude to the 1947 peak of record.CONCEPTS uses daily data from 1984 to 1989 and hourly data from 1989 to June2002 to account for changing hydraulic conditions and instantaneous peaks. Comparison2
with two years of mean-daily-flow data at a recently installed gage at Plainwell(04106906) showed flows entering the study reach were approximately 20% greater thanthose at the Comstock gage due to discharges from Portage and West Portage Creeks.Time series analysis of the differences in 15-minute flow data for the two gages resultedin the following adjustment for the upstream boundary of the modeling reach:QP 1.87 (QC) 0.93897(1)where QP is discharge at the Plainwell gage, in m3/s, andQC is the discharge at the Comstock gage 10 hours earlier, in m3/s.This regression was used to modify the discharge record at the Comstock gage for themodeling period. Sediment discharge at the upstream boundary was set to localtransport capacity computed by CONCEPTS.The Gunn River flows into the POC section of the study reach from the northbetween cross-sections G5 and G6 (Figure 1). There was no flow and sediment data forthis tributary available; therefore, we estimated the flow from the Gunn River using adrainage area comparison. Using the flow record from the Kalamazoo River atComstock (04106000) (Figure 2), the drainage area at Comstock (2740 km2), and thedrainage area at the mouth of the Gunn River (296 km2), we created a 17.7-yr flowrecord for the Gunn River and used this record in all simulation scenarios. Given therespective drainage areas, the Gunn River discharge record was 17% of the KalamazooRiver at Comstock discharge record. Sediment transport capacity at the outlet of theGunn River could not be computed because no data was available on reach geometry, orbed and bank materials for the Gunn River; hence, sediment discharge was set to zero.The timing of the flow was the same as the Plainwell (upstream boundary) record.3
OC8OC7NOC6OC3 OC284OC1 FS BRDGG2G4G5868583Figure 1 – Map of study reach showing modeled cross sections and locations of thePlainwell and Otsego City Dams.4G6 G7*Distance in kilometers above confluence with Lake MichiganCross sectionKalamazoo RiverOC5 OC4Otsego City DamPlainwell DamP23P12 P11 P10P14Hwy 131P1590 P8P20P17P7P6POC11POC15G8 G9POC8POC16POC688 POC4POC3 POC1898791P5P4P3
MEAN-DAILY DISCHARGE, INCUBIC METERS PER SECOND200Mean-daily dischargeAverage 1934-2002Average 1984-2002150100506191/ 401/191/ 441/191/ 481/191/ 521/191/ 561/191/ 601/191/ 641/191/ 681/191/ 721/191/ 761/191/ 801/191/ 841/191/ 881/191/ 921/191/ 961/20001/1/1931/1/1/1/19320DATEFigure 2 – Mean-daily discharge at Kalamazoo River at Comstock (04106000) showingmean for period of record and for modeling period.1.1.3Cross-Section SchematizationThe modeling reach is composed of 52 cross sections and contains 2 low-headdams, Plainwell and Otsego City (Figure 1). A third dam, “Otsego”, is about 3 kmdownstream of the downstream-most cross section. Although the third dam has an effecton the streambed and water-surface profiles upstream, the dam itself is beyond the scopeof this study. Of the 52 cross sections used in the modeling reach, 20 were surveyed inthe early to mid 1990’s by the consulting firm Blasland, Bauck, and Lee (with floodplainextensions in 2001 by the USGS), 19 were surveyed in 2001 by the USGS, and 13 weresynthesized based on adjacent channel geometries. The synthetic cross-sections weregenerated from surveyed cross-section data to provide upstream and downstreamtransitions and boundaries for the structures, as well as to extend the OC reach to providefor improved water surface elevations below the Otsego City Dam.The stream corridor is schematized as reaches connecting cross sections. A reachis defined as a stream segment that transfers information between two adjacent crosssections. Each cross section is a node that holds unique hydraulic and channel-boundaryinformation. Cross sections specify the boundary geometry, material properties, andcharacterize the flow-carrying capability of the stream and adjacent floodplain. Eachcross section is associated with a river kilometer and stationing and elevation to describethe channel profile at any time step during simulation. Cross sections are comprised of5
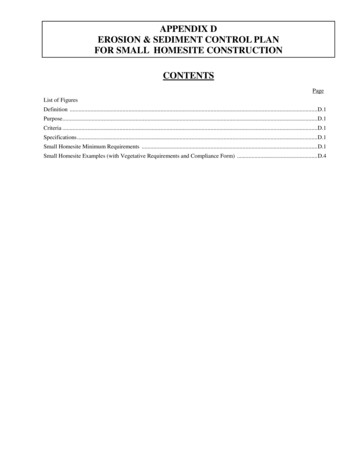
left and right floodplains, banks, and the streambed. Each of these channel surfaces isassociated with material properties and flow-resistance characteristics.2.0 PHYSICAL PROPERTIES of the CHANNEL BOUNDARYPhysical properties of each cross section are defined in terms of those variablesthat describe the forces and resistance acting on each surface of that cross section.Bed- and bank-material composition and geotechnical properties at each cross sectionwere provided by testing and sampling conducted by the ARS, laboratory analysis by theUSGS, and from historical data.2.1Borehole Shear Testing and Bulk Unit WeightsTo properly determine the resistance of cohesive materials to erosion by massmovement, data must be acquired on those characteristics that control shear strength; thatis cohesion, angle of internal friction, pore-water pressure, and bulk unit weight.Cohesion and friction angle data can be obtained from standard laboratory testing(triaxial shear or unconfined compression tests), or by in-situ testing with a boreholeshear-test (BST) device (Lohnes and Handy 1968; Lutenegger and Hallberg 1981;Thorne et al. 1981; Little et al. 1982). The BST provides direct, drained shear-strengthtests on the walls of a borehole (Figure 3). Advantages of the instrument include:1. The test is performed in situ and testing is, therefore, performed on undisturbedmaterial;2. Cohesion and friction angle are evaluated separately with the cohesion valuerepresenting apparent cohesion (ca). Effective cohesion (c’) is then obtained byadjusting ca according to measured pore-water pressure and φb (the rate ofincrease in shear strength with increasing matric suction) (Fredlund et al., 1978).3. A number of separate trials with different applied stresses are run at the samesample depth to produce single values of cohesion and friction angle based on astandard Mohr-Coulomb failure envelope.4. Data and results obtained from the instrument are plotted and calculated on site,allowing for repetition if results are unreasonable; and5. Tests can be carried out at various depths in the bank to locate weak strata(Thorne et al. 1981).BST results for the Kalamazoo River are shown in Table 1. The test location isgiven in columns 1-4, a description of the material is given in column 5, (where USCS isthe Universal Soil Classification System), and physical properties of the material aregiven in columns 6-9. An asterisk next to a value denotes that the value was estimated.Samples of a known volume were obtained at each BST testing location/depth toprovide data on bulk unit weight, moisture content, and saturated density. Samples wereanalyzed by the USGS. Results from several batches of samples were deemed unreliablebecause of exceedingly low reported gross weights and bulk unit weights. In these cases,default values for given material types were used.6
Figure 3 - Schematic representation of borehole shear tester (BST) used to determinecohesive and frictional strengths of in situ streambank materials. Modified from Thorneet al., 1981.Table 1. Borehole shear tests (BST) conducted at sites along the Kalamazoo River.Location of rans11RTrans11RP10RP10RP11RP11RP13RLayer fromtop bank121212121212121Depth of layerfrom top(m)0-5.05.1-6.60-4.74.8-6.00-1.531.54-4.60 - 3.7P16L10-2.2P16L22.3-5.8Bank Layer SP-GPML-CLSP-GPML-CLSP-GPML-SPML-SP-GPPavement ontop .116.711.315.00.00.030.0*15.96.76.120.411.6
P17P17P17P19P19P21P21P23 & 24P23 & 24POC RLRLRRRRLLRRRRL123121212112111111121111111210 - 1.71.71 - 2.72.71 51-1.200-0.870-0.820-2.80-5.20 - 4.10 - 314.6Submerged Hydraulic Jet Testing: Erodibility of Fine-Grained MaterialsThe submerged jet-test device is used to estimate erosion rates due to hydraulicforces in fine-grained in situ materials (Hanson 1990; 1991; Hanson and Simon, 2001)(Figure 4). The device shoots a jet of water at a known head (stress) onto the streambedcausing it to erode at a given rate. As the bed erodes, the distance between the jet and thebed increases, resulting in a decrease in the applied shear stress. Theoretically, the rate oferosion beneath the jet decreases asymptotically with time to zero. A critical shear stressfor the material can then be calculated from the field data as that shear stress where thereis no erosion.The rate of erosion ε (m/s) is assumed to be proportional to the shear stress inexcess of a critical shear stress and is expressed as:ε k (τo - τc) a k (τe) a(2)where k erodibility coefficient (m3/N-s); τo average boundary shear stress (Pa); τc critical shear stress; a exponent assumed to equal 1.0 and τe excess shear stress (Pa).An inverse relation between τc and k occurs when soils exhibiting a low τc have a high k8
or when soils having a high τc have a low k. The measure of material resistance tohydraulic shear stresses is a function of both τc and k. Based on observations from acrossthe United States, k can be estimated as a function of τc (Figure 5). This is generalized to:k 0.1 τc – 0.5(3)Two jet tests were conducted at each site where cohesive bed or bank-toe materialwas present. In general, the average value of the two tests were used to represent thecross section and for input into CONCEPTS. Values are shown in Table 2. CONCEPTSuses Equation 3 to compute k given τc to remove variability (especially in k) in fieldmeasurements; however, a plot of the Kalamazoo River bank-toe measurements (Figure6) showed that significant error would result from the use of Equation 3. The relationshipused for the Kalamazoo River study reach is provided in Figure 6.Figure 4 - Schematic of submerged jet-test device used to measure the erodibilitycoefficient (k), and the critical shear stress (τc), of fine-grained materials.9
Figure 5 - General relation between the erodibility coefficient k, and critical shear stressτc for fine-grained materials based on jet tests from across the United States (Hanson andSimon, 2001).3ERODIBILITY COEFFICIENT (k), IN cm /N-s1001010.1k 2.52τc-0.52r ² 0.4195% confidence intervals0.010.010.11101001000CRITICAL SHEAR STRESS, IN PaFigure 6 – Relation between erodibility coefficient (k) and critical shear stress (τc) forfine-grained materials based on jet tests from the Kalamazoo River.10
Table 2. Submerged jet-test values obtained for the Kalamazoo River.SiteP4 Right BankP4 Right BankP6 Left BankP6 Left BankP8 Right BankTrans11 Right BankP10 Right BankP10 Right BankP11 Right BankP11 Right BankP13 Left BankP13 Left BankP13 Left BankP13 Left BankP16 Left BankP16 Left BankP16 Right BankP16 Right BankP16 Right BankP17 Left BankP17 Left BankP17 Left BankP17 Left BankP17 Right BankP17 Right BankP19 Right BankP19 Right BankP21 Right BankP21 Right BankP23/24 Right BankP23/24 Right BankP23/24 Ri
River contains two low-head dams. The state of Michigan is interested in removing these dams while minimizing impacts to the study reach and downstream reaches, and to provide for improved fisheries. This study was designed to evaluate the erosion, transport, and deposition of sediments in the Kalamazoo River between Plainwell and Otsego, Michigan.