Transcription
An Investigation into Sand DuneVariation and Stability atTūhaitara Coastal ParkGEOG309 Group Report – October 15th 2018B. Lelieveld, D. Herlihy, M. Baker,R. Rowe, R. ThomasUNIVERSITY OF CANTERBURY
Table of Contents1.Executive Summary . 22.Introduction . 33.Literature Review . 34.Methods. 44.14.1.1Structure from Motion. 44.1.2Sediment Sampling . 44.1.3Ground Penetrating Radar (GPR) . 54.25.Primary Data. 4Secondary Data . 54.2.1Beach-Profiles . 54.2.2Aerial/Historic Photographs. 6Results. 75.1 Beach-profiles, Excursion and Steepness . 75.2Aerial/Historic photography. 85.3Structure from Motion-Beach-profiles . 85.3.1 Point Clouds . 8. 85.3.2 Digital Surface Models and Beach-profiles. 96.5.4Sediment Analysis . 105.6Ground Penetrating Radar (GPR) profiles . 11Discussion . 126.1 Interpretation of Results . 126.1.1 Sea-level Excursion . 126.1.2 Beach Morphology Changes . 126.1.3 Beach Gradient . 136.1.4 Historic Analysis . 136.1.5 Structure from Motion . 136.1.6 Sediment Analysis . 146.1.7 Ground Penetrating Radar. 146.2Discussion of Results . 146.2.1 Historic Analysis . 146.2.2 Sediment Analysis . 151
6.2.3 Ground Penetrating Radar. 156.3Suggestions. 156.4Research Limitations . 157.Conclusions . 168.Acknowledgements . 16Appendices. 17Appendix A – Equation for Beach Gradient . 17Appendix B – Sea-Level Excursion and Beach-profile Comparisons: 1991 and 2017 . 17Appendix C– Elevation Profiles for Correction of GPR Data . 19Appendix D - Ground Penetrating Radar Profiles . 20References . 211. Executive SummaryContext: Tūhaitara Coastal Park (TCP) is a 10.5 kilometre stretch of protected land in PegasusBay. A site of economic, environmental and cultural significance. Dune shape and stability appears to vary spatially at the site.Research Question: What are the key factors that influence the spatial variation of dune stability atTūhaitara Coastal Park?Methods: Used a combination of fieldwork and secondary data analysis. Fieldwork methods included: Drone based Structure from Motion techniques. Spatially distributed Sediment Sampling. Ground Penetrating Radar (GPR). Secondary data analysis included analysing: 50 years of aerial photography of the two beach sites. 27 years of beach-profile data from Environment Canterbury (ECan).Key Findings: Trends in beach-profiles and historic analysis suggest the restricted recession ofdune migration leads to over steepening of dune profiles. Sediment analysis suggests that sediment availability is the same throughout TCP,with variations in sediment supply. GPR findings suggest long term erosional trends at Waikuku beach and verticalaccretion. While Pines beach displays small erosion and accretion features.Limitations: Broadness of the research question. Limited by the quality of secondary datasets available. Results are only indicative of decadal changes in dune shape and stability.2
Suggestions: Investigate how anthropogenic processes influence the variation of the beach.2. IntroductionLocated in Pegasus Bay, Tūhaitara Coastal Park (TCP) is a 10.5 kilometre stretch of protectedland from Pines Beach near the Waimakariri River Mouth to Waikuku Beach adjacent to theAshley River mouth. The land was gifted to the Ngāi Tahu iwi from the government due to itscultural significance and it also hosts a diverse range of native flora and fauna. As such,environmental changes at the site can have significant consequences on its sustainability andmay adversely affect the communities living nearby. Spatial variation of the TCP sand dunesrepresents one sign of environmental change at the park. Pines Beach appears to havehealthier dunes that are more developed than the dunes at Waikuku Beach, which appear tobe eroding. Therefore, this paper attempts to identify some of the key factors that areinfluencing the spatial variation of dune stability at TCP.The research framework had two aims: to firstly identify the shape of the dunes, and to thenevaluate how their shape has changed over time; resulting in their change of stability. Thepaper begins with a review of relevant literature that adds insight into what processesoperate on and around sand dunes or other processes that may contribute to the observedphenomena. Next, the research methods are stated before the results and discussions. Lastly,the conclusion summarises the key findings of the report and reflects on future research thatmay be done in the area.3. Literature ReviewBeach gradient and morphology plays an integral part in how coastal environments withstandstorm events. Incoming waves begin to interact with the seabed at a critical depth where theybegin to shoal. This interaction causes energy to dissipate from the waves due to seabedfriction (Masselink, Hughes, & Knight, 2014). If this process occurs over a shallow beachgradient, more energy can be dissipated from the incoming wave before it breaks over theshore.Alternatively, at steeper beaches, wave-runup is comparatively shorter. This limits thecapacity for a coast to dissipate incoming wave energy. As a result, waves break onshore atthese beaches more forcefully, resulting in higher levels of erosion. (Puijenbroek et al., 2017;Short & Hesp, 1982; Wright & Short, 1984). Clusters of smaller storms in rapid succession cancause beach erosion that resembles the levels of erosion induced by single larger stormevents with higher return periods (Karunarathna, Pender, Ranasinghe, Short, & Reeve, 2014).Sudden changes in beach steepness reduces the effectiveness of the aeolian transport of sand(Hesp, 2002). Dunes build up over time as a result of aeolian (wind-driven) sedimentdeposition. Reconstruction of a beach after a storm initiates as berm reconstruction, andrecovery and effective build-up of dunes is dependent on the transportation of sediment ontothe beach from the nearshore environment, and eventually onto the dunes (Houser et al.,2015). Due to the aeolian process involved, the sand needs to dry out in order to betransported. Afterwards, wave [and wind] action will sort the sediment resulting in grading;3
with the sediment becoming finer from the beach to the dunes (Çelikoğlu, Yüksel, & Kabdaşli,2006)The introduction of exotic plant species such as Marram grass (Ammophila arenaria) and Pinetrees (Pinus radiata) has significantly changed the structure of sand dune complexes in NewZealand. Hilton (2006) states there was a 70% loss of the total area of sand dunes in NewZealand between 1950 and 1990. This is due to the changes made in vegetation and humandevelopments on the dunes such as conversion for farming. Marram grass creates sand duneswhich tend to be more stable and larger than dunes with native plants, which is due toMarram being an efficient binding plant to aeolian transport (Petersen, Hilton, & Wakes,2011).Sea-level rise around New Zealand is an important factor which should be considered.Available tide gauge data in Lyttelton from 1925 to 2004 has shown an average sea-level riseof 2.0 ( 0.15) mm/year (Hannah & Bell, 2012). Globally the sea level has increased at a rateof 3.2 0.4 mm yr 1 between 1993 and 2009 (Ackerley, Bell, Mullan, & McMillan, 2013). Thisrising trend could have implications for the future of the coastal dunes at the TCP.Luisa Martínez, Mendoza-González, Silva-Casarín, and Mendoza-Baldwin (2014) define‘coastal squeeze’ as “the process in which coastal ecosystems are threatened by thecombination of sea-level rise and the presence of a physical barrier, such as humaninfrastructure” Consequently, this process can lead to degradation of dune complexes bysignificantly compressing the dune width, which increases their vertical growth and enhancesdune instability (Lucrezi, Saayman, & Peet van der, 2014).4. Methods4.1Primary Data4.1.1 Structure from MotionA camera mounted Phantom Drone Quadcopter was used to survey predetermined sites atboth Pines and Waikuku beaches. The drone was tasked to fly a set track at an altitude of 40m, to capture a series of photographs with approximately 70% image overlap. Within thestudy sites were up to ten high contrast, numbered Ground Control Points (GCP’s) which weregeoreferenced to the Global Navigation Satellite System (GNSS), by manual data point entryof Trimble Rovers to a local Total Station. Appropriate notice of drone flight was given to thepublic by use of caution signs for the duration of the survey.The series of photographs were then uploaded to Agisoft PhotoScan software to be processedinto a 3-dimensional point cloud and calibrated to the GNSS data. The corrected point cloudwas then interpolated into a series of rasters to generate the 3D Digital Surface Models. Alldata was formatted to the New Zealand Transverse Mercator projection coordinate systemto maintain consistency throughout the data processing steps.4.1.2 Sediment SamplingSediment samples were obtained from specified points at four different locations. Theselocations were: (1) Pines Beach, (2) Woodend Beach, and Waikuku Beach, with differentsample sets obtained from (3) the dunes north of the Waikuku Surf Club, and (4) from the4
dunes south of the surf club. The specific points at each location from which the sedimentwas sourced were the beach foreshore, the berm, the dune toe and the crest of the mostseaward dune structure (foredune). This added up to sixteen samples in total.Once the sediment was sampled, it was returned to the laboratory and placed in a sedimentoven for approximately 5 days to dry off the moisture. Once dry, the sediment samples wereeach run through a Dry Image Analyser (DIA). The DIA used rapid digital photography to trackeach grain of sediment as it fell past the camera. This allowed the variables of grain lengthand grain width to be captured for each grain. The DIA then automatically calculated the meanwidth and mean length of the sediment grains for each sample.4.1.3 Ground Penetrating Radar (GPR)The internal structure of sand dunes at the TCP were investigated by using a GroundPenetrating Radar (GPR) system. This method collects imagery of the subsurface, essential forquantifying the state of stability within the sand dunes, as well as how they have built up overtime. Literature by Bristow and Pucillo (2006) proves that GPR is a valuable method forinvestigating both accretion and erosional surfaces within dunes. Throughout our project, apulseEKKO GPR system was used. The equipment consisted of a digital video logger, atransmitter, a receiver and interchangeable antenna with variable bandwidths.At both Pines beach and Waikuku beach, 100 MHz antennas were used with 1 m spacing asmeasurements were taken at 25 cm intervals along the respective profiles. Due to the dunecomplexity at Waikuku beach, further measurements were taken along the same transect lineusing 200 MHz antennas. These 200 MHz antennas were set at 50 cm spacing, whilemeasurements were made every 10 cm. The profile lines that the GPR followed extendedperpendicular to the coast, from the foreshore to the stoss side of the dunes. This rangeallowed for a cross-sectional view to be produced for visualising the influence of coastalprocesses.The GPR data was processed using the Reflexw software. Automatic gain control (AGC), wasused to magnify the trace signals horizontally, thereby enhancing the signals and highlightingreflective surfaces. Energy decay processing was applied to correct for the loss in energy withdepth. Static correction (also known as air removal) was applied to ensure that the signalsrecorded were from the ground rather than the air or vegetation. The velocity was alsodetermined using the Reflexw software, allowing for the calculation of depth within eachprofile. To correct for the changes in dune topography when the signals were transmitted,the topography was corrected using elevation profiles, which were produced with atheodolite and reflective staff. These elevation profiles are shown in Appendix C.4.2Secondary Data4.2.1 Beach-ProfilesAnalysis of beach profile data is a method that can be used to track the changes in beachmorphology over time and making comparisons thereof (Cheng, Wang, & Guo, 2016; Zhanget al., 2015). The data of the beach-profiles was sourced from ECan and had been collectedover a series of annual surveys from November of 1991 to November of 2017. The beachprofiles were produced and analysed using Excel, and various characteristics of the beachwere then found by analysing the shapes and behaviour of the profiles. Examples of thesebehaviours included sea-level excursion, beach cross-sectional morphology, and beachgradient.5
Sea-level excursion refers to the movement of the point where the beach-profile reaches sealevel. Shoreward movement indicates a loss of beach area while seaward movement indicatesa gain in beach area. In this study, the sea-level excursion for each site was obtained by findingthe horizontal distance from the original survey point. This was carried out for each individualsurvey that had been carried out on each beach. Some profiles did not have a zero-point inthe vertical axis but, since all the points in each profile were corrected to the same geographiccoordinate system, the zero-point could be located by linear interpolation. The results werethen graphed (Figure 1), which allowed for any trends in the sea-level excursion data to befound.Beach gradient refers to the average steepness of the beach in terms of vertical distance overhorizontal distance. In this study, the equation in Appendix A defines the beach gradient.Graphing of the results (Figure 2) then allowed for the identification of any trends towardsteeper or shallower beach morphology at each location.Qualitative comparisons and contrasts of the beach morphologies in 1991 and 2017 were alsoobserved in the profile data. This gave a raw comparison of each of the beaches as theyappeared in those years, which represented end-members of the beach-profile datasets.Interest was taken in any clear seaward or landward migration on the beach during. Thebeach-profiles that were used for these comparisons can be viewed in Appendix B.4.2.2 Aerial/Historic PhotographsPhoto analysis data consisted of historic imagery provided by Canterbury Maps (2018), whereimages from the 1970-74, 1990-94, and modern coast line (2017) were compared across thetwo sites at Pines and Waikuku beaches. These images were calibrated and overlain so that itwas possible to track shoreline migration, dune positioning, and level of development fromanthropogenic sourcing.6
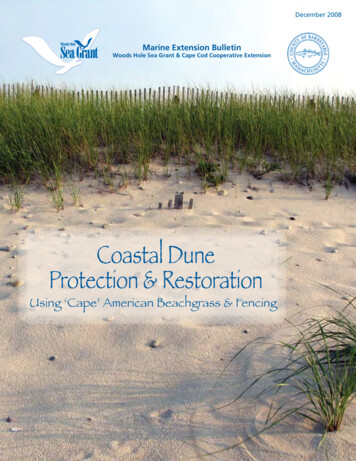
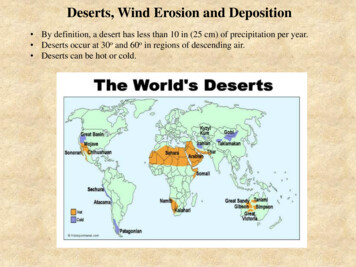
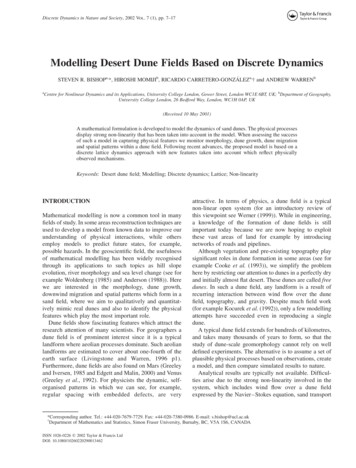
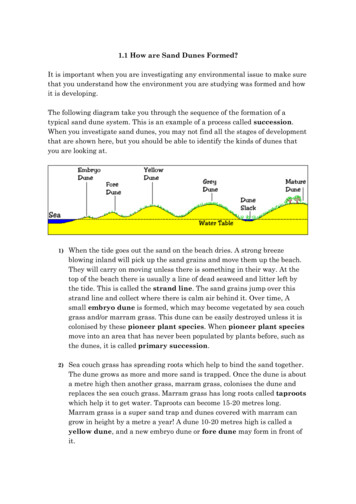
5. Results5.1 Beach-profiles, Excursion and SteepnessFigure 1. A graph comparing the sea-level excursion trends and behaviour at each of thebeach locations from 1991 to 2017. Note the circles around the excursion data in 1995,and 2015 when more data points were taken.Figure 2. A graph comparing the trends and behaviour of beach steepness at each beachlocation from 1991 to 2017. The points marked in pink on beach profile between Pinesand Woodend signifies when new foredunes structures began to develop at this location.7
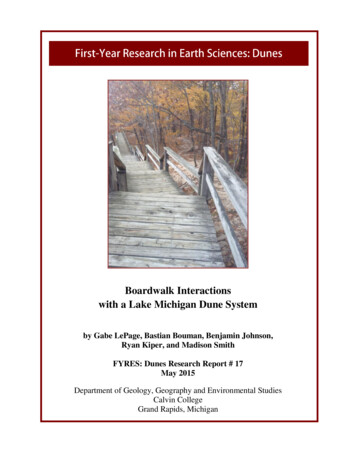
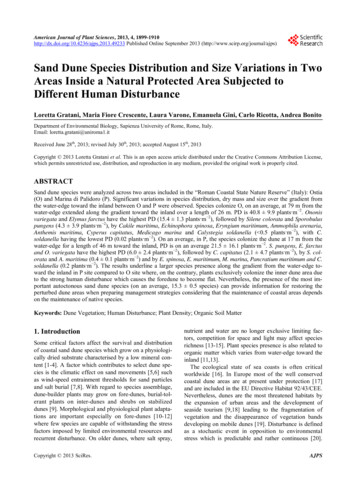
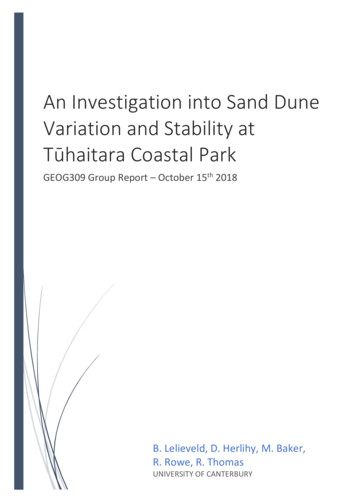
5.2Aerial/Historic photographyFigure 3: ABOVE, Pines Beach. BELOW, Waikuku Beach. Both series of images are from 1970,1990, and 2017 from left to right respectively. Red line relative position of 1970’s shoreline,Blue line relative position of 1990’s shoreline.5.3Structure from Motion-Beach-profiles5.3.1 Point CloudsFigure 4: Dense Point Cloud model with mesh of Pines Beach in Agisoft.8
Figure 5: Dense Point Cloud with mesh model of Waikuku North in Agisoft.5.3.2 Digital Surface Models and Beach-profilesFigure 6: Digital Surface Model of Pines Beach with upper and lower transects and Beachprofiles.9
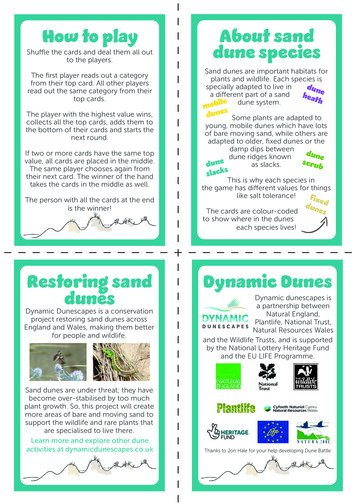
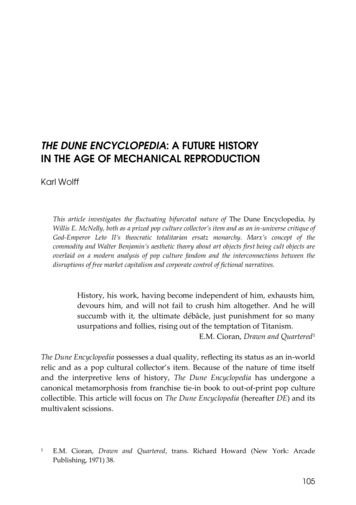
Figure 7: Digital Surface Model of both Waikuku North in blue, includes Beach-profiles.Includes the warped data of Waikuku South.5.4Sediment AnalysisMean Sediment Grain Length (µm)300Mean Sediment Grain Length2902801. PinesBeach2702602. WoodendBeach2502403. WaikukuBeach South2304. WaikukuBeach North2202102001. Dune Crest2. Dune Toe3. Berm4. ForeshoreLocation on BeachFigure 8: Mean sediment grain length on the foreshore, berm, dune-toe and dune-crest ateach beach location.10
200Mean Sediment Grain WidthSediment Grain Width (µm)1901801. PinesBeach1701602. WoodendBeach1501403. WaikukuBeach South1304. WaikukuBeach North1201101001. Dune Crest2. Dune Toe3. Berm4. ForeshoreLocation on BeachFigure 9: Mean sediment grain width on the foreshore, berm, dune-toe and dune-crest ateach beach location.5.6Ground Penetrating Radar (GPR) profilesThe Processed GPR data used to interpret the profiles below can be found in Appendix D.Figure 11: Processed and interpreted GPR data acquired at Pines beach, (100MHz antenna).Red represents erosional surfaces while the white shading represents areas of accretion.Figure 12: Processed and Interpreted GPR data acquired at Waikuku beach, (100MHzantenna). The yellow lines indicate erosional surfaces while the white shading representsaccretion.11
Figure 13: Processed and Interpreted GPR data acquired at Waikuku beach, (200MHzantenna). The yellow line represents an erosional surface, while the white shading showsareas of accretion.6. Discussion6.1 Interpretation of Results6.1.1 Sea-level ExcursionThe sea-level excursion plots (compiled in Figure 1) indicated different trends for each of thebeaches over the 27-year period over which the profile data had been compiled. Pines Beachand Woodend Beach each recorded trends that were stable overall, with only very smallshoreward and seaward trends respectively. The most significant seaward trends wereevident in the data for the beach between Pines Beach and Woodend Beach and at PegasusBeach, while there was an overall landward trend at Waikuku beach. Each of the sea-leveltrends fitted relatively poorly with the corresponding data; there was significant variation ofsea-level position year-to-year for each of the locations. The beaches also had substantialranges of excursion fluctuation, with ranges of between approximately 40 and 80 metres(Appendix B1). Extra data points were taken in 1995 (Figure 1) which suggest that thevariation in sea-level excursion can be considerable over shorter timespans.6.1.2 Beach Morphology ChangesIn a comparison between the 1991 and 2017 profiles of Pines Beach, there appears to be again in sediment volume. The berm and upper beach in 2017 appeared to be raised incomparison to 1991, although the upper beach had also retreated somewhat landward; seeAppendix B2.Similarly, it appeared that the beach north of Pines Beach and south of Woodend Beach hadalso advanced seaward. Two large dune-like structures appear to have developed during the27-year period, and both the berm and foreshore appear to have advanced seaward as well;see Appendix B3.Woodend Beach and Pegasus Beach both experienced similar growth patterns, withsignificant vertical development at both. However, Pegasus Beach, which exhibited moreintense vertical growth, has advanced in such a manner that the berm and foreshore sectionsof the beach have become somewhat narrowed. See Appendices B4 and B5.12
Waikuku Beach appears to have lost volume. The beach-profile was noticeably steeper in2017 in comparison to 1991. There has been some vertical development of the beach, butalso a significant loss of volume - see Appendix B6.Appendix B7 gives a comparison of the latest profiles of Pines and Waikuku Beaches. It showsthat Pines Beach is wide and has a well-developed berm and beach face. On the other hand,Waikuku Beach is comparatively steeper and narrower with a poor berm area.6.1.3 Beach GradientShallowing trends are evident at most beaches along the TCP, however the trend forWoodend Beach appears stable, with a very small but overall negligible steepening trend,thus indicating that the average gradient of this beach has not tended greatly towardbecoming steeper or shallower during the past 27 years. However, the data is indicative ofconsiderable variability in gradient despite the stable trend. Pegasus Beach displays evidenceof a steepening trend over the 27-year period and it is also the portion of Pegasus Bay thatattained the highest values of beach gradient over this period.The beach between Pines Beach and Woodend Beach had two instances, one in 1993 and theother in 2008, when the gradient of the beach suddenly decreased. These two instances arehighlighted in Figure 2 and correspond to the genesis of new foredune structures on the beachahead of the main dunes. With the reference point for the beach gradient now moved to thenew foredune, the gradient was reduced as a result.There is a significant amount of variability with the annual values in beach-gradient trendswhich is evident in Figure 2. As such, each of the beach-gradient trends fit relatively poorlywith the corresponding data. This suggests that the beaches each tended to transitionbetween steeper and shallower profiles year-to-year.6.1.4 Historic AnalysisHistoric imagery places beach gradient into perspective, as it becomes obvious how muchsteeper both beaches have become over the near 50-year period. The shoreline of Pinesbeach has advanced since the 1970’s, but appears to have stabilised since the 1990’s. Themodern beach appears much narrower since the development of the backing Pine forest andother significant infrastructure. Much of the historic dune field is no longer active in thebeach-berm system.The shoreline position of Waikuku has not significantly moved in the 50-year observationperiod. Despite this, the dunes appear to have migrated seaward. Waikuku beach appears tobe narrowing, with the width of the berm significantly decreasing through time.6.1.5 Structure from MotionPines Beach appears healthy as shown in Figures 4 and 6, with the surface models producingtransects of the beach-profiles inclusive of many dunes at various stages of theirdevelopment. The berm is wide and spans spatially an order of magnitude larger thanWaikuku. Waikuku North is shown by Figures 5 and 7 and appears to have a large erosionscarp which runs for hundreds of meters in both directions of the shore. This scarp is between6-8 m tall in most places, and undercuts much of the primary dune. The berm is narrow, withthe dunes large and clearly unstable.13
The point cloud model of Waikuku South had significant spatial warping due to theinadequate placement of Ground Control Points across the site. This was due to physicalinaccessibility of the steep dunes and dense vegetation. Despite this, the digital surface modelstill represents the large erosion scarp across the beach-profile transects and can thereforebe used in analysis.6.1.6 Sediment AnalysisAnalysis of sediment samples (Figures 8 and 9) shows that the mean sediment grain size islarger at the foreshore and berm of Waikuku Beach compared to the beaches at Pines andWoodend (Figures 8 and 9). Since Waikuku Beach is narrower than the other two beaches,finer dune building sediment that would otherwise be deposited from sediment sortingprocesses is frequently removed by wave erosion (Çelikoğlu et al., 2006). Therefore, there isa greater supply of dune building sediment at Pines and Woodend Beach.It is worth noting that the difference in mean sediment size is smallest for all the sites at theirdune toe and crest. This shows that dune building sediment is present at all the sites and thisprovides evidence that issues of sediment availability are not causing the spatial variation ofdune stability at TCP.It can also be seen that the mean sediment grain length and width increases for all the sitesbetween the dune toe and the dune crest. Two possible explanations for this include windblowing finer sediment off the dune crest where it then deposits in the dune toe in asecondary sediment sorting process, and the steepness of the dunes could be making itdifficult for this fine sediment to be transported back to the top of the dune by aeolianprocesses, as supported by the work of Hesp (2002).6.1.7 Ground Penetrating RadarThe GPR profiles reinforce the variation of stability between the two key study sites, Waikukubeach and Pines beach. Figure 11 indicates a trend of stability at Pines beach. This is evidentdue to the presence of both small-scale accretion and erosional features. Although the profiledoes show erosional features, these are spread over a much larger area as the dune field isfurther developed. At Waikuku beach however, figures 12 and 13 highlight the large truncatederosional surfaces. These erosional surfaces extend to the stoss side of the dunes indicatingperiods of transgression. Due to the narrow beach shown in the aerial photographs, theaccommodation space at Waikuku beach is low. Therefore, between these erosional surfaces,the dunes have been forced to build up vertically during periods of accretion.6.2Discussion of Results6.2.1 Historic AnalysisHistoric imagery and secondary data analysis indicate that the coast of the Tūhaitara CoastalPark is steepening. This is most pronounced in Waikuku Beach, where the backing Pine treeforest limits the inland migration response of the sand dunes to sea-level rise. The concept ofcoastal squeeze as described by Lucrezi et al (2014) supports this observation. Waikuku Beachis the only site that has experienced significant volume loss from 1991 to 2017. However, thevertical growth trends and seaward beach migration displayed by the southernmost beachprofile plots (shown in Appendix B) suggest that each beach along TCP may be experiencing a14
narrowing trend as sea-levels continue to rise, thus resulting in a continual trend of dunebuild-up to instability.6.2.2 Sediment AnalysisSediment analysis demonstrates that changes in sediment size across TCP are not influencingthe spatial variation of dune stability at the site. This is a significant result because while itdoes not answer the research question, it rules this factor out. These results support the widerliterature in terms
dune migration leads to over steepening of dune profiles. Sediment analysis suggests that sediment availability is the same throughout TCP, with variations in sediment supply. GPR findings suggest long term erosional trends at Waikuku beach and vertical accretion. While Pines beach displays small erosion and accretion features. Limitations: