Transcription
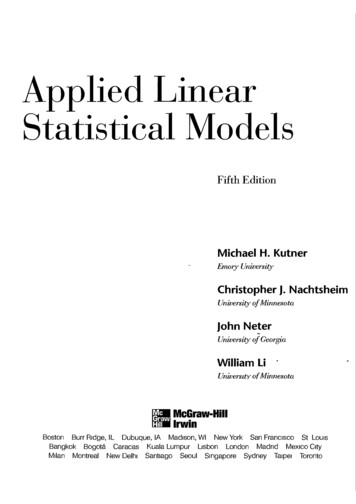
Applied LinearStatistical ModelsFifth EditionMichael H. KutnerEmOlY UniversityChristopher J. NachtsheimUniversity ofMinnesotaJohn NeterUniversity of GeorgiaWilliam LiUniverslty ofMinnesotawa McGraw-Hilit:a IrwinBoston Burr RIdge, IL Dubuque, IA MadIson, WI New York San FrancIsco St LoUIsBangkok Bogota Caracas Kuala Lumpur LIsbon London Madnd MexIco CItyMIlan Montreal New Deihl SantIago Seoul Smgapore Sydney TaIpeI Toronto
ContentsPART ONESIMPLE LINEAR REGRESSIONCited ReferencesProblems 33Exercises 37Projects 381Chapter 1Linear Regression with One PredictorVariable 21.1Relations between Variables1.2 Regression Models and Their UsesHistorical Origins 5Basic Concepts 5Construction of Regression ModelsUses of Regression Analysis 8Regression and Causality 8Use of Computers 91.32 1 Inferences Concerning f3132.2712151.7 Estimation of Error Tenns Variance 0- 21.B24Normal Error Regression Model26Model 26Estimation of Parameters by Methodof Maximum Likelihood 27xii2.4Interval Estimation of E{Yh }522.5 Prediction of New Observation 55Method of Least Squares 15Point Estimation of Mean Response 21Residuals 22Properties of Fined Regression Line 23Point Estimator of 0-50Effects of Departures from Normality 50Interpretation of Confidence Coefficientand Risks of Errors 50Spacing of the X Levels 50Power of Tests 50Sampling Distribution ofYh 52Sampling Distribution of(Yh - E{Yh})/s{Y,J 54Confidence Interval for E {Yh} 5413Overview of Steps in RegressionAnalysis 13Estimation of Regression Function2Sampling Distribution of b I 41Sampling Distribution of(b l - ,8d/s{bd 44Confidence Interval for ,81 45Tests Concerning ,81 47Inferences Concerning f30 48Sampling Distribution ofb o 48Sampling Distribution of(b o - ,8o)/s{b o} 49Confidence Interval for f30 49Concerning f30 and f3112Observational Data 12Experimental Data 13Completely Randomized Design4023 Some Considerations on Making InferencesSimple Linear Regression Modelwith Distribution of Error TennsUnspecified 91.4 Data for Regression Analysis1.6Inferences in Regression and CorrelationAnalysis 405Formal Statement of Model 9Important Features of Model 9Meaning of Regression Parameters 11Alternative Versions of Regression Model1.5Chapter 22Functional Relation between TwoVariables 2Statistical Relation between Tho Variables3324Prediction Interval for Yh(new) whenParameters Known 56Prediction Interval for Yh(new) whenParameters Unknown 57Prediction of Mean of m New Observationsfor Given X h 602.6 Confidence Band for Regression Line 612.7 Analysis of Variance Approachto Regression Analysis63Partitioning of Total Sum of Squares 63Breakdown of Degrees of Freedom 66
Contents xiii3.4 Overview of Tests InvolvingResiduals 114Mean Squares 66Analysis of Variance Table 67Expected Mean Squares 68F Test of f31 0 verSUS f31 1 0 692.8Tests for Randomness lI4Tests for Constancy of VarianceTests for Outliers 115for Normality 115General Linear Test Approach 72Full Model 72Reduced Model 72Test Statistic 73Summary 73Correlation Test for Nonnality3.6 Tests for Constancy of ErrorVariance 1163.52.9 Descriptive Measures of Linear Associationbetween X and Y 742.10 Considerations in Applying RegressionAnalysis 77211 Nonnal Correlation Models 78Distinction between Regression andCorrelation Model 78Bivariate Normal Distribution 78Conditional Inferences 80Inferences on Correlation Coefficients 83Spearman Rank Correlation Coefficient 87Cited ReferencesProblems 89Exercises 97Projects 9889F Test for Lack of Fit 119Assumptions 119Notation 121Full Model 121Reduced Model 123Test Statistic 123ANOVA Table 1243.8 Overview of Remedial Measures 127Nonlinearity of RegressionFunction 128Nonconstancy of Error Variance 128Nonindependence of Error Terms 128Nonnormality of Error Terms 128Omission of Important PredictorVariables 129Outlying Observations 1293.9 TransfonnationsChapter 3Diagnostics and Remedial Measures3.1 Diagnostics for Predictor Variable3.2 Residuals 102100100Properties of Residuals 102Semistudentized Residuals 103Departures from Model to Be Studied byResiduals 1033.3 Diagnostics for Residuals103Nonlinearity of Regression Function 104Nonconstancy of Error Variance 107 Presence of Outliers 108Nonindependence of Error Terms 108Nonnormality of Error Terms 110Omission of Important PredictorVariables 112Some Final Comments 114115Brown-Forsythe Test 116Breusch-Pagan Test lI83.7Coefficient of Determination 74Limitations of R2 75Coefficient of Correlation 76lI5129Transformations for NonlinearRelation Only 129Transformations for Nonnormalityand Unequal Error Variances 132Box-Cox Transformations 1343.10 Exploration of Shape of RegressionFunction 137Lowess Method 138Use of Smoothed Curves to Confirm HuedRegression Function 1393.11 Case Example-PlutoniumMeasurement 141Cited References 146Problems 1.46Exercises 151Projects 152Case Studies 153',,-
xiv ContentsVector and Matrix with All ElementsUnity 187Zero Vector 187Chapter 4Simultaneous Inferences and OtherTopics in Regression Analysis 1544.1Joint Estimation of f30 and f315.5154Need for Joint Estimation 154Bonferroni Joint Confidence IntervalsWorking-Hotelling ProcedureBonferroni Procedure 1595.6 Inverse of a Matrix5.7 Some Basic Results for Matrices 1935.B Random Vectors and Matrices 193Simultaneous Prediction Intervalsfor New Observations 1604.4 Regression through Origin 161Model 161Inferences 161Important Cautionsfor Using Regressionthrough Origin 164Effects of Measurement ErrorsMeasurement Errors in YMeasurement Errors in XBerkson Model 1671651651655.12 Analysis of Variance ResultsII!/IIIIIl,I"IiIIIIII!!Regression Coefficients 207Mean Response 208Prediction of New Observation 209176Cited ReferenceProblems 209Exercises 2125.2 Matrix Addition and Subtraction5.3 Matrix MUltiplication 182180Multiplication of a Matrix by a Scalar 182Multiplication of a Matrix by a Matrix 182Symmetric Matrix 185Diagonal Matrix 1852045.13 Inferences in Regression AnalysisDefinition ofMatrix 176Square Matrix 178Vector 178Transpose 178Equality ofMatrices 1795.4 Special Types of Matrices202Sums of Squares 204Sums of Squares as QuadraticForms 205Matrix Approach to SimpleLinear Regression Analysis 176MatricesSimple Linear Regression Modelin Matrix Terms 1975.10 Least Squares Estimationof Regression Parameters 199Fitted Values 202Residuals 203Chapter 55.15.95.11 Fitted Values and ResidualsII!II0'Expectation ofRandom Vector or MatrixVariance-Covariance Matrixof Random Vector 194Some Basic Results 196Multivariate Normal Distribution 196Normal Equations 199Estimated Regression Coefficients 2004.6 Inverse Predictions 1684.7 Choice of X Levels 170Cited References 172Problems 172Exercises 175Projects 175in189Finding the Inverse 190Uses of Inverse Matrix 1921584.34.5Linear Dependence 188Rank of Matrix 1881554.2 Simultaneous Estimation of MeanResponses 157Linear Dependence and Rankof Matrix 188185209PART TWOMULTIPLE LINEARREGRESSION 213Chapter 6Multiple Regression I6.1214Multiple Regression Models214206
Contents xvNeedfor Several Predictor Variables 214First-Order Model with Two PredictorVariables 215First-Order Model with More than TwoPredictor Variables 217General Linear Regression Model 217Basic Calculations 237Estimated Regression Function 240Fitted Values and Residuals 241Analysis ofAppropriateness of Model 241Analysis of Variance 243Estimation of Regression Parameters 245Estimation of Mean Response 245Prediction Limitsfor New Observations 2476.2 General Linear Regression Model in MatrixTenns 2226.3 Estimation of Regression Coefficients 2236.4 Fitted Values and Residuals 2246.5 Analysis of Variance Results 225Sums of Squares and Mean Squares 225F Test for Regression Relation 226Coefficient ofMultiple Determination 226Coefficient ofMultiple Correlation 2276.6Inferences about RegressionParameters 227Interval Estimation of f3kTests for f3k 228Joint Inferences 228Oted Reference 248Problems 248Exercises 253Projects 254Chapter 7Multiple Regression II 2567.16.7 Estimation of Mean Response andPrediction of New Observation 2296.8 Diagnostics and Remedial Measures 232Scatter Plot Matrix 232Three-Dimensional Scatter Plots 233Residual Plots 233Correlation Testfor Normality 234Brown-Forsythe Test for Constancy of ErrorVariance 234Breusch-Pagan Testfor Constancy of ErrorVariance 234F Test for Lack of Fit 235Remedial Measures 2366.9 An Example-Multiple Regression withTwo Predictor Variables 236Setting236256Basic Ideas 256Definitions 259Decomposition of SSR into Extra Sumsof Squares 260ANOVA Table Containing DecompositionofSSR 261228Interval Estimation of E{Y" } 229Confidence Regionfor RegressionSurface 229Simultaneous Confidence Intervals for SeveralMean Responses 230Prediction of New Observation Y"(new} 230Prediction of Mean of m New Observationsat X" 230Predictions of g New Observations 231Caution about Hidden Extrapolations 231Extra Sums of Squares7.2 Uses of Extra Sums of Squares in Tests forRegression Coefficients 263Test whether a Single {Jk 0 263Test whether Several f3k 07.3264Summary of Tests Concerning RegressionCoefficients 266Test whether All f3k 0 266Test whether a Single f3k 0 267Test whether Some f3k 0 267Other Tests 2687.4 Coefficients of Partial DeterminationTwo Predictor Variables 269General Case 269Coefficients of Partial Correlation7.5268276Standardized Multiple RegressionModel 271Roundoff Errors in Normal EquationsCalculations 271Lack of Co.mparability in RegressionCoefficients 272\Correlation Transformation 272Standardized Regression Model 273X'X Matrixfor Transformed Variables 274
xvi ContentsEstimated Standardized RegressionCoefficients 2757.6Multicollinearity and Its Effects278Uncorrelated Predictor Variables 279Nature of Problem when Predictor VariablesAre Perfectly Correlated 281Effects of Multicollinearity 283Needfor More Poweiful DiagnosticsforMulticollinearity 289Cited ReferenceProblems 289Exercise 292Projects 2938.5 Modeling Interactions between Quantitativeand Qualitative Predictors 324Meaning ofRegression Coefficients8.6Polynomial Regression Models3278.2 Interaction Regression Models8.7 Comparison of Two or More RegressionFunctions 329Soap Production Lines Example 330Instrument Calibration Study Example 334294Uses of Polynomial Models 294One Predictor Variable-Second Order 295One Predictor Variable-Third Order 296One Predictor Variable-Higher Orders 296Two Predictor Variables-Second Order 297Three Predictor Variables-SecondOrder 298Implementation of Polynomial RegressionModels 298Case Example 300Some Further Comments on PolynomialRegression 305Cited Reference 335Problems 335Exercises 340Projects 341Case Study 342Chapter 9Building the Regression Model I:Model Selection and Validation 3439.13439.2 Surgical Unit Example 3509.3 Criteria for Model Selection 353or SSEp Criterion 354R?;,p or MSEp Criterion 355Mallows' Cp Criterion 357AICp and SBC p Criteria 359PRESS p Criterion 360313Qualitative Predictor with TwoClasses 314Interpretation ofRegression Coefficients 315Qualitative Predictor with More than TwoClasses 318Time Series Applications 319Overview of Model-Building ProcessData Collection 343Data Preparation 346Preliminary Model Investigation 346Reduction of Explanatory Variables 347Model Refinement and Selection 349Model Validation 350306Interaction Effects 306Interpretation of Interaction RegressionModels with Linear Effects 306Interpretation of Interaction RegressionModels with Curvilinear Effects 309Implementation of Interaction RegressionModels 311Qualitative PredictorsMore Complex Models324More than One Qualitative PredictorVariable 328Qualitative Predictor Variables Only 329Regression Models for Quantitativeand Qualitative Predictors 2948.3Indicator Variables versus AllocatedCodes 321Indicator Variables versus QuantitativeVariables 322Other Codings for Indicator ltlriables 323289Chapter 88.18.4 Some Considerations in Using IndicatorVariables 3219.4Automatic Search Procedures for ModelSelection 361"Best" Subsets Algorithm 361Stepwise Regression Methods 364
Contents xvii9.59.6Forward Stepwise Regression 364Other Stepwise Procedures 367Influence on Inferences 405Some Final Comments 406Some Final Comments on AutomaticModel Selection Procedures 368Model Validation 36910.5 Multicollinearity Diagnostics-VarianceInflation Factor 406Collection of New Data to CheckModel 370Comparison with Theory, EmpiricalEvidence, or Simulation Results 371Data Splining 372Cited References 375Problems 376Exercise 380Projects 381Case Studies 382Chapter 10Building the Regression Model II:Diagnostics 384Informal Diagnostics 407Variance Inflation Factor 40810.6 Surgical Unit Example-Continued 410Cited References 414Problems 414Exercises 419Projects 419Case Studies 420Chapter 11Building the Regression Model III:Remedial Measures 42111.1Error Variances Known 422Error Variances Known up toProportionality Constant 424Error Variances Unknown 42410.1Model Adequacy for a PredictorVariable-Added-Variable Plots 38410.2 Identifying Outlying Y ObservationsStudentized Deleted Residuals 390Outlying Cases 390Residuals and SemistudentizedResiduals 392Hat Matrix 392Studentized Residuals 394Deleted Residuals 395Studentized Deleted Residuals 39610.3Identifying Outlying X Observations-HatMatrix Leverage Values 398Use of Hat Matrixfor Identifying OutlyingX Observations 398Use of Hat Matrix to Identify HiddenExtrapolation 40010.4 Identifying Influential Cases-DFFITS,Cook's Distance, and DFBETASMeasures 400Influence on Single FinedValue-DFFITS 401Influence on All Fined Values-Cook'sDistance 402Influence on the RegressionCoefficients-DFBETAS 404Unequal Error Variances RemedialMeasures-Weighted Least Squares 42111.2 Multicollinearity RemedialMeasures-Ridge Regression431Some Remedial Measures 431Ridge Regression 43211.3Remedial Measures for InfluentialCases-Robust Regression 437Robust Regression 438IRLS Robust Regression 43911.4 Nonparametric Regression: LowessMethod and Regression Trees 449Lowess Method 449Regression Trees 45311.5Remedial Measures for EvaluatingPrecision in NonstandardSituations-Bootstrapping 458General Procedure 459Bootstrap Sampling 459Bootstrap Confidence Intervals46011.6 Case Example-MNDOT TrafficEstimation - 464The MDT Database 464Model Development 465Weighted Least Squares Estimation 468
xviiiContentsCited References 471Problems 472Exercises 476Projects 476Case Studies 48013.2 Least Squares Estimation in NonlinearRegression 515Solution of Normal Equations 517Direct Numerical Search-Gauss-NewtonMethod 518Other Direct Search Procedures 525Chapter 1213.3 Model Building and Diagnostics 52613.4 Inferences about Nonlinear RegressionParameters 527Autocorrelation in TimeSeries Data 481Estimate of Error Term Variance 52';Large-Sample Theory 528IWhen Is Large-Sample TheoryApplicable? 528Interval Estimation of a Single Yk 531Simultaneous Interval Estimationof Several Yk 532Test Concerning a Single Yk 532Test Concerning Several Yk 53312.1 Problems of Autocorrelation 48112.2 First-Order Autoregressive ErrorModel 484Simple Linear Regression 484Multiple Regression 484Properties of Error Terms 48512.3 Durbin-Watson Test forAutocorrelation 48712.4 Remedial Measures forAutocorrelation 49013.5 Learning Curve Example 53313.6 Introduction to Neural NetworkModeling 537Addition of Predictor Variables 490Use of Transformed Variables 490Cochrane-Orcutt Procedure 492Hildreth-Lu Procedure 495First Differences Procedure 496Comparison of Three Methods 498Neural Network Model 537Network Representation 540Neural Network as Generalization of LinearRegression 541Parameter Estimation: Penalized LeastSquares 542Example: Ischemic Heart Disease 543Model Interpretation andPrediction 546Some Final Comments on Neural NetworkModeling 54712.5 Forecasting with Autocorrelated ErrorTerms 499Cited References 502Problems 502Exercises 507Projects 508Case Studies 508Cited References 547Problems 548Exercises 552Projects 552Case Studies 554PART THREENONLINEAR REGRESSION 509Chapter 13Chapter 14Introduction to Nonlinear Regressionand Neural Networks 51013.1Logistic Regression, Poisson Regression,and Generalized Linear Models 555Linear and Nonlinear RegressionModels 510Linear Regression Models 510Nonlinear Regression Models 511Estimation of Regression Parameters14.1514Regression Models with Binary ResponseVariable 555Meaning of Response Function whenOutcome Variable Is Binary 556
Contents xixSpecial Problems when Response VariableIs Binary 55714.2Sigmoidal Response Functionsfor Binary Responses 559Probit Mean Response Function 559Logistic Mean Response Function 560Complementary Log-Log ResponseFunction 56214.3Simple Logistic Regression14.10 Prediction of a New Observation 604Choice of Prediction Rule 604Validation of Prediction Error Rate 60714.11563Simple Logistic Regression Model 563Likelihood Function 564Maximum Likelihood Estimation 564Interpretation ofb 1 567Use of Probit and Complementary Log-LogResponse Functions 568Repeat Observations-BinomialOutcomes 56814.4Point Estimator 602Interval Estimation 602Simultaneous Confidence Intervals forSeveral Mean Responses 603Multiple Logistic RegressionPregnancy Duration Datawith Polytomous Response 609J - 1 Baseline-Category Ifgits forNominal Response 610Maximum Likelihood Estimation 61214.12 Polytomous Logistic Regressionfor Ordinal Response 61414.13 Poisson Regression 618570Poisson Distribution 618Poisson Regression Model 619Maximum Likelihood Estimation 620Model Development 620Inferences 621Multiple Logistic Regression Model 570Fitting of Model 571Polynomial Logistic Regression 57514.5Inferences about RegressionParameters 577Test Concerning a Single f3k: WaldTest 578Interval Estimation of a Single f3k 579Test whether Several f3k 0: LikelihoodRatio Test 58014.6Automatic Model SelectionMethods 582Model Selection Criteria 582Best Subsets Procedures 583Stepwise Model Selection 58314.7Tests for Goodness of Fit 586Pearson Chi-Square Goodnessof Fit Test 586Deviance Goodness of Fit Test 588Hosmer-Lemeshow Goodnessof Fit Test 58914.814.14 Generalized Linear ModelsCited References 624Problems 625Exercises 634Projects 635Case Studies 640DESIGN AND ANALYSIS OFSINGLE-FACTOR STUDIES 641Chapter 15Introduction to the Design ofExperimental and ObservationalStudies 64215.1Logistic Regression Diagnostics 59fInferences aboutMean Response 602623PART FOURLogistic Regression Residuals 591Diagnostic Residual Plots 594Detection of InfluentialObservations 59814.9Polytomous Logistic Regression forNominal Response 608Experimental Studies, ObservationalStudies, and Causation 643Experimental Studies 643Observational Studies 644Mixed Experimental and ObservationalStudies 64615.2Experimental Studies: BasicConcepts 647
XXContentsCell Means Model 681Important Features of Model 682The ANOVA Model Is a LinearModel 683Interpretation of Factor Level Means 6f.Distinction between ANOVA Models IandIl 685Factors 647Crossed and Nested Factors 648Treatments 649Choice of Treatments 649Experimental Units 652Sample Size and Replication 652Randomization 653Constrained Randomization:Blocking 655Measurements 65815.316.415.4Design of Observational Studies16.515.616.616.716.216.816.3F Test for Equality of Factor LevelMeans 698699Alternative Formulation of Model701Regression Approach to Single-FactorAnalysis of Variance 704Factor Effects Model with UnweightedMean 705Factor Effects Model with WeightedMean 709Cell Means Model 71016.9Randomization Tests 71216.10 Planning of Sample Sizes with PowerApproach 716677Single-Factor Experimental andObservational Studies 677Relation between Regression andAnalysis of Variance 679Illustrations 679Choice between Two Types ofModelsSingle-Factor ANOVA Model 681Basic Ideas 681693Factor Effects Model 701Definition of /-t. 702Test for Equality of Factor LevelMeans 704Chapter 1616.1690Test Statistic 698Distribution of F 699Construction of Decision Rule666Case Study: Paired-ComparisonExperiment 669Concluding Remarks 672Cited References 672Problems 672Exercise 676Single-Factor StudiesAnalysis of VariancePartitioning of SSTO 690Breakdown of Degrees of FreedomMean Squares 693Analysis of Variance Table 694Expected Mean Squares 694Cross-Sectional Studies 666Prospective Studies 667Retrospective Studies 667Matching 66815.5685Notation 686Least Squares and Maximum LikelihoodEstimators 687Residuals 689An Overview of Standard ExperimentalDesigns 658Completely Randomized Design 659Factorial Experiments 660Randomized Complete BlockDesigns 661Nested Designs 662Repeated Measures Designs 663Incomplete Block Designs 664Two-Level Factorial and FractionalFactorial Experiments 665Response Surface Experiments 666Fitting of ANOVA ModelPower of F Test 716Use of Table B.l2for Single-FactorStudies 718Some Further Observations on Useof Table B.l2 72068016.11Planning of Sample Sizes to Find "Best"Treatment 721Cited Reference 722
Contents17.8Problems 722Exercises 730Projects 730Case Studies 732Chapter 17Analysis of Factor Level Means 733Introduction 733Plots of Estimated Factor LevelMeans 735Line Plot 735Bar Graph and Main Effects Plot17.3736Estimation and Testing of Factor LevelMeans 737inferences for Single Factor LevelMean 737inferences for Difference between TwoFactor Level Means 739inferences for Contrast of Factor LevelMeans 74iinferences for Linear Combination ofFactor Level Means 74317.417.5Need for Simultaneous InferenceProcedures 744Tukey Multiple ComparisonProcedure 746Studentized Range Distribution 746Simultaneous Estimation 747Simultaneous Testing 747Example i-Equal Sample Sizes 748Example 2-lJ.nequal Sample Sizes 75017.6Scheffe Multiple ComparisonProcedure 753Simultaneous Estimation 753Simultaneous Testing 754Comparison ofScheffe and TukeyProcedures 75517.7Planning of Sample Sizes with EstimationApproach 759Example i-Equal Sample Sizes 759Example 2-Unequal Sample Sizes 76i17.917.117.2xxiChapter 18ANOVA Diagnostics and Remedi!lMeasures 77518.1Residual Analysis775Residuals 776Residual Plots 776Diagnosis of Departures from ANOVAModel 77818.2Tests for Constancy of ErrorVariance 781Hartley Test 782Brown-Forsythe Test18.318.418.5784Overview of Remedial MeasuresWeighted Least Squares 786Transformations of ResponseVariable 789786Simple Guides to Finding aTransformation 789Box-Cox Procedure 79i18.6Effects of Departures from ModelNonnormality 793Unequal Error Variances 794Nonindependence of Error Terms18.7793794Nonparametric Rank F Test 795Test Procedure 795Multiple Pairwise TestingProcedure 797Bonferroni Multiple ComparisonProcedure 756Simultaneous Estimation 756Simultaneous Testing 756Comparison of Bonferroni Procedure withScheffe and Tukey Procedures 757Analysis of Means 758Analysis of Factor Effects when FactorIs Quantitative 762Cited References 766Problems 767Exercises 773Projects 774Case Studies 77418.8Case Example-Heart Transplant 798Cited References 801Problems 801Exercises 807Projects 807Case Studies 809
xxii ContentsPART FIVEMULTI-FACTOR STUDIES19.6F Tests 843Test for Interactions 844Test for Factor A Main Effects 844Testfor Factor B Main Effects 845Kimballinequality 84619.719.8Strategy for Analysis 847Analysis of Factor Effects when FactorsDo Not Interact 848811Chapter 19Two-Factor Studies with EqualSample Sizes 81219.1Two-Factor Observational andExperimental Studies 812Estimation of Factor Level Mean 848Estimation of Contrast of Factor LevelMeans 849Estimation of Linear Combination ofFactor Level Means 850Multiple Pairwise Comparisons of FactorLevel Means 850Multiple Contrasts of Factor LevelMeans 852Estimates Based on TreatmentMeans 853Example I-Pairwise Comparisonsof Factor Level Means 853Example 2-Estimation of TreatmentMeans 855Examples of Two-Factor Experiments andObservational Studies 812The One-Factor-at-a-Time (OFAAT)Approach to Experimentation 815Advantages of Crossed, Multi-FactorDesigns 81619.2Meaning of ANOVA ModelElements 817Illustration 817Treatment Means 817Factor Level Means 818Main Effects 818Additive Factor Effects 819Interacting Factor Effects 822Important and UnimportantInteractions 824Transformable and NontransformableInteractions 826Interpretation of Interactions 82719.3Model I (Fixed Factor Levels) for1Wo-Factor Studies 829Cell Means Model 830Factor Effects Model 83119.4Analysis of Variance833Illustration 833Notation 834Fitting of ANOVA Model 834Partitioning of Total Sumof Squares 836Partitioning of Degrees of FreedomMean Squares 839Expected Mean Squares 840Analysis of Variance Table 84019.5Evaluation of Appropriateness ofANOVA Model 84219.9Analysis of Factor Effects whenInteractions Are Important 856Multiple Pairwise Comparisonsof Treatment Means 856Multiple Contrasts of TreatmentMeans 857Example I-Pairwise Comparisonsof Treatment Means 857Example 2-Contrasts of TreatmentMeans 86019.10 Pooling Sums of Squares in Two-FactorAnalysis of Variance 86119.11 Planning of Sample Sizes for Two-FactorStudies 862839Power Approach 862Estimation Approach 863Finding the "Best" Treatment 864Problems 864Exercises 876Projects 876Case Studies 879
Contents21.821.9Chapter 20Two-Factor Studies-One Caseper Treatment 88020.1No-Interaction ModelModel 881Analysis of Variance 881Inference Procedures 881Estimation of Treatment Mean20.2Tukey Test for Additivity884886Oted Reference 889Problems 889Exercises 891Case Study 891Chapter 22Analysis of Covariance 91722.122.221.3Elements of Randomized Complete BlockDesigns 89221.421.621.7Analysis of Treatment Effects 904Use of More than One BlockingVariable 905Use of More than One Replicate in EachBlock 906Single-Factor Covariance Model 920Example of Single-Factor CovarianceAnalysis 926Development of Model 926Testfor Treatment Effects 928Estimation of Treatment Effects 930Testfor Parallel Slopes 93222.4Two-Factor Covariance Analysis93,3Covariance Modelfor Two-FactorStudies 933Regression Approach 934Covariance Analysis for RandomizedComplete Block Designs 937Evaluation of Appropriatenessof Randomized Complete BlockModel 901Diagnostic Plots 901Tukey Test for Additivity 90321.522.3Model for Randomized Complete BlockDesigns 897Analysis of Vrujance and Tests 898Fitting of Randomized CompleteBlock Model 898Analysis of Variance 898917Notation 921Development of Covariance Model 921Properties of Covariance Model 922Generalizations of CovarianceModel 923Regression Formula of CovarianceModel 924Appropriateness of CovarianceModel 925Inferences of Interest 925Randomized Complete BlockDesigns 892Description of Designs 892Criteria for Blocking 893Advantages and Disadvantages 894How to Randomize 895Illustration 895Basic IdeasHow Covariance Analysis Reduces ErrorVariability 917LConcomitant Variables 919Chapter 2121.2911Problems 912Exercises 916Development of Test Statistic 886Remedial Actions if Interaction EffectsAre Present 88821.1Factorial Treatments 908Planning Randomized Complete BlockExperiments 909Power Approach 909Estimation Approach 910Efficiency of Blocking Variable880xxiii22.5.Additional Considerations for the Useof Covariance Analysis 939Covariance Analysis as Alternativeto Blocking 939Use of Differences 939Correction for Bias 940I
xxivContentsInterest in Nature of TreatmentEffects 940Chapter 24Multi-Factor Studies 992Problems 941Exercise 947Projects 947Case Studies 95024.1Notation 992Illustration 993Main Effects 993Two-Factor Interactions 995Three-Factor Interactions 996Cell Means Model 996Factor Effects Model 997Chapter 23Two-Factor Studies with UnequalSample Sizes 95123.1Unequal Sample SizesNotation23.295195224.2Use of Regression Approach for TestingFactor Effects when Sample Sizes AreUnequal 953Inferences about Factor Effects whenSample Sizes Are Unequal 959Example I-Pairwise Comparisonsof Factor Level Means 962Example 2-Single-Degree-of-FreedomTest 96423.4Empty Cells in Two-Factor Studies23.524.3ANOVA Inferences when TreatmentMeans Are of Unequal Importance 97024.4Statistical Computing PackagesProblems 981Exercises 988Projects 988Case Studies 9909801003Analysis of Variance1008Partitioning of Total Sum of SquaresDegrees of Freedom and MeanSquares 1009Testsfor Factor Effects 100924.5Analysis of Factor Effects10081013Strategy for Analysis 1013Analysis of Factor Effects when Factors DoNot Interact 1014Analysis of Factor Effects with MultipleTwo-Factor Interactions or Three-FactorInteraction 1016Analysis of Factor Effects with SingleTwo-Factor Interaction 1016Example-Estimation of Contrastsof Treatment Means 1018Estimation of Treatment Means and FactorEffects 971Test for Interactions 972Tests for Factor Main Effects by Useof Equivalent Regression Models 972Testsfor Factor Main Effects by UseofMatrix Formulation 975Tests for Factor Effects when Weights AreProportional to Sample Sizes 97723.6Fitting of ANOVA ModelNotation 1003Fitting ofANOVA Model 1003Evaluation ofAppropriateness Qf ANOVAModel 1005964Partial Analysis of Factor Effects 965Analysis if Model with No Interactions CanBe Employed 966Missing Observations in RandomizedComplete Block Designs 967Interpretation of Interactionsin Three-Factor Studies 998Learning Time Example 1: Interpretationof Three-Factor Interactions 998Learning Time Example 2: Interpretationof Multiple Two-Factor Interactions 999Learning Time Example 3: Interpretationof a Single Two-Factor Interaction 1000Regression Approach to Two-FactorAnalysis of Variance 95323.3ANOVA Model for Three-FactorStudies 99224.6Unequal Sample Sizes in Multi-FactorStudies 1019Testsfor Factor Effects 1019Inferences for Contrasts of Factor LevelMeans 1020
Contents xxv24.7Planning of Sample Sizes25.61021Power ofF Test for Multi-FactorStudies 102 IUse of Table B.I2for Multi-FactorStudies 1021Three-Factor Studies-ANOVAModels II and III 1066ANOVA Model II-Random FactorEffects 1066ANOVA Model III-Mixed FactorEffects 1066Appropriate Test Statistics 1067Estimation of Effects 1069Cited Reference 1022Problems 1022Exercises 1027Projects 1027Case Studies 102825.7ANOVA Models II and III with UnequalSample Sizes 1070Maximum Likelihood ApproachChapter 25Random and Mixed Effects Models25.11030Single-Factor Studies--ANOVAModel II 1031Random Cell Means Model 1031Questions of Interest 1034Test whether a; 0 1035Estimation of fJ. 1038Estimation of a;/ (a; ( 2
Applied Linear Statistical Models Fifth Applied Linear Statistical Models Fifth Edition Michael H. Kutner EmOlY University Christopher J. Nachtsheim University of Minnesota John Neter University of Georgia William Li Universlty of Minnesota wa McGraw-Hili t:a Irwin
