Transcription
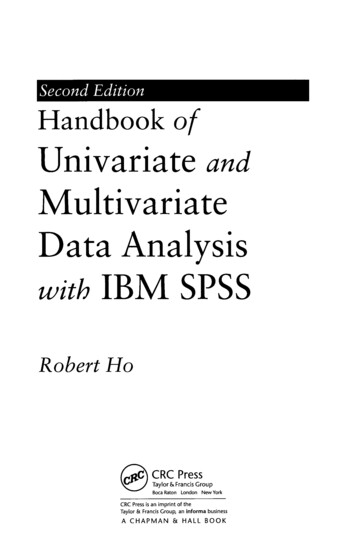
Second EditionHandbookofUnivariate andMultivariateDataAnalysisSPSSwith IBMRobert HoCRC PressTaylor & Francis GroupBoca RatonCRC Press isTaylorAanimprintCroup,& FrancisCHAPMAN&LondonNew Yorkof theaninforma businessHALLBOOK
ContentsPrefaceAuthorxixBioxxiii1. Inferential Statistics and Test Selection11.1Introduction1.2Inferential Statistics11.2.1Hypothesis TestingTypes of ing HypothesesLevel of Significance21.2.2.2Null3Type I and Type II Errors1.2.5.1Calculating Type41.2.21.2.31.2.41.2.51.31234I Error5Test Selection1.3.1Test of1.3.21.3.36The Nature of Hypotheses: Test of Differenceversus6Relationship1.3.1.1Test of Difference61.3.1.2Test of7RelationshipLevels of Measurement71.3.2.1Nominal Scale71.3.2.2Ordinal Scale81.3.2.3Interval Scale81.3.2.4Ratio Scale8Choice of Test92. Introduction to SPSS2.12.22.311Introduction11Data FileSetting Up a2.2.1Preparing2.2.2Data debook1313anSPSS Data File1316EntryandEditingthe Data FileWindows MethodAnalysis:SyntaxSPSS Analysis: Windows Method2.3.2SPSS2.3.3SPSS2.3.4Results andAnalysis: 192122v
Contentsvi2.4Missing2.4.12.4.22.4.324Test for Patterns in2.4.1.2Windows 5InterpretationMissingDataMethod29Data30Windows Method302.4.3.2SPSS32Handling MissingSyntaxMethodImputed32Data Set33333.1Aim3.2Methods of MULT RESPONSE Procedures3.3Example3.5r292.4.3.1Multiple Response3.42427Dealing with Missing DataExample of the Expectation-Maximization ns ofof theMultiple-DichotomyEntry FormatMethod3334343.3.1Data3.3.2Windows ts andExampleof 383.4.1Windows Method393.4.2SPSS413.4.3Syntax MethodSPSS Output3.4.4Results ws ts andTest forMethodInterpretationIndependent Groups4.1Aim4.2Checklist 524.4.1Data4.4.2Testing y4.4.2.3FormatHomogeneity of Variance5252525257
Contents5.vii4.4.3Windows Method: .4.6Results and585959Interpretation61Paired-Samples t Test635.1Aim635.2Checklist ta5.4.2Testing Assumption645.4.2.1Normality645.4.2.2Windows 4Method5.4.4Output5.4.2.5InterpretationWindows Method: Paired-Samples tSPSS Syntax Method5.4.5SPSS5.4.6Results and5.4.36.t TestMethod6769TestOutputInterpretationOne-Way Analysis of Variance, with Post Hoc Comparisons69707171736.1Aim736.2Checklist of .4.3Entry FormatTesting Assumptions6.4.2.1Normality6.4.2.2Homogeneity of VarianceWindows Method: One-Way ANOVA6.4.4SPSSSyntax806.4.5SPSSOutput6.4.6Results and826.4.7Post Hoc826.4.27. nComparisonsof Variance837.1Aim837.2Checklist -Way FactorialDataEntry Format83(2x2 Factorial)8484
Contentsviii7.4.284Testing eityIndependenceof Variance87877.4.3Windows Method: Factorial utResults and Interpretation7.4.6.1Main Effect7.4.6.2Interaction Effect7.4.7Post Hoc Test for7.4.8Data s Method7.4.8.2Post Hoc7.4.8.3Post Hoc93Comparisons:Comparisons:Windows 10 Results and InterpretationExample 2: Three-Way Factorial (2x2x2 Factorial)7.5.1Data Entry Format991001017.5.2Windows putResults and Interpretation7.5.5.17.5.5.27.5.67.5.7104107Main k Interaction7.5.6.1Windows t7.5.7.1Shock8. General Linear sis8.1Aim1158.2Checklist of Requirements1158.3Assumptions8.4Example1161: GLM Multivariate8.4.1Data8.4.2Testing Assumptions8.4.3Analysis: .4.2.3Homogeneity8.4.2.4Normality116117Entry Format117of Observations117119of Covariance MatricesWindows Method: GLM Multivariate121121Analysis125
lxContents8.58.68.4.4SPSSSyntax Method1288.4.5SPSSOutput1288.4.6Results g Assumptions8.5.3Windows Method: GLM Multivariate131Analysis:Two-Sample Test1318.5.4SPSS Syntax Method1338.5.5SPSS1338.5.6Results andExample 3:Output136Interpretation137Entry FormatData8.6.2Testing Assumptions8.6.3Windows Method: GLM: 2x2x4 s and8.6.7Windows Method (Profile Plot)8.6.8SPSS8.6.10136GLM: 2x2x4 Factorial Design8.6.18.6.99.InterpretationAnalysis: Two-Sample Test2: GLM (ProHle Plot)Results and InterpretationWindows Method (Data Data Transformation1488.6.10.2Post Hoc1508.6.11SPSS8.6.12Results andComparisons152OutputInterpretationGeneral Linear sumptionExample 1: GLM: One-Way Repeated9.3.1Data Entry Format1559.39.3.2Windows Method9.3.3SPSSSyntax9.3.4SPSSOutput9.3.5Choosing Tests of156156156Method160160SignificanceResults andInterpretationExample 2: GLM: Two-Way Repeated Measures (DoublyMultivariate Repeated Measures)9.3.69.4MeasuresEntry Format9.4.1Data9.4.2Windows Method9.4.3SPSSSyntax9.4.4SPSS9.4.5Results 175
ContentsX9.5Example 3: GLM: Two-Factor Mixed Design (One BetweenGroups Variable and One Within-Subjects Variable)9.5.1Data Entry Format1779.5.2Windows ults and9.5.5.19.5.5.29.6Example 4:Method184InterpretationWithin-Subjects EffectsBetween-GroupsEffectsGLM: Three-Factor MixedGroups Variablesand OneEntryDesign (Two Between-Within-Subjects Variable)10.49.6.2Windows Method1929.6.3SPSS2009.6.4SPSS9.6.5Results tsAssumptions220Example10.4.22201: Pearson Product Moment Correlation Coefficient. 220DataEntry FormatTesting Assumptions10.4.2.1Windows Method10.4.2.2 SPSS10.4.3Syntax terpretation224Windows Method: Pearson Product 92Format10. 110.1178SPSS224Method: Pearson Product ts nce between Two Correlation227Coefficients Obtained from Two227Example2292:SamplesSpearman Rank Order Correlation Coefficient10.6.1Windows Method10.6.2SPSS10.6.3SPSS10.6.4Results andMethodSyntaxOutputInterpretation230231232232
Contentsxi11. s Method23411.4.2SPSS23611.4.311.4.4Syntax MethodSPSSOutputResults and Interpretation12. 37Strengthof the Prediction238anIndependent Relationship239AnalysisAim23912.1.1Computation of the12.1.2Extraction of Initial Factors12.1.2.112.1.2.2Correlation MatrixDeterminingExtracted24012.1.4Rotation Methods12.1.5Orthogonal (Varimax)242242versusNonorthogonal(Oblique) 324412.2Checklist of12.3Assumptions12.3.1 Key Statistical Assumptions12.3.2 Key Conceptual AssumptionsFactor Analysis: Example 112.4.1 Data Entry Format12.4.2 Testing Assumptions12.4240the Number of Factors to BeRotation of Extracted FactorsNumber of Factor240240Method of ificantCorrelations in DataMatrix24712.4.3Windows Method: Factor Analysis24712.4.4SPSS25012.4.5SPSS12.4.6Results andMethod: FactorSyntaxOutput12.4.6.1(First Run)Analysis (First Run)251InterpretationCorrelation Matrix12.4.6.2 FactorAnalysis Output254254255
Contents12.4.6.3Determiningthe Number of FactorsVelicer's MinimumTest and licer's Minimum12.4.6.5 ParallelAverageAveragePartial(MAP)Test. 256Analysis12.4.7Windows Method12.4.8SPSSSyntax12.4.9SPSSOutput259(Second Run)(Second Run)262Method26426412.4.10 Results and265Factor26612.5.112.5.2InterpretationAnalysis: Example 2Data Entry FormatWindows Method: Factor Analysis (First Run)12.5.3SPSSSyntaxMethod: Factor12.5.4SPSSOutput12.5.5Results andAnalysis (First on Matrix27412.5.5.2Factor27512.5.5.3Analysis OutputDeterminingthe Number of FactorsUsingVelicer's MinimumTest andAverage Partial (MAP)Parallel Analysis12.5.5.4 Velicer's Minimum(MAP) Test12.5.5.5 Parallel13.13.214.275Analysis27812.5.6Windows Method12.5.7SPSS28312.5.8(Second Run)Syntax Method (Second Run)SPSS Output28112.5.9Results and286InterpretationReliability13.1275Average 2.1Windows Method28813.2.2SPSSSyntax Method29013.2.3SPSSOutput29113.2.4Results andConsistencyConsistencyExample: 7288291Multiple Regression29314.1Aim29314.2Multiple Regression Techniques14.2.1Standard Multiple Regression14.2.2 Hierarchical Multiple Regression14.2.3 Statistical (Stepwise) Regression293293294294
Contentsxiii14.3Checklist of rity29614.5.114.6Checking for MulticollinearityExample 1: Prediction Equation and Identification297ofIndependent Relationships (Forward Entry of PredictorVariables)14.6.1 Data Entry Format29714.6.2Windows Method:29814.6.3Testing AssumptionsWindows Method: Multiple Regression—Predicting the Level of Responsibility from the14.6.4Three DefenseComputationof FactorsStrategies of PROVOKE, SELFDEF, and300SPSS30414.6.6Syntax MethodSPSS Output14.6.7Results and30714.6.7.1307304InterpretationTesting Assumptions14.6.7.2 Prediction Equation (Predicting the LevelResponsibility from the Three DefenseStrategies PROVOKE, SELFDEF,and307INSANITY)14.6.7.3Evaluating the Strength of the Prediction14.6.7.4EquationIdentifying MulticollinearityIdentifying Independent 298Example 2:Hierarchical308308308310Regression14.7.1Windows Method31114.7.2SPSS31314.7.3SPSS14.7.4Results andExample is31714.8.1Windows Results andExample4: PathMethod322InterpretationAnalysis—Test of Significance of theMediation14.9.2HypothesisBootstrappingSteps in Testing the14.9.3SPSS14.9.4Results etation14.9.4.1 Total Indirect Effect14.9.4.2Indirect EffectsSpecific14.9.4.3Pairwise Contrast of Indirect Effects329332332332332333
xiv15.ContentsMultiple Discriminant Analysis33515.1Aim33515.2Checklist of15.3AssumptionsExample 1: ata15.4.2Testing ate15.4.2.2Linearity338Normality34334615.4.2.4 Multivariate of 7DiscriminantAnalysisWindows Method15.4.3.2 SPSSSyntax15.4.3.3OutputSPSSMethod15.4.3.4 Results and InterpretationExample 2: Three-Group Discriminant Analysis15.5.1 Three-Group Discriminant Analysis15.5.1.1Windows .5.1.4 Results and Interpretation15.5.1.5 Evaluating Group Differences36915.5.1.6 Windows Method37515.5.1.7 SPSS37715.5.1.2 SPSS15.5.1.3 SPSS16.33815.4.2.3 Univariate Outliers15.4.2.615.4.3337Syntax Method369374375Logistic Regression38316.1Aim38316.2Checklist of16.3AssumptionsExample: Two-Group Logistic Regression38416.4.1Windows Method38516.4.2SPSS38716.4.3SPSS Output16.4.4Results 387InterpretationModelEstimationAssessingOverall Model Fit16.4.4.3 Classification Matrix16.4.4.4 Test of389389390391Relationships and Strengths amongthe Variables16.4.4.5384InterpretingOdds Ratios391391
Contentsxv16.4.4.6 Predictionsonthe Basis of ProbabilitiesfromLogistic Regression CoefficientsSummary of Probability Findings16.4.4.717. Canonical t ofRequirementsAssumptionsKey Terms in Canonical Correlation Analysis396An39817.317.417.5Example of Canonical Correlation Analysis17.5.1 DataEntry Format17.5.2 Testing malityof Canonical Correlation Analysis40240641317.5.3.1Windows Method41317.5.3.2SPSS41317.5.3.3Syntax MethodSPSS Output17.5.3.4 Results and18. Structural396Interpretation414416421Equation Modeling18.1What Is Structural42118.2The Role of42318.3The Structural18.4Goodness-of-Fit CriteriaEquation Modeling (SEM)?Theory in SEM18.642418.4.2Incremental Fit Measures42618.4.3Parsimonious Fit Measures42618.4.4Note of Caution in the Use of Incremental Fitas"Rules of Thumb"Model AssessmentImproving42918.6.1Modification Indices42918.6.2Correlated Errors42918.8Checklist of18.8.118.11427428Model FitProblems with Estimation18.10424Absolute Fit Measures18.718.942318.4.1Indices18.5Equation Model430Requirements431Item Parcels432AssumptionsExamples of Structural Equation ModelingExample1: Linear18.11.1 Data18.11.218.11.3RegressionFormatwith Observed VariablesEntryModeling in AMOS GraphicsResults and Interpretation433433434435435437
xviContents18.11.3.1Regression Weights, StandardizedRegression Weights, and Squared MultipleCorrelations18.12Example 2: Regression with18.12.1 Results and438Unobserved(Latent) Variables442Interpretation18.12.1.1 Regression440StandardizedWeights,Regression Weights, and Squared MultipleCorrelations18.12.1.218.13Example 3:Comparing443the Latent-Construct Model(Example 2) with the Observed-MeasurementModel (Example 1)445Multi-Model Path Analysis with Latent Variables.44618.13.1 Evaluation of the Measurement Model:Confirmatory18.13.2 Results andFactor446Analysis (CFA)Interpretation44818.13.2.1and StandardizedRegression WeightsRegression WeightsExplained Variances and Residual44918.13.2.2Variances45018.13.2.3 Modification Indices45018.13.3 The Modified Model18.13.4Comparingthe452Original (Default) Model against theModified Model18.13.5 Multi-Model45318.13.5.1 Defining the Direct and Indirect Models456Example18.14.1the Direct PathModel versus the Indirect Path Model18.13.5.218.14452Analysis: Evaluation ofResultsandInterpretion4:Multi-Group AnalysisMulti-Group Confirmatory Factor Analysis18.14.1.1 Conducting Multi-Group Modeling for458463463Males and Females: The lti-Group18.14.2.1Conducting Multi-Group Modeling for478Males and Females: The Path Model479Results and490Path18.14.2.218.1546418.14.1.2 Results andExample 5:AnalysisSecond-Order49918.15.1 Results and18.15.1.1InterpretationConfirmatory Factor (CFA)InterpretationRegression Weights and StandardizedRegression Weights50050018.15.1.2 Explained Variances and ResidualVariances18.15.1.3 Modification Indices502502
Contents19.xviiNonparametric Tests19.1Aim19.2Chi-Square (x2)19.2.119.2.219.2.319.319.419.519.6507Test forSingleVariableExperiments508AssumptionsExample 1: Equal Expected Frequencies19.2.2.1 Data Entry Format50819.2.2.2Windows Method50919.2.2.3SPSS510MethodSyntax50850819.2.2.4 SPSS Output51019.2.2.5510Results and2:ExampleInterpretationUnequal Expected Frequencies51019.2.3.1Windows Method51119.2.3.2SPSS51219.2.3.3SPSS Output51319.2.3.4Results and513MethodSyntaxInterpretationChi-Square (x2) Test of Independence between Two Variables. 51319.3.1 Assumptions51419.3.2Windows Method51419.3.3SPSS51619.3.4SPSS51619.3.5Results and517MethodSyntaxOutputInterpretationMann-Whitney U Test for Two Independent Samples19.4.1 Assumptions51851819.4.2Data19.4.3Windows Method51919.4.4SPSSSyntax Method19.4.5 SPSS Output19.4.6 Results and InterpretationKruskal-Wallis Test for Several Independent indows s ntrySignedFormat518FormatMethod521521521524525Rank Test for Two RelatedSamples52552519.6.2AssumptionsData Entry Format19.6.3Windows Results andMethod19.7.2527527InterpretationFriedman Test for Several Related19.7.1526AssumptionData Entry FormatSamples527528528
Contentsxviii19.7.3Windows s andAppendix: Summary ofMethod528529530Interpretation530Syntax Files531SPSSBibliography543Index547
X Contents 9.5 Example3: GLM:Two-FactorMixedDesign(OneBetween- GroupsVariableandOneWithin-Subjects Variable) 177 9.5.1 DataEntryFormat 178 9.5.2 WindowsMethod 179 9.5.3 SPSSSyntaxMethod 184 9.5.4 SPSSOutput 184 9.5.5 Results andInterpretation 188 9.5.5.1 Within-SubjectsEffects 188 9.5.5.2 Between-Groups Effects 190 9.6 Example4: GLM:Three-FactorMixedDesign(TwoBetween- .
