Transcription
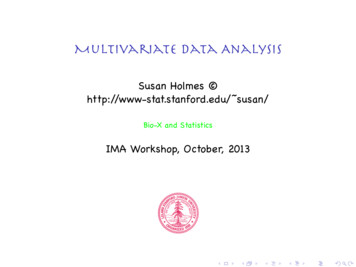
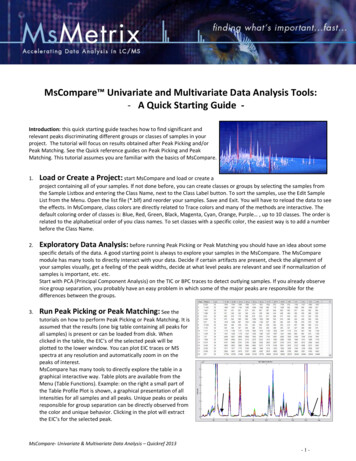
MsCompare Univariate and Multivariate Data Analysis Tools:- A Quick Starting Guide Introduction: this quick starting guide teaches how to find significant andrelevant peaks discriminating different groups or classes of samples in yourproject. The tutorial will focus on results obtained after Peak Picking and/orPeak Matching. See the Quick reference guides on Peak Picking and PeakMatching. This tutorial assumes you are familiar with the basics of MsCompare.1.Load or Create a Project: start MsCompare and load or create aproject containing all of your samples. If not done before, you can create classes or groups by selecting the samples fromthe Sample Listbox and entering the Class Name, next to the Class Label button. To sort the samples, use the Edit SampleList from the Menu. Open the list file (*.blf) and reorder your samples. Save and Exit. You will have to reload the data to seethe effects. In MsCompare, class colors are directly related to Trace colors and many of the methods are interactive. Thedefault coloring order of classes is: Blue, Red, Green, Black, Magenta, Cyan, Orange, Purple , up to 10 classes. The order isrelated to the alphabetical order of you class names. To set classes with a specific color, the easiest way is to add a numberbefore the Class Name.2.Exploratory Data Analysis: before running Peak Picking or Peak Matching you should have an idea about somespecific details of the data. A good starting point is always to explore your samples in the MsCompare. The MsComparemodule has many tools to directly interact with your data. Decide if certain artifacts are present, check the alignment ofyour samples visually, get a feeling of the peak widths, decide at what level peaks are relevant and see if normalization ofsamples is important, etc. etc.Start with PCA (Principal Component Analysis) on the TIC or BPC traces to detect outlying samples. If you already observenice group separation, you probably have an easy problem in which some of the major peaks are responsible for thedifferences between the groups.3.Run Peak Picking or Peak Matching: See thetutorials on how to perform Peak Picking or Peak Matching. It isassumed that the results (one big table containing all peaks forall samples) is present or can be loaded from disk. Whenclicked in the table, the EIC’s of the selected peak will beplotted to the lower window. You can plot EIC traces or MSspectra at any resolution and automatically zoom in on thepeaks of interest.MsCompare has many tools to directly explore the table in agraphical interactive way. Table plots are available from theMenu (Table Functions). Example: on the right a small part ofthe Table Profile Plot is shown, a graphical presentation of allintensities for all samples and all peaks. Unique peaks or peaksresponsible for group separation can be directly observed fromthe color and unique behavior. Clicking in the plot will extractthe EIC’s for the selected peak.MsCompare- Univariate & Multivariate Data Analysis – Quickref 2013-1-
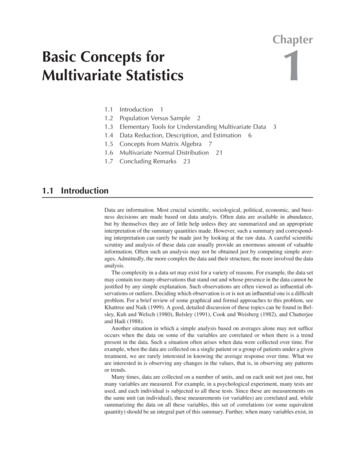
4.Run PCA on the Table:5.Multivariate Analysis Tools: Two-Class or Multi-Class Problems:start exploring the table byrunning PCA on the peak list (optionally decide on scaling,normalization etc.). PCA is an unsupervised multivariatetechnique. It does not specifically search for groupings. The scoreplot on the right already shows a very nice separation, but inmore difficult problems this will not be the case. You can checkthe loading plot to see which peaks are responsible, but is not avery easy task. Often you will only see large peaks sticking out inthe loading plot and probably you will check no more than 2principal components. Even auto-scaling, making all peaksequally important, is often not very easy (see loading plot on theright).the Multivariate Tools in MsCompare consist of: PCA, PLS-DA, ECVA and Hierarchical Clustering. Clustering and PCA are socalled unsupervised techniques; they do not use class information to find the solution. PLS and ECVA are supervisedtechniques, these explicitly use the class information to find the solution (regression).MsCompare distinguishes two type of problems, related to the setup of the study: 2-Classes: you can use the supervisedtechnique PLS-DA (Partial Least Squares Regression) or ECVA for problems consisting of two groups.Multi Classes: use ECVA (Extended Canonical Variate Analysis), a powerful new technique combining PLS and LinearDiscriminant Analysis. From the score plot try to find directions that separate the classes. Then look at the loading plot inthe same directions to find the discriminating peaks. Again, often the large peaks stick out in the loading plot.6.Univariate Analysis Tools for finding Discriminating Peaks:Multivariate techniques in general are variance based, which means that the focus is on the large peaks in your data.Furthermore, it is expected that peaks are highly correlated. In many LC/MS and GC/MS studies the interesting peaks willbe very small and the correlation structure with other peaks in your data is missing. In these situations, almost allmultivariate techniques will fail, or the interpretation will be very difficult.We have seen in many studies, that univariate techniques often outperform the multivariate techniques because of thereasons mentioned above. MsCompare has powerful univariate statistics to find your discriminating peaks. We make adistinction between 2-class projects and multi-class projects.Univariate Statistics – 2 Classes: in MsCompare select from the Menu: Biomarker/Stats Set Selectivity Rules. Youwill have to decide which group is expected to contain the up-regulated peaks (some statistics use ratios). Select the optionaccording to the class setup. MsCompare has 7 different statistics for finding discriminating peaks: ratio, t-test, p-test,uniqueness, full selectivity, % up-regulated and Fisher Discriminant Score. You can create plots for any of the selectedstatistics. The plots are interactive, click on a peak and the EIC’s or the Profile plots will be generated.- Ratio Test: will calculate the ratio’s between the group means or group medians. In one plot you can see both up- anddown-regulated peaks.- Uniqueness Test: calculates a value between 100 and -100. The value 100 means unique and up-regulated, -100 meansunique and down-regulated. A value of zero means that the group means are equal.- Full Selectivity Test: checks which peaks are larger in one group compared to the other group (must be true for all samplesMsCompare- Univariate & Multivariate Data Analysis – Quickref 2013-2-
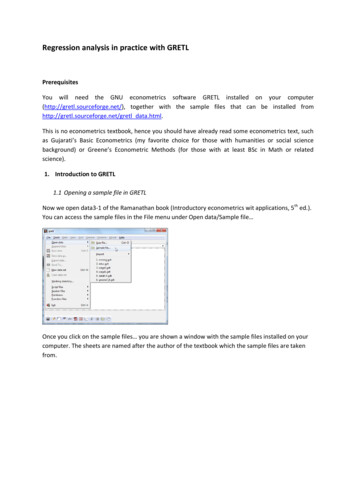
in the group). The Full Selectivity has a value of 1 or 0.- Percent Up-Regulated Test: counts the number of upregulated samples in your active group, compared to the othergroup , e.g. for 10 samples in group A, a value of 80% meansthat for a certain peak, 8 samples are larger and 2 smallercompared to the other group.- Fisher Discriminant Score: this statistics calculates a valuewhich expresses the difference between the group mean andat the same time takes into account the standard deviationwithin each group. High values ( 5) have clear separationpower and not much spread.The plot on the right displays part of the ratio graph (lower).Clicking on a peak number will extract the EIC’s (top). You canfilter (and sort) the full table based on any of the calculatedstatistics, e.g. keep all peaks in the table having a ratio valuelarger than 3.0. The above procedure is applicable to multi-group problems too. However, you then should build data setscontaining only two groups from the full data set, which is more work.All Statistics Overview: by selecting this option, you can calculate all thestatistics directly. The output will be a table with the calculated statistics forall peaks. Up- and down-regulated peaks will be marked in color. Bluemeans up-regulated, red means down-regulated. You will have the optionto view all peaks or only peaks that are up- or down-regulated. Optionallythe full table can be filtered on these peaks. The Overview Table isinteractive; clicking an entry will plot the EIC’s in MsCompare.Before the table is generated you will have to decide what is a relevantthreshold regarding each of the statistical tests. If any of the tests is positivethe peak will pop-up in the table. To use only one type of statistics, clear allother thresholds.Attention: the combined results include peaks that pass the test for any ofthe individual tests. The test color (up/down) is based on the threshold. Toonly view peaks that have e.g. a Fisher value 5, clear all other thresholds.Univariate Statistics – More than 2 Classes: MsCompare contains three types of overviews in situations that youhave more than 2 classes in your project. One of the tests is the PairWise Ratio Test. It will calculate the ratios between allcombinations of classes, e.g. for 4 classes A,B,C and D it will calculate ratios between classes A-B, A-C, A-D, B-C, B-D and C-D.MsCompare- Univariate & Multivariate Data Analysis – Quickref 2013-3-
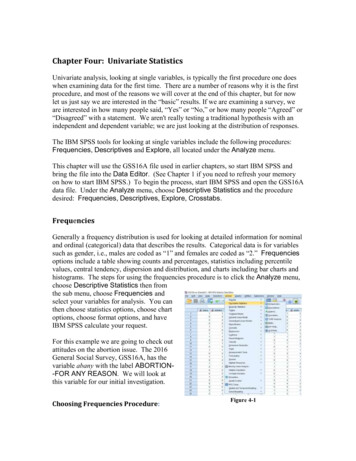
There is no restriction to the number of classes, but the output grows fast. The same test is available for Fisher DiscriminantScores; the PairWise Fisher Test. Again, the output is a interactive table containing the test result for the different groups.You can filter the original table so that only up-or down regulated peaks will be left.Attention: Please don’t use long class names to keep the output compact. Below and example is given for 4 classes: B1, L1,F1 and R1. The peak with number 609 is explored in more detail. For Class F1/L1 this peak is up-regulated and downregulated when comparing the classes: B1/F1, B1/R1 and L1/R1.The last Multi Class Overview Statistic is a so-called Multi Class Ratio Plot using a Reference Class. It will calculate the ratiosfor selected peaks for all groups against a fixed reference group. In the case of 4 classes and class B as the reference class,the following ratios will be calculated. A/B, C/B and D/B. You will be able to specify the reference group. The output will bean interactive table listing the group ratios and a graph of the group ratios for the selected peaks. See the example below.Four peaks were selected. Class B1 was the Reference Group. The plot shows ratios for the selected peaks between classesF1/B1, L1/B1 and R1/B1. This plot is very useful in situations where you have multiple classes and one reference group e.g.a group of controls.7.If the Problem is Really Multivariate and Peaks are small:If the solution lies in small peak that have no correlation with larger peaks and these small peaks are not unique or up- ordown-regulated, than the multivariate techniques will probably fail, but univariate methods will fail too.In the example below a scatter plot of two small peaks P1 and P2 is shown for a two class situation. No single peak is able todiscriminate between the classes, but together they are very discriminative. This is the “real multivariate” power,combining more than a single peak. However, the two peaks are not correlated with the majority of the large peaks in thedata set, so they will probably not be detected by PCA or PLS-DA, at least not in the main principal components.MsCompare- Univariate & Multivariate Data Analysis – Quickref 2013-4-
P2P1How to proceed? In these cases, use the new Genetic Optimization Algorithms to solve the problem. It will search forcombinations (2-10) of peaks able to differentiate between the classes. For many peaks, it will be slow, but guaranteed tofind the solution!!Document References:1. MsX MsCompare - High Resolution Peak Matching QuickRef20132. MsX MsCompare - High Resolution Peak Picking QuickRef 20133. MsX User ManualMsCompare- Univariate & Multivariate Data Analysis – Quickref 2013-5-
Univariate Analysis Tools for finding Discriminating Peaks: Multivariate techniques in general are variance based, which means that the focus is on the large peaks in your data. Furthermore, it is expected that peaks are highly correlated. In many LC/MS and GC/MS studies the interesting peaks will