Transcription
Using Thermal Mapping at the Data CenterGregory StocktonCompuScanIR.com, a division ofStockton Infrared Thermographic Services, Inc.INTRODUCTIONFor data centers, maintaining a continuous flow of information requires near 100% uptime. As 24/7/365operations become the norm for business, ensuring that data center infrastructure stays up and running ismission critical. Hard failures can cost a large business millions of dollars in lost productivity and opportunitycosts. If this were not a big enough challenge, data centers consume a lot of energy, and in times of risingworldwide demand, high operating expenses can put a serious dent in the information technology (IT)organization‘s budget.Because of the need for high uptime rates, the ever-increasing cost of electricity, higher server densities andlimits on electrical grid capacity, data center operators are now looking for ways to optimize performance andincrease their kW per square foot rating—all while reducing costs. Reducing the consumption of energy in adata center while maintaining high availability is no small task, but the rewards are high. In the US, serversand data centers consumed 61 billion kWh (1.5% of total US electrical consumption) in 2006 and are1projected to consume as much as 100 billion kWh by the end of this year .To ensure reliability and economical operating costs, the power distribution and cooling infrastructure must beactively managed. Outages stemming from electrical or mechanical failure can be prevented by physicalredundancy practices and predictive/preventive maintenance (P/PM) and are currently being used by mostdata centers. To reduce electrical consumption and address ‗green‘ operating mandates, data center2operators are now exploring ways to raise temperature set points .What‘s the solution? While it may not be obvious, a usable ‗heat view‘ provides a big part of the answer.Today, managing a data center involves far more than solid IT operations. Because temperature is directlylinked to energy consumption and equipment operation, infrared thermography (thermal imaging and thermalmapping) can be used to monitor power consumption, cooling, and IT operations. In fact, monitoring theelectrical equipment, cooling equipment and computing equipment which is at the heart of the data center, isprecisely where thermal infrared thermography (IRt) can help the most!Infrared thermography (IRt) is used to find, diagnose and document problems such as short-cycling of the airconditioning system, loose electrical connections and worn out bearings. After repairs have been made, IRt isused to recheck the equipment to make sure it is operating properly. Two main categories are:1) Cooling Systems and Heat-Generating Equipment. Capturing the current condition of the coolingsystem is the start of the IRt process. Thermal Mapping is a new approach to gather and present thatdata. Thermal mapping allows IT management, heating, ventilation and air conditioning (HVAC)professionals, consultants and contractors a construct to understand heat-related problems in thedata center. It also makes it possible to compare the results to the CFD models used to design them.Because the complete picture is captured in-situ, issues that were not obvious when the room andcooling system were designed become apparent.2) Electrical Power Distribution and Mechanical Systems. Performing infrared P/PM on electricaland mechanical equipment is crucial to continuous operation and well accepted in the power industryas standard best practice. In fact, electrical IR has been the most accepted of all IR applications andthere are many technical papers on the subject. Infrared predictive maintenance is a must at any datacenter. The electrical switchgear, motors and motor controls, HVAC equipment, uninterruptible powersupplies (UPS), automatic transfer switches (ATS), power distribution units (PDU), batteries andgenerator equipment and all electrical devices that feed the server systems must be checked withinfrared thermography and other testing on a regular basis to assure super-high reliability.InfraMation 2010 Proceedings2010-188-Stockton
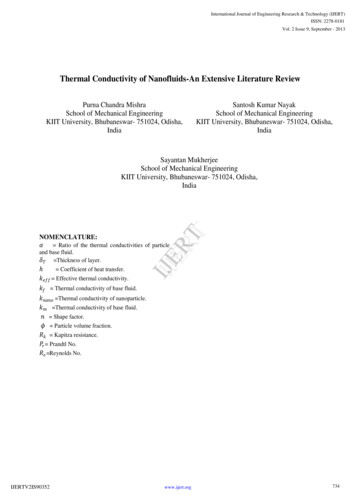
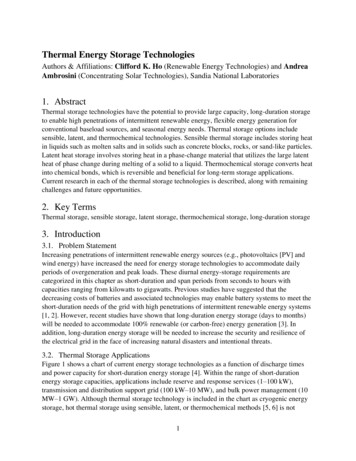
WHY USE IR THERMAL MAPPING IN DATA CENTERSStockton Infrared has performed P/PM IR surveys of data centers‘ electrical distribution systems for overtwenty years. On various occasions, our clients have asked us to look at the cooling of the floors and serverracks to solve a perceived or real cooling problem. We realized that the method we were using, looking downthe aisles (see Figures 1), was satisfactory to look at a certain spot or two on the raised floor or server, butnot sufficient to get a picture of the heat distribution in the whole data center. To accomplish that, we had tocome up with a better way. So, in recent years, we focused our research to develop a methodology forcollecting and post-processing the images into user-friendly, easy to understand 2-D (2-dimensional) and 3-D(3-dimensional) displays which we could present to our clients (see Figure 2). The purpose of creating aheat or thermal map is two-fold: to confirm efficient design, and to find problems.Figures 1a and 1b) “Down the aisles” thermal image of the raised perforated floor and servers of a data center utilizing hotaisle/cold aisle configuration. This is the way that we looked at data centers’ cooling systems in the past, but the methodis not sufficient to get the overall picture necessary to solve complex cooling problems.Figure 2) IR research being conducted at an enterprise data center to develop 2-D and 3-D modeling capabilities.InfraMation 2010 Proceedings2010-188-Stockton
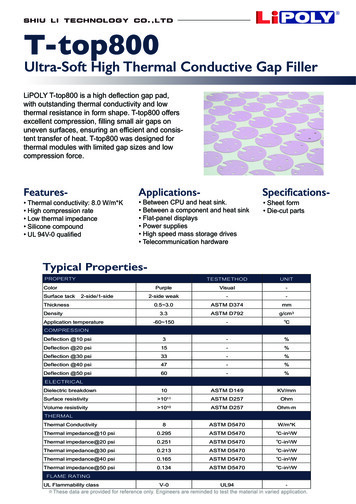
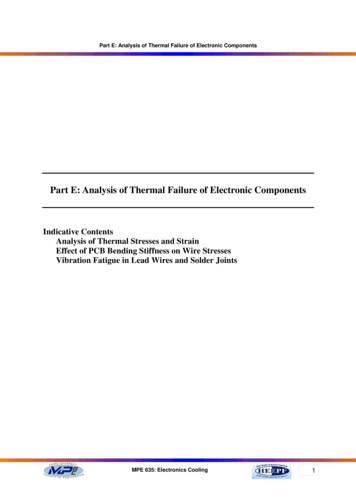
DATA CENTER OPERATIONS AND DATA CENTER TYPESA data center is a facility which houses computer systems and associated hardware components, such astelecommunications and data storage systems. Most of the installed equipment is in the form of computersystems and servers, mounted in specially-designed cabinets (racks), and dedicated equipment for managingpower and temperature and humidity. The equipment on the data center floor is usually grouped in rows withcorridors between them allowing IT technicians to access the front and rear of each of the racks.Enterprise Data CentersEnterprise data centers (EDCs) provide unified support for corporations with their distributed facilities. Theyprovide integration of many different functions that enable business activities based on internet and intranetservices, or both. Corporations highly value the internal control and increased security provided by dedicatedenterprise data centers and they are the fastest-growing type of data center. Support of intranet server farmsis the primary target of an enterprise data center.Internet Data CentersInternet data centers (IDCs) are operated by internet service providers (ISPs). ISPs also operate enterprisedata centers. The architecture is very similar to that of the EDCs, but the requirements for scalability aredifferent because the internal user base is different. There are fewer services as compared with those ofEDCs, hosting multiple customers.Colocation Data CentersColocation data centers (colos) are owned by companies that house and operate data center equipment forthird parties. Corporations use colos for disaster avoidance, offsite data backup and business continuity. Mostcolo customers are web commerce companies, using these centers as a safe, low-cost environment forredundant connections to the Internet, including ―cloud‖ computing providers. Telecommunication companiesuse colos to interexchange traffic with other telecommunications companies.DATA CENTER COOLING SYSTEMSTraditionally, data centers have been air-cooled. Still today, the typical data center is air-cooled, utilizing thehot aisle/cold aisle layout (see Figure 3). Cooled air is fed from the computer room air conditioning (CRAC)units to the cool aisles under a raised floor through perforated tiles (diffusers) up into the cool aisle, into theequipment and out the hot aisle. The heated air is then returned to the CRAC units.Data center cooling systems have changed little over the past 25 years, but owing to the issues discussedabove, new designs are being developed and tested, two are notable; cold aisle containment and liquidcooling. Cold aisle containment uses a raised floor, but contains the cold air between the cold aisle racks,sending the cold air directly to the server inlets, greatly reducing air mixing and short-cycling. Liquid cooling isused within most CRAC units, but liquid-cooled racks take advantage of the enhanced heat transfercharacteristics of liquids. Since the CRAC units can be installed outside the main floor area, this designeliminates short-cycling. These systems are significantly more complex and expensive now, but may becomemore and more important as server densities increase beyond air cooling capabilities.Figure 3) Data Center Cooling System (Typical Hot Aisle/Cold Aisle Layout shown). Source: ASHRAEInfraMation 2010 Proceedings32010-188-Stockton
DEFINING THE PROBLEM WITH HOT AILSE / COLD AISLE COOLING SYSTEMSThe electronic, electrical and mechanical components within a data center all generate heat. Unless the heatis removed, the ambient temperature will rise, eventually beyond design specifications resulting in electronicequipment malfunction. The temperature and distribution of air within the room is managed by the airconditioning system and influenced by the layout of the server racks. ASHRAE's "Thermal Guidelines for DataProcessing Environments" recommends a temperature range of 61-75 F and humidity range of 40-55% with amaximum dew point of 59 F as optimal for data center conditions. Air conditioning systems help controlhumidity by cooling the return space air but keeping it above dew point. Too much humidity and moisture maybegin to condense on internal components. Too little humidity will result in static electricity dischargeproblems which may damage components. In the case of a very dry atmosphere, ancillary humidificationsystems may be needed to add water vapor. So, under certain conditions, the control of humidity worksagainst the control of temperature and vice-versa.Many server racks currently in service today are too hot to meet industry standards for maximum IT reliabilityand performance as reported by Uptime Institute “Institute research into computer room cooling indicates 1/3 of all perforated tiles areincorrectly located and 60% of all available cooling capacity is being wasted by bypassairflow. Increasing under-floor static pressure to get air where it needs to go requirespermanently blocking all unnecessary air escape routes. This includes sealing cablecutouts behind and underneath products or racks (this unmanaged airflow is what is reallycooling most computer rooms) as well as the penetrations in the floor or walls or ceilingand any other openings in the raised floor. Perforated floor tiles with 25% openings can bereplaced with 40% and 60% grates to permit a much higher airflow. For sites with unusedraised floor space deliberately spreading equipment out to create white space and reduce4the averaged gross watts per square foot power consumption will be a viable option.”The weakest link in the system that can lead to a hard failure and loss of availability is lurking in every datacenter. It is the component that is most susceptible to failure by heat at the lowest temperature. But no oneknows exactly where that component is located until it fails. Accurate and even cold aisle cooling is the bestpractice available to a data center operator. Finding and eliminating ‗hot spots‘ is the goal of any uptimeconscious data center manager. Finding and eliminating ‗cold spots‘ is the goal of any energy conscious datacenter manager. Thermal mapping satisfies both.TOOLS FOR ANALYZING THE DATA CENTER THERMAL ENVIRONMENTCFD Thermal ModelingThe data center‘s cooling system must be designed and engineered to provide cooling to computercomponents. The objective of the design of the cooling system is to provide a clear path from the source ofthe cooled air to the intakes of the servers and to return the heated exhaust air to the CRAC efficiently.Data centers are usually designed and drawn with computer-aided drafting and design (CADD) software andmodeled using computational fluid dynamics (CFD) modeling. These tools are available to predictperformance for the design of a new data center. CFD is a valuable means of predicting data center thermalperformance. Acceptable performance depends on accurate modeling of the energy-consuming componentsand the heat that they produce. CFD is, however, limited by the granularity of input data and as a result,requires many questionable assumptions.No matter how complex and well-prepared, CFD modeling is not reality. Simple things like under floorcable or ducting installations have significant impact on theoretical flows of cooled air. Deviations from idealperformance will only show up after physical testing. Also, during and after construction, changes happen.Unforeseen issues like adding servers or increasing server densities are rarely re-modeled after construction.InfraMation 2010 Proceedings2010-188-Stockton
Contractors move equipment, change cabling and conduit routes and HVAC ductwork, inadvertently creatingvoids and obstructions, reducing or increasing air pressure and diverting the flow of cooled and heated air.Obviously, these types of unforeseen changes to the thermal dynamics of the cooling system are seldommodeled. So, IRt is used to validate the CFD model (in a normal operating condition) and direct HVACtechnicians and IT managers to heating problems (hot and cold spots). After repairs have been accomplished,IRt is used to check the repairs.Thermal Mapping of a Data CenterThermal mapping is a new approach to capturing the full ―in-situ‖ thermal condition of a data center and all ofits equipment. The key advantage is that it is possible to get an overall view of the thermal condition of theentire room for a given point of time while still having the capability to zoom in on specific problems. This isvery different from more traditional methods because it allows overall context and viewpoint selection, muchlike one gets with CFD modeling, but this is actual thermal imagery. For example, reports can demonstratehow a local thermal pattern visible in one aisle is actually the sign of a cooling air blockage across severalaisles. When the overall layout of the servers, floor, walls and ceiling is available, what appears to be goodthermal performance in one image may actually be wasteful excess cooling when the entire thermal map isanalyzed. These problem areas are easy to see only with the overall image.Temperature sensors have the advantage of monitoring temperatures continuously. Placed in variousstrategic locations, sensors are a good idea to monitor overall changes, but are certainly no replacement forthermal imaging. Typically, a single thermal image has over 75,000 thousand temperature points and, forinstance, a five thousand square foot data center thermal image will have many millions.Another positive aspect of thermal mapping is that it allows for trending (comparing data gathered at differenttimes). Information that did not appear to be important at the time of the survey can be used to discover achange in the cooling system. For instance, on one survey an area with no visible problems might be coveredby thermal mapping where more conventional surveys might not capture that spot because it showed noapparent problems. When a subsequent survey shows a problem, it is possible to see the change or showthat nothing has changed. It is possible to see changes like new cable runs or equipment installed whichimpacted free air flow.Every data center has equipment that is important to different groups of people. By methodically capturing allthe thermal data and carefully post-processing it into user-friendly displays, these different people can seewhat is important to them, without having to be on scene during the survey. Also, experts in differentdisciplines can review the imagery and prepare reports at remote locations.To create a thermal map, one must collect the thermal and visual imagery in an ordered manner,carefully post-process it into mosaics, and create the construct to display it in 2-D and/or 3-D. Tocreate meaningful reports, the thermal imagery must then be analyzed.Figure 4) Thermal map mosaic IR image of a set of thirteen server racks in a data center.InfraMation 2010 Proceedings2010-188-Stockton
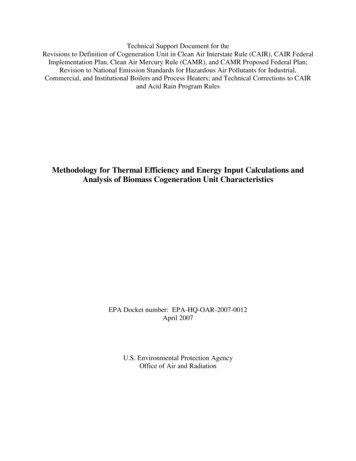
2-D Thermal Mapping View of Data Center Floors2-D thermal mapping provides easy access to large quantities of data in a user-friendly manner. The mosaicIR images provide the ability to analyze patterns that are not clear in single images. Figures 5 show a 2-Dthermal map and visible map of the floor of a data center. The upper left corner appears to be warmer in thethermal map image as compared to the lower end. The warm pattern was the result of an air flow blockagethat was caused by cables added after commissioning and the addition of a set of blade servers. Withattention being focused on that upper left corner, it is also valuable to look at the 3-D thermal map presentedbelow to see if there are clues to other problems. These problems will be discussed in detail later, but there isan issue with the CRAC unit along the upper wall.Figures 5a and 5b) 2-D zoomable thermal map image of a 5,000 square foot data center main floor.2-D Thermal Mapping View of Data Center Server RacksThermal mapping of server racks provided below in Figure 6b represent highly detailed front-facing images ofthe servers. This is different from the looking ―down the aisle‖ shots shown in Figures 1. By combining IR andvisible images, it is possible to clearly see the details. By using this presentation it is also possible to show thecabinets with the doors open. In this sample, the details of the top of the servers are shown in a way thatallows them to be related to the images of the fronts. Other combinations are available as needed.Figure 6a) Zoomable thermal map imagery server racks (overview).InfraMation 2010 Proceedings2010-188-Stockton
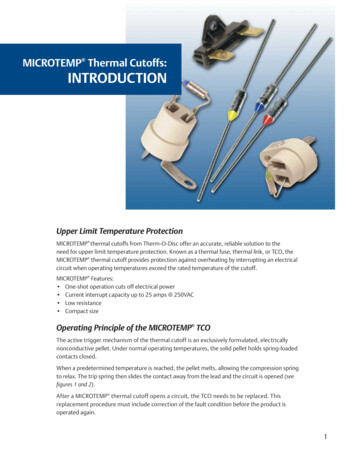
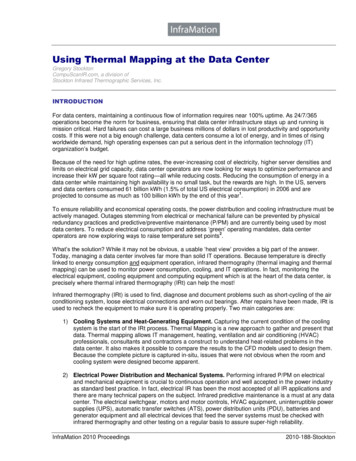
Figure 6b is a zoomed-in view of Figure 6a. It allows for a detailed comparison of the easily identifiablehardware and the thermal characteristics as it operates. By taking additional partial or complete surveys attimes with different loads, it is possible to get a better idea of the overall thermal performance of any givenserver under varying loads.Figure 6b) Zoomable thermal map imagery server racks (details).3-D Thermal Mapping View of Data Center FloorsThree-dimensional thermal mapping is a new approach to capturing the thermal condition of a data centerand all of its equipment and is the most powerful of all tools for presentation to operators, consultants,contractors and HVAC professionals wanting to accomplish adjustments, repairs and redesigns.A 3-D model can be rotated and viewed from any angle. In this case (see Figure 7), the context of the wallsand floor view shows a relationship between a warm floor and an apparent problem with the CRAC unit. Byinvolving an experienced HVAC professional, it was determined that even with a properly functioning thermalcontrol system, the cooling was inadequate. The CRAC unit that is shown to be offline could have taken overfor the one that is low on Freon. But because the control system and the operators saw that the defective unitwas operating, they did not question that the other one was not operating. Only the IR survey of the entirearea showed that something was wrong. The complete 3-D thermal map of the floors and walls provided thebig picture that allowed for remedial action.The under floor blockage was also better appreciated when the condition of the CRAC units was considered.In addition, other views that show the floors and walls in the cooler end, lead one to believe that it is overcooled. This provides an opportunity to save money. There is also an issue of conflict between the coolingand the humidity control systems. Overcooling below the dew point can trigger [electrical] heating to raise thetemperature. This can have significant energy ramifications as the two systems fight one another. ExpertHVAC personnel with access to the total picture can perform this kind of analysis without even having to beon site.InfraMation 2010 Proceedings2010-188-Stockton
Figure 7) 3-D Thermal Map of the actual heat in a data center. Thermal mapping discovered a CRAC unit that was low onFreon. At the same time, it showed that another CRAC unit which could have handled the load was not operatingbecause the control program showed that the other CRAC unit was operating, even though it was not cooling that areathe room.THERMAL IMAGING OF THE POWER DISTRIBUTION SYSTEMS IN DATA CENTERSElectrical and mechanical predictive maintenance is the second part of the equation. Infrared predictivemaintenance (IR/PM) is a must in a mission critical facility like a data center. The main electrical switchgear,HVAC equipment, UPSs, ATSs, PDUs, batteries, battery panels, generator panels and switches, motors andmotor controls and the electrical panels that feed the server systems must all be checked with infraredthermography on a regular basis to assure super-high reliability (see Table 1).TierTier 1Tier 2Tier 3Tier 4RatingBasicRedundant ComponentsConcurrent MaintainableFault ble 1) TIA-942 standard for reliability in data centers. This standard was developed by the Telecommunications IndustryAssociation (TIA) to define guidelines for data center reliability.The stakes are high, so there must be total accountability of all survey results, especially all of the equipmentassociated with the cooling, UPS, and server systems. Documentation is very important. This can beaccomplished by recording the entire survey on digital videotape and/or capturing fully-radiometric IR imagesof all equipment, whether problems exist or not. In either case, a data log of all equipment surveyed must becreated including a time/date stamp reference for all equipment.Safety is of the utmost importance during any infrared survey of electrical and mechanical gear and nodifferent in data centers (see Figures 8a & 8b).InfraMation 2010 Proceedings2010-188-Stockton
Figures 8a & 8b) Safety around electrical equipment is the #1 consideration during infrared surveying. Some of the5options: 8a shows an IRISS infrared window installed in electrical cabinet . The thermographer safely holds an infraredcamera up against a viewing port or window to see inside the switchgear. These windows can be custom fit to any datacenter equipment. 8b) Thermographer wearing proper personal protective equipment (PPE) inspecting a battery bankduring a full battery discharge test.Specialized Infrared P/PM InspectionsIR surveys are performed on the systems that support the uninterrupted operation of data centers on theelectrical and mechanical equipment. This IR method is predicated on the fact that there is a lockedrelationship between heat and resistance on electrical systems (heat and friction on mechanical systems).Figures 9 shows a sample report of an electric problem on a chiller control.Since the thermographer can see all the heat, he/she can immediately see excess heat on electrical andmechanical apparatus and make judgments on whether a problem exists and how to report potential faultssuch as loose connections, damaged bearings, overloaded or imbalanced circuits, faulty fuses and the like.The power distribution system in data centers is often checked during ‗maintenance windows‘ or timesdesignated by IT and facilities management when testing can be performed and maintenance activities canbe safely carried out, without chance of interrupting critical IT activities.Dual-power technology requires two completely independent electrical sources, tied together with switchgear.When [not if] the normal source of power fails, these dual-path power supply systems quickly switch to aback-up source. A UPS system keeps the power flowing on batteries until the normal source is restored oranother source is brought on-line and synchronized. Generators are set at the ready to provide power whilethe batteries are providing power and before a second source of utility power cannot be utilized. Usually, theUPS, through a PDU (power distribution unit) takes the AC power and converts it to DC. There, the bank ofbatteries is tied in. The DC power is then inverted back to AC to feed the computer hardware.Utility main power supplies are typically owned by the local power company but are sometimes owned by theuser. Often, a looped system feeds power from two different power company substations and can be ―backfed‖ if the power stays out on the primary. No matter who the technical owner of the utility equipment is, itmust be checked with IR just like all other components.Commissioning newly added power equipment with IR has become standard. Since some systems oftencannot be tested on-line, they must be examined at times when the impact of testing is low, so thatsimulations can be run. By pulling power from a load bank, resistive load testing is used to fully simulate andtest all equipment by increasing loads incrementally. Any problems that are encountered during this ―burn-in‖are repaired immediately and the system is rechecked before putting the equipment in operation.InfraMation 2010 Proceedings2010-188-Stockton
Figures 9a & 9b) Electrical infrared predictive maintenance sample report. This problem was reported and repaired duringa planned outage, causing zero downtime.SUMMARYSince the heart of the data center is its power and cooling system, data center managers are now usinginfrared technology to monitor and repair these systems. Through the use of IR thermography; predictivemaintenance and thermal mapping, data centers of the future will be more reliable and use less energy.FURTHER READINGFor more information on data center maintenance using thermal imaging eport to Congress on Server and Data Center Energy Efficiency (Public Law 109-431) U.S. Environmental ProtectionAgency ENERGY STAR Program, August 2, 20072Data Center Knowledge website Miller Webworks /3ASHRAE. 2004b. Thermal Guidelines for Data Processing Environments. Atlanta, GA: American Society of Heating,Refrigerating and Air Conditioning Engineers4UpTime Institute, Procedures and Guidelines for Safely Working in an Active Data Center page 9., UpTime Institute(12/18/06).510 Things You Need To Know About Infrared Windows Copyright 2009 by IRISS, Inc. All rights reservedInfraMation 2010 Proceedings2010-188-Stockton
ABOUT THE AUTHORAuthor Biography – Gregory R. StocktonGregory R. Stockton is a principal in three infrared companies; Stockton Infrared Thermographic Services,Inc. (www.stocktonInfrared.com), United Infrared, Inc. (www.UnitedInfrared.com) and RecoverIR, Inc.(www.RecoverIR.com). Stockton Infrared is a nationwide multi-disciplined infrared service contractor. UnitedInfrared is a nationwide network of infrared thermographers providing training on a variety of applications andthe business of infrared thermography. RecoverIR is an aerial thermal mapping company primarily focused onpower utility issues such as improving energy efficiencies, weatherization, and identification of lost energy.Greg is a certified infrared thermographer with thirty years of experience in the construction industry,specializing in maintenance and energy-related technologies. He has published fifteen technical papers onthe subject of infrared thermography and written numerous articles about applications for infraredthermography in trade publications. He is a member of the Program Committee of SPIE (Society of PhotoOptical Instrumentation Engineers) Thermosense and co-chairman of the Buildings & Infrastructures Sessionat the Defense and Security Symposium.InfraMation 2010 Proceedings2010-188-Stockton
Still today, the typical data center is air-cooled, utilizing the hot aisle/cold aisle layout (see Figure 3). Cooled air is fed from the computer room air conditioning (CRAC) units to the cool aisles under a raised floor through perforated tiles (diffusers) up into the cool aisle, into the equipment and out the hot aisle.