Transcription
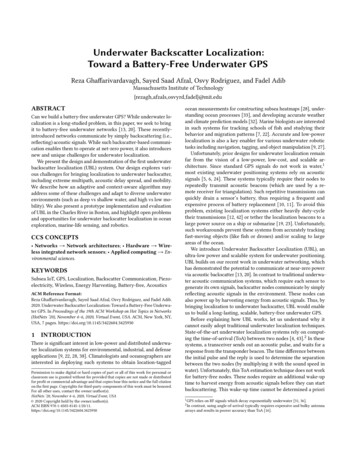
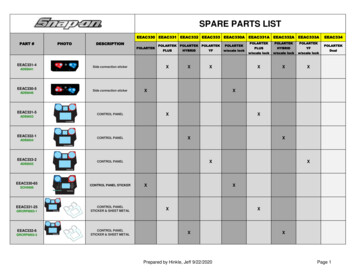
Large-scale Localization Datasets in Crowded Indoor SpacesDonghwan Lee1, *, Soohyun Ryu1, *, Suyong Yeon1, *, Yonghan Lee1, *, Deokhwa Kim1 , Cheolho Han1 ,Yohann Cabon2 , Philippe Weinzaepfel2 , Nicolas Guérin2 , Gabriela Csurka2 , and Martin Humenberger211,2NAVER LABS, 2 NAVER LABS Europe{donghwan.lee, soohyun.ryu, suyong.yeon, yh.l, deokhwa.kim, cheolho.han, yohann.cabon,philippe.weinzaepfel, nicolas.guerin, gabriela.csurka, g the precise location of a camera using visuallocalization enables interesting applications such as augmented reality or robot navigation. This is particularly useful in indoor environments where other localization technologies, such as GNSS, fail. Indoor spaces impose interesting challenges on visual localization algorithms: occlusions due to people, textureless surfaces, large viewpointchanges, low light, repetitive textures, etc. Existing indoordatasets are either comparably small or do only cover asubset of the mentioned challenges. In this paper, we introduce 5 new indoor datasets for visual localization in challenging real-world environments. They were captured ina large shopping mall and a large metro station in Seoul,South Korea, using a dedicated mapping platform consisting of 10 cameras and 2 laser scanners. In order to obtain accurate ground truth camera poses, we developed arobust LiDAR SLAM which provides initial poses that arethen refined using a novel structure-from-motion based optimization. We present a benchmark of modern visual localization algorithms on these challenging datasets showing superior performance of structure-based methods using robust image features. The datasets are available at:https://naverlabs.com/datasets1. IntroductionVisual localization estimates the 6 degrees of freedom(DoF) camera pose of a given query image. It is an important task in robotics, autonomous driving, and augmentedreality (AR) applications. Modern visual localization methods that utilize both, deep learning and multi-view geometry, show promising results in outdoor environments,even in the presence of dramatic changes in scene appearance [12, 31, 60, 48], and interesting real-world AR appli* Theseauthors contributed equally.Figure 1: Illustration of the proposed NAVER LABS indoor visual localization datasets. Top: Point clouds fromLiDAR SLAM (red) and dense reconstruction [51] (color).Bottom: Images showing different challenges; from leftto right: textureless areas, changing appearance, crowdedness/occlusions, dynamic environment.cations, e.g. navigation, have been developed [20]. Whenconsidering challenges for visual localization, indoor environments differ from outdoor scenes in important aspects.For example, while the lighting conditions in indoor spacestend to be more constant, indoor spaces are typically narrower than outdoor environments, thus, small camera movements can cause large changes in viewpoint. Dynamic objects, e.g., people, trolleys, flat screens, textureless areas,and repetitive patterns also impose challenges for visuallocalization and tend to occur more often indoors. Highaccuracy indoor visual localization is crucial, especially forapplications such as robot navigation, where a 10cm errorin position could already cause a robot falling down a staircase. Even if in practice such extreme cases are avoided3227
with proper redundancy in the on-board sensor suite [18, 6],we want to push the capabilities of visual localization toits limits. Large-scale indoor datasets with accurate groundtruth poses are thus required in order to develop and benchmark high performing (e.g. error below 10cm and 1 ) visuallocalization algorithms.Numerous datasets have been proposed for visual localization [27, 30, 49, 48, 49, 31, 25, 25, 12, 60, 34, 4, 19, 57]and Table 1 provides an overview. In outdoor environments,structure-from-motion (SFM) is employed as an effectivetool to generate the ground truth poses. Unfortunately, dueto the aforementioned challenges, large-scale SFM is moredifficult to apply for indoor spaces [62, 56]. Thus, indoordatasets often rely on additional depth sensors such as RGBD cameras [19, 58] and laser scanners (LiDAR) [56]. Thedepth range provided by RGB-D cameras is often limited toabout 10m [24]. As a result, most of the existing datasetsconstructed using RGB-D cameras capture relatively smallindoor spaces [3, 14, 11, 19, 57] and LiDARs [56] or dedicated visual 3D mapping devices [58, 11] have been usedin order to create larger indoor datasets. Such devices generate panoramic images or colored point clouds that capture the structure of indoor spaces with high spacial resolution [17, 38]. In addition to high precision 3D scans, agood visual localization dataset may also consist of manyimages covering a large variety of views and situations.Thus, additional training and realistic query images oftenhave to be recorded separately and they need to be registered within the generated point clouds in order to computetheir ground truth poses. One solution for this, as alreadydone for existing indoor visual localization datasets [56], isutilizing semi-automatic annotation algorithms with a significant amount of manual workload. As a consequence, thearea covered by existing datasets (see Table 1) is sparselysampled by the provided images [19, 57] and this causesdifficulties when, e.g., training deep neural networks for visual localization [50]. We conclude that datasets that arelarge-scale, accurate, and densely sampled are still missing.This motivated us to contribute another step towardsclosing this gap. In this paper, we introduce five new localization datasets acquired in challenging real-world indoorenvironments. The datasets were captured in a large shopping mall and a large metro station in Seoul, South Koreaand include images and point clouds obtained from a dedicated mapping platform comprising ten cameras and two3D laser scanners. Compared to existing indoor datasets,the proposed datasets provide dense image sampling andcover many challenges of indoor visual localization (seeFigure 1). In addition, the database and the query sets werecaptured with time intervals of up to 128 days, thus, thedatasets contain various changes over time. Since estimating precise ground truth (6DoF) camera poses for such largeindoor spaces using SFM, to the best of our knowledge, wasnot possible so far (e.g. [62, 56] report failure cases), wedeveloped a novel, automated pipeline that utilizes both,LiDAR SLAM and SFM algorithms to solve this problem. The proposed pipeline applies LiDAR-based posegraph SLAM to estimate the trajectories of the mappingplatform. The LiDAR SLAM poses are spline-smoothedand used as a prior information for the subsequent SFMprocess that obtains the camera poses jointly for multipletrajectories within the same space. As shown in Figure 1,the 3D models from both LiDAR SLAM and SFM are wellaligned. The datasets are referred to as NAVER LABS localization datasets and are available at:https://naverlabs.com/datasetsOur primary contributions are summarized as follows.(i) We introduce five new large-scale datasets for challenging real-world indoor environments (Section 2.4). The proposed datasets provide dense image sampling with groundtruth poses as well as accurate 3D models. (ii) We proposea novel, fully-automated pipeline based on LiDAR SLAMand SFM to obtain ground truth poses (Section 3). (iii) Wepresent detailed evaluations of modern visual localizationmethods of relevant algorithmic groups showing their limits on these challenging datasets (Section 4). We hope toopen new interesting research directions to further improvevisual localization.2. The NAVER LABS localization datasetsThis section first describes the characteristics of the proposed datasets as well as the considered indoor spaces, itthen introduces the mapping platform we used to acquire thedata, and finally, it relates our datasets with existing work.2.1. Dataset descriptionOur datasets consist of multiple sequences captured overfour months in five different floors in a department storeand a metro station (see Table 1). All places were publicly accessible while scanning, thus many moving objectssuch as people, trolleys, luggage, as well as flat screensand store fronts were captured. Each floor is different interms of size, statistics, and characteristics: The capturedsurface size varies from 5,250m2 to 20,879m2 . The entire dataset contains over 130k images, each individual floorcontains between 14k and 41k images. The 3D models,reconstructed with the proposed SFM pipeline, consist of1.3M to 3.0M 3D points, triangulated from 4.8M to 22.7Mlocal features (see Table 1).The Dept. datasets were captured in one of the largestshopping malls in South Korea. It consists of three differentfloors: Dept. B1 contains areas with restaurants, supermarkets, and cafes, Dept. 1F and 4F contain cosmetic, jewelry,and clothing shops. Dept. 1F and 4F were captured in goodlighting conditions but include lots of reflective surfaces.Dept. B1 was captured under low-light conditions. During3228
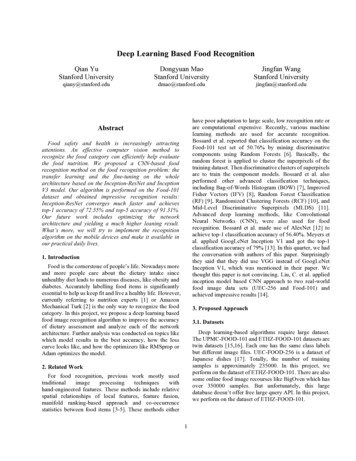
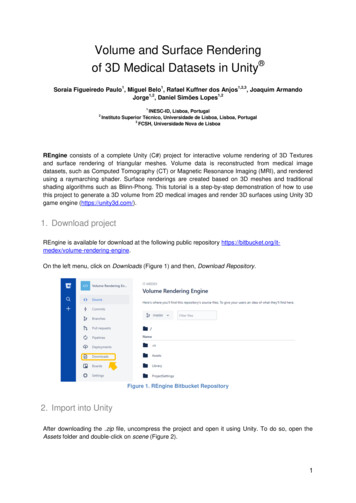
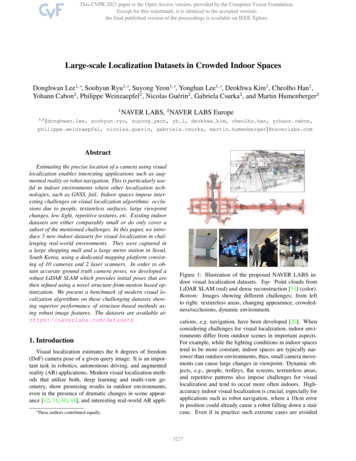
NL (Ours)IndoorOutdoorDatasetsCambridge [27]Dubrovnik [30]Aachen Day-Night [48, 49, 65]Landmarks [31]Rome [30]Vienna [25]San Francisco [12, 31, 60]RobotCar Seasons [48, 34]CMU Seasons [48, 4]Stanford [3]ScanNet [14]Matterport3D [11]7-scenes [19]TUM Indoor [22]TUM-LSI [62]InLoc [57]Baidu [56]Dept. B1Dept. 1FDept. 4FMetro St. B1Metro St. B2Environments5 smaller sceneslarge city areamedium city area1k landmarks69 landmarks3 city zonesvery large city area49 urban zones17 sub-urban zones270 small rooms707 small rooms2,056 small rooms7 small roomsUniv.bldg. (7 floors)Univ. bldg. (5 floors)Univ. bldg. (5 floors)mallmallmallmallmall & 05,32312,4217,51523,79517,6386,7688,240Space(m2 68,34820,8795,2503D SFM M36.15M1.61M6.50Mlaser scannerRGB-D cameraRGB-D cameraRGB-D cameralaser scannerlaser scannerlaser scanner / RGB-Dlaser ConditionIntervalCrowdedness 0.1%26 days2.1%months 0.1%3.75%128 days6.87%128 days5.47%same day3.45%17 days12.9%same day7.73%Table 1: Visual localization datasets. Interval represents the time interval between the capture of the database and thequery sets. Crowdedness is the percentage of pixels belonging to humans. We compute this with an off-the-shelf semanticsegmentation network [13] followed by manual inspection. NL stands for NAVER LABS.data acquisition, Dept. 4F was under construction, thus, alarge number of images containing texture-less temporarywalls are included. Rapid rotations of the mapping platformoften caused motion blur in the images.Metro St. was collected in one of the most crowded metrostations in Seoul and is intended for evaluating robustnessof visual localization algorithms in scenes with many moving objects. The images in this dataset show the largest proportion of human pixels among the existing indoor localization datasets, including ours. Furthermore, this datasetis the largest in size and includes a variety of scenes withshops, turnstiles, and stairs. Metro St. B2 was captured atthe platforms of the metro station. The two platforms inthis dataset were built with highly similar designs and internal structures as shown in Figure 5. This dataset is intendedfor benchmarking visual localization algorithms in repetitive and symmetric scenes. In addition, digital signage andplatform screen doors, which change appearance over time,introduce new challenges.Figure 2: Example of validation (red) and test (white) splitsfor one of our datasets (Dept. 4F).2.2. Dataset formatTo easily evaluate an image-based localization technique, each dataset is provided in the kapture1 format [23]which supports timestamps, shared camera parameters,multi-camera rigs, reconstruction data, and other sensordata. The kapture toolbox enables to convert data into otherformats such as OpenMVG [36] and COLMAP [52]. As canbe seen in Table 1, our datasets consist of database imagesfor mapping, and query images for testing. In addition, wesplit the query images into test and validation sets that represent different areas with little overlap (see Figure 2). The1 https://github.com/naver/kapture(a)(b)(c)Figure 3: The mapping platform: (a) appearance, (b) sideview (c), top view.ground truth poses of the validation set are released publicly, the poses of the test set are retained to build a visuallocalization benchmark.2.3. Mapping platformWe collected data by using the dedicated mapping platform shown in Figure 3. The mapping platform is equippedwith differential drive consisting of two wheels and four3229
Type3D LiDARcamerasmartphone (as camera)magnetic rotary position sensor(as wheel encoder)Amount264ModelVelodyne VLP-16Basler acA2500-20gcGalaxy S9SpecificationFoV: 360 30 , angular resolution: 0.2 2.0 , rotation rate: 10Hz,FoV: 79.4 63.0 , image resolution: 2592 2048, frame rate: 2.5Hz, global shutterFoV: 77.0 (D), image resolution: 2160 2880, frame rate: 1Hz, rolling shutter2ams AS5047resolution: 1024 pulses/rotationTable 2: Sensors of the platform.casters. Each wheel has an encoder to obtain odometrydata. The center of the virtual axle connecting two wheelsis considered as the origin of the platform, the x-axis definesthe forward direction, and the z-axis defines the opposite ofgravity.The platform is equipped with two LiDARs with complementary roles: One LiDAR is positioned horizontally atthe center of the platform because horizontal orientation ofa LiDAR sensor maximizes the information required to estimate poses in indoor spaces. The other LiDAR is positionedperpendicularly at the top of the platform to construct thedense 3D point clouds via push broom scanning.Furthermore, the mapping platform is equipped with twodifferent types of cameras; 6 industrial cameras (BasleracA2500-20gc) and 4 smartphone (Galaxy S9) cameras.The six industrial cameras are mounted at intervals of 60degrees. They have a horizontal field of view (FoV) of morethan 70 degrees, thus, a set of images can horizontally cover360 degrees. Each camera is facing 10 degrees upwards inorder to capture not too much ground surface. The foursmartphones are mounted slightly above the industrial cameras to better reflect real-world applications where the capture device at test time will be different from the mappingplatform. The platform and the sensors are synchronizedusing a network time protocol (NTP) server. Note that illumination can change easily with camera movement in indoor spaces, thus, we set the exposure time to automatic forall cameras. Detailed specifications of each sensor are givenin Table 2.For extrinsic calibration between the two LiDARs, weestimate the relative pose using the iterative closest point(ICP) algorithm [7, 53] using geometric features in theirshared field of view. For calibration between the base andthe cameras, we employ an online self-calibration via SFMrather than an offline method. This is motivate by the factthat, on the mapping platform, the smartphone camerashave irregular time delays when compared to the industrialcameras caused by automatic exposure time control and SWsynchronization of Android OS. As a result, an online calibration method, which can deal with irregular time offsets,is better suited. Additional details and results are describedin Section 3.2.Existing datasets often used for visual localization can bedivided in indoor and outdoor (see Table 1). While bothgroups share the fundamental challenges of visual localization (Section 1), outdoor datasets often contain images including environmental changes, e.g., seasons, weather, illumination, and indoor datasets often include images thatrepresent occlusions, dynamic objects, and repetitive structures. Popular indoor datasets such as Stanford [3], ScanNet [14], and Matterport3D [11] target semantic understanding rather than visual localization, thus, they do notprovide database and query splits. However, even indoordatasets [19, 58, 56] that are more focused on localizationtasks were captured in a comparably small indoor spaceswhich makes them less relevant for real-world applications.Another important aspect of indoor localization is crowdedness in the sense of image regions covered by people. Thisis interesting because it effects both, training and testing(i.e. mapping and localization). As can be seen in Table 1,crowdedness has not been considered so far. In summary,large-scale datasets for visual localization are more oftenavailable outdoors, in addition, indoor datasets rarely contain people as inherent part of the environments they cover.The proposed datasets target on closing these gaps. Theyare captured in highly dynamic and crowded indoor spacesand contain a large variety of symmetric, non-Lambertian,and texture-less areas. Furthermore, since these datasetswere captured during business hours, they better reflect realworld applications.3. Ground truth generationThe ground truth poses for all images are generated usingour LiDAR SLAM (Section 3.1) and SFM algorithms (Section 3.2). First, LiDAR SLAM produces poses of the mapping platform for each sequence. Then it merges sequencestaken in the same space such that the sequences have a unified coordinate system. Note that the point clouds and camera poses can then be computed based on the platform posesand calibration parameters. Finally, SFM is used to refinethe camera poses. This process allows us to obtain extrinsic camera calibration of the mapping platform without theneed of a manual calibration process.3.1. LiDAR SLAM2.4. Related datasetsTo complete the description of the NAVER LABSdatasets, in this section we discuss a list of related work.In order to estimate the platform poses, we developeda LiDAR SLAM pipeline based on pose-graph optimization [33]. In the pose-graph, a node represents a platform3230
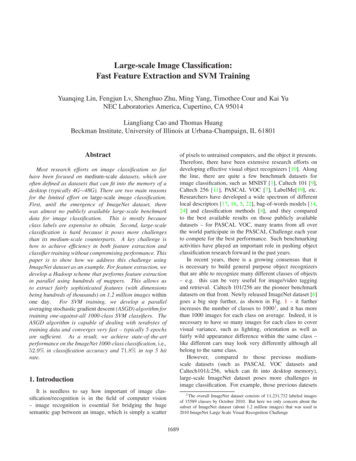
Figure 5: 3D reconstruction of Metro St. B2.Figure 4: Pose-graph for different sequences acquired atDept. B1 before (left) and after (right) merging and optimization. The thick white line represents platform poses,the green dots represent the accumulated point cloud according to the poses, and the red line represents a connection between spatially adjacent nodes in different sequences.pose and an edge between two nodes represents a relativepose constraint associated with the two platform poses.Undistorted point cloud generation. To increase theamount of point cloud data used in one node, we mergepoint clouds collected from the two LiDARs. We transformpoint clouds represented in different LiDAR coordinate systems into a platform coordinate system (using the extrinsicoffline calibration of the LiDARs) and concatenate them.In addition, in order to collect point clouds efficiently andevenly, we acquire point clouds by moving the platform atspeeds of up to 1.0 m/s. The scanning LiDAR characteristics, which are similar to those of a rolling shutter camera,cause distortion of point clouds while being in motion. Weemployed wheel odometry to compensate for that. Aftercalculating the transforms between platform poses at different times from wheel odometry, they are applied to thepoints to execute the compensation. Here, the position of apoint in a point cloud in the platform coordinate system iscalculated asBtp̃ R̃Bt Bt t (RBL Lt t p̃ tBL ) t̃Bt Bt t , (1)where Bt and Lt define the base of the mapping platformand the LiDAR at time t, respectively, and [R̃AB t̃AB ] isan odometry measurement by the wheel encoder from A toB. Thus, (1) transforms the LiDAR point Lt t p̃ at timet t, to the platform point Bt p̃.Pose-graph SLAM. Since the wheel odometry is comparably inaccurate, we set the edges of the graph as relativeposes estimated from ICP using undistorted sequential pointclouds. However, it is difficult to compensate for accumulated pose errors using the information between sequentialnodes only. To overcome this, additional edges betweenspatially-adjacent but time-distant nodes are calculated using ICP and added to the pose-graph. We acquire theseedges by following a coarse-to-fine approach. Using a distance threshold, we first select candidates that we quicklyverify with a rough ICP. Then we refine the verified candidates using a precise ICP. These edges act as additionalbridges to increase robustness and enable loop closing. Theplatform poses are then estimated by optimizing this graph.Graph merging. Platform poses estimated by the aboveprocedures are represented in an independent coordinatesystem for each sequence. To unify the different coordinatesystems, we perform a merging process between graphsfrom each sequence (Figure 4). As we start to scan a newsequence roughly at the same starting position like the otherones, the graphs are already coarsely aligned and loop closing (via ICP) can be performed throughout all the graphs(we needed to manually correct only a few initial poses).By optimizing the graph, we obtain the platform poses represented in a unified coordinate system.3.2. Structure-from-motionIn this section, we describe the SFM pipeline used torefine the initial image poses from LiDAR SLAM and toreconstruct the 3D feature map aligned to the LiDAR pointcloud. The proposed bundle adjustment utilizes the priorLiDAR SLAM poses and employs incremental mapping ofthe COLMAP library [51] to perform accurate and efficientlarge-scale indoor SFM. The intrinsic and rotational extrinsic parameters were also auto-calibrated for each datasetduring the SFM process.Local feature matching. We extracted R2D2 [43] featuresfor each image. Then, we matched the features efficientlyusing only the spatially close image pairs. More precisely,we use the initial image poses from the LiDAR SLAM process to effectively select most of the co-visible image pairsby thresholding the distance and the viewing angle difference between two images. We then filter the initial featurematches using cross-validation and reject outliers using geometric verification.Map optimization. Although traditional SFM libraries,such as COLMAP [51] and Visual SFM [64], could generally be applied to construct and optimize a 3D point cloudmap, we found that their standard bundle adjustment implementation was not suited for our purpose, i.e., refinementof LiDAR SLAM poses. To perform SFM precisely and efficiently in such large indoor spaces, it is crucial to embedprecise prior pose information and rigid sensor configuration constraints. In the existing SFM optimizers, however,this is typically not possible if images or prior poses are nottime-synchronized. Thus, we cannot apply them because3231
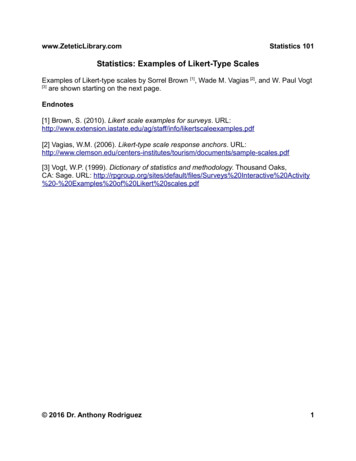
DatasetDept. B1Dept. 1FDept. 4FMetro St. B1Metro St. 5M1.3M3.1M1.3MAvg. obs.510.8394.5436.5329.2320.6Rep. err.1.36141.34361.46951.03730.9900Table 3: Mean reprojection error (Rep. err.) and mean feature observation count in the images (Avg. obs.) per dataset.our datasets contain various types of sensors, i.e., industrialcameras, smartphone cameras, and LiDARs, which are hardto synchronize.For this reason, we developed a novel bundle adjustmentalgorithm which can optimize image poses, feature points,and calibration parameters, jointly. This is done by utilizing poses from the continuous trajectories of the platformthat are estimated using LiDAR SLAM, as priors. To account for timestamp difference between sensors, we represented each platform trajectory as a continuous cubic splinein SE(3) [37]. With the platform trajectory spline TW B (t)and the extrinsic pose for camera Ci , TBCi , the pose errorcan be written asespline TW Ci (TW B (ti ) TBCi ).i(2)Here, denotes generalized minus defined in SE(3) manifold. TW Ci is the image pose and ti the corresponding timestamp. This continuous representation of the platform trajectory enables efficient and elegant usage of asynchronous prior poses coming from LiDAR SLAM. Moreimportantly, rigid configuration constraints between thecameras and the platform can be embedded even though theimages of two different types of cameras were not capturedtime-synchronously. The proposed pose error via spline canbe optimized with feature reprojection erroreproj z̃ij πCi (TCi WijWpj )to minimize the joint cost functioniXhspline 22ρ(keprojk ,L ij k ) kei(3)(4)i Iwhere ρ denotes the Cauchy loss [61]. By this modifiedbundle adjustment method, image poses and triangulatedfeature points can be refined and auto-calibration of intrinsic and extrinsic parameters can be conducted.SFM pipeline. We generated the SFM models by iteratingour bundle adjustment and COLMAP’s incremental triangulation [51], and for each iteration we decreased the outlier filtering thresholds. The initial reprojection errors usingposes from LiDAR SLAM vary between 50 and 200 pixels. As shown in Table 3, our SFM achieves very low reprojection errors under 1.5 pixels. Additionally, our SFMpipeline could accurately register images with low visualFigure 6: LiDAR scan data projected to images.saliency or crowded people by incorporating prior LiDARSLAM results. An example of our sparse and dense 3D reconstruction models are shown in Figure 5 and Figure 1,respectively.Auto-calibration. As mentioned above, the camera calibration parameters are automatically estimated while reconstructing the 3D model of each dataset via our SFMpipeline. To be more precise, only the intrinsic parametersand the rotational part of the extrinsic (camera to platform)parameters were auto-calibrated, the translation part of theextrinsic parameters is obtained from the CAD model. Motions of the mapping platform were much smaller (up to1m/s), when compared to the scale of target indoor spaces(up to 50m). Experimentally, we found that the translationmotion of the mapping platform showed a small impact onthe reprojection loss term, which leads to unstable convergence of extrinsic parameters. Contrary, if we fix the translation part of extrinsic parameters, all camera parametersconverge better.4. Visual localization benchmarkIn this section, we benchmark state-of-the-art visual localization algorithms on the proposed datasets. We selectedrelevant approaches representing the different algorithmicgroups namely structure, image retrieval, scene coordinateregression, and absolute pose regression based methods.4.1. Evaluated methodsStructure-based methods use an SFM model [47, 55, 26,51, 39] as a representation of the environment in whichnew images can be registered in order to localize them.This is done with local feature matching using descriptors such as SIFT [32], R2D2 [43, 44], D2-Net [16] orSuperPoint [15, 46]. Image retrieval using global imagerepresentations such as DenseVLAD [59], NetVLAD [2],APGeM [42], or DELG [10] can be used to select the imagepairs to match [60, 58, 45] rather than brute force matchingof the entire reconstruction. Structure-based methods perform very well on a large variety of datasets but come withthe burden of constructing and maintaining large 3D maps.For our experiments, we chose a custom pipeline consisting of two stages: mapping and localization. For mapping, we start by selecting the image pairs to match using the global image representations mentioned above, we3232
Test set - Galaxy imagesAlgorithm / Accuracy th.structure-based methodsAPGeM [42] SIFT [32]DELG [10] SIFT [32]DenseVLAD [59] SIFT [32]NetVLAD [2] SIFT [32]SIFT [32] vocab. tree (COLMAP [52])APGeM [42] D2-Net [16]DELG [10] D2-Net [16]DenseVLAD [59] D2-Net [16]NetVLAD [2] D2-Net [16]APGeM [42] R2D2 [43]DELG [10] R2D2 [43]DenseVLAD [59] R2D2 [43]NetVLAD [2] R2D2 [43]ESAC [9]1 expert10 experts20 experts50 expertsPoseNet [27]0.1m,1 Dept. B10.25m,2 1m,5 0.1m,1 Dept. 1F0.25m,2 1m,5 0.1m,1 Dept. 4F0.25m,2 1m,5 0.1m,1 Metro St. B10.25m,2 1m,5 .00.019.223.626.10.00.033.937.539.90.00.1m,1 Metro St. B20.25m,2 1m,5 Table 4: Results of various visual localization methods on the 5 NAVER LABS datasets, with the percentages of successfully localized test images within three thresholds for each datasets. The best method is shown in bold, the second best isunderlined.then extract the local keypoints and match them using crossvalidation and geometric verification, and finally, we compute the 3D points using COLMAP’s [52] point triangulator. For localization, for each query image we first retrievethe 20 most similar database (map) images, we then extractthe local keypoints and match the 20 image pairs again using cross validation and geometric verification. Since thedatabase images are associated with 3D points from themap, we can use the resulting 2D-3D matches to computethe camera pose. For this, we use COLMAP’s image triangulator. We
ronments differ from outdoor scenes in important aspects. For example, while the lighting conditions in indoor spaces tend to be more constant, indoor spaces are typically ove-ments can cause large changes in viewpoint. Dynamic ob-jects