Transcription
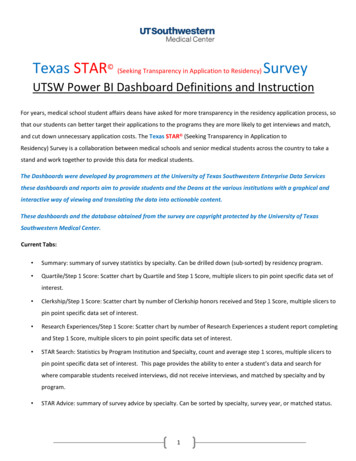
Texas STAR (Seeking Transparency in Application to Residency) SurveyUTSW Power BI Dashboard Definitions and InstructionFor years, medical school student affairs deans have asked for more transparency in the residency application process, sothat our students can better target their applications to the programs they are more likely to get interviews and match,and cut down unnecessary application costs. The Texas STAR (Seeking Transparency in Application toResidency) Survey is a collaboration between medical schools and senior medical students across the country to take astand and work together to provide this data for medical students.The Dashboards were developed by programmers at the University of Texas Southwestern Enterprise Data Servicesthese dashboards and reports aim to provide students and the Deans at the various institutions with a graphical andinteractive way of viewing and translating the data into actionable content.These dashboards and the database obtained from the survey are copyright protected by the University of TexasSouthwestern Medical Center.Current Tabs: Summary: summary of survey statistics by specialty. Can be drilled down (sub-sorted) by residency program. Quartile/Step 1 Score: Scatter chart by Quartile and Step 1 Score, multiple slicers to pin point specific data set ofinterest. Clerkship/Step 1 Score: Scatter chart by number of Clerkship honors received and Step 1 Score, multiple slicers topin point specific data set of interest. Research Experiences/Step 1 Score: Scatter chart by number of Research Experiences a student report completingand Step 1 Score, multiple slicers to pin point specific data set of interest. STAR Search: Statistics by Program Institution and Specialty, count and average step 1 scores, multiple slicers topin point specific data set of interest. This page provides the ability to enter a student’s data and search forwhere comparable students received interviews, did not receive interviews, and matched by specialty and byprogram. STAR Advice: summary of survey advice by specialty. Can be sorted by specialty, survey year, or matched status.1
Full Screen View: By clicking the small bars on the upper left hand corner, you can enlarge the dashboard (make it fullscreen) eliminating some of the scrolling necessary.The ‘Summary’ page aims to provide the Deans, specialty advisors, and students with an overview of total applicationsand their outcome, alongside aggregate information pertinent to applicant’s Interviews, Clerkships Honors, andPublications amongst other such information. The data on the report can be further focused to show applicantinformation only from a particular state, region, and match status of the applicant via the slicers (filters) available to theleft of the report.Definitions of the reported measures are noted below.2
MeasureDescriptions and assumptionsAverage Of Step Score 1Average of range selected. Eg when range is 240 244 then we use 242; Minis 190 Max is 272Average Of Step Score 2Average of range selected. Eg when range is 240 244 then we use 242; Minis 190 Max is 272Total # ApplicantsNumber of all applicantsTotal # Matched ApplicantsNumber of matched applicantsMatched ApplicantpercentageMatched applicants/All applicantsTotal # ApplicationsTotal number of applications by studentsMatched Applications# Matched applicationsMatched Application %# Matched applications/Total # applicationsAverage # of interview offersBased on programs checked on matrixAverage # of interviewsattendBased on student’s survey answer (Removed all responses with answersover 40 since the data was unreliable)Geographic ConnectionStudent report of a geographic connection to a particular residencyprogram (family, education, etc.)Home region/Home StateRelated to the student’s home medical school. Region relates to the AAMCGSA region. State is reported only when there were more than onemedical school participating to protect the identity of the students.3
Operation Tips: Drilling down to residency program level data on Summary tabClick on these icons to drilldown further to see residency program level data on the reportAlternatively you can right click an on specific cell to also drill down.4
Multiple Selections on the Power BI ‘Slicers’These selections to the left of thereport are called ‘Slicers’. They allowthe user to ‘slice’ the data in ways tomeaningful to them To select multiple options on a particular slicer hold on “CTRL” key and while left clicking on the available options.5
Slicer Dropdown listClick the arrow on the drop down list to expand/retract the list Clearing the selections on slicersPower BI retains the selections made to the report’s slicers and filters. Look for an eraser icon when hoveringover the title of the selected slicer to clear all selections made and bring the report back to its original state.6
Sorting the dataHover over any column title and click on the arrow to see the data sorted in ascending or descending order ofthe particular metric. Viewing and exporting dataHovering your mouse over towards the top right corner of the page will reveal 4 icons.7
The last 3 radio button icon has a drop down list which allows you export the data.8
The ‘Quartile/Step 1’, The ‘Clerkship/Step 1’, and The ‘Research Experiences/Step 1’ pages provide the user with agraphical representation of the student’s average score by quartile and the matched status of their application(Interview offer/No Interview Offer/Matched Program). The user can further drilldown to a particular specialty, and theinstitution they applied to, or a combination. They can also limit the data based on geography of the student by using thehome state or home region slicers (filters) available to the left of the report. Also available is if an away rotation wascompleted at that program.Definitions of the reported measures are noted below.MeasureDescriptions and assumptionsQuartileRanking system based on student’s homeinstitutionAvg Of Step Score 1 or Step Score2Avg of range selected. Eg when range is 240 244then we use 242; Min is 190 Max is 272SpecialtyProgram InstitutionResidency program which student has applied toAway RotationWhether student completed an away rotation at aprogramHome StateStudent’s Medical school state (Note: State is onlyincluded if there were more than two medicalschools in the state that participated in thesurvey)Home RegionStudent’s Medical school region based on theAAMC regionsGeographic connectionStudent indicated they had a connection to theregion for that particular program (family, prioreducation, etc.)9
Filtering data on Scatter chartWhen you click on a circle, the circle itself will be high-lighted and detailed data will be filtered on lower panels. If youuse the control key to select multiple circles, all of the results will report at the bottom. PLEASE NOTE: The dashboardwas unable to label the 1st quartile at the top, so the rows are unlabeled. Please note the axis labels belowcorresponding to each quartile row on the Quartile/Step 1 Score tileDid notanswer orN/A10
Filtering data on the detailsWhen you click on a particular row on the bottom left, it will be highlighted and its detail level information willbe filtered and displayed on the right panel. To cancel this filter simply click the row again. You can also use thecontrol key to select multiple students and have all of their program information filtered on the right.This section is the only one in which you can filter the results in order to see all the programs a specific studentapplied to, which ones they interviewed at, and where they matched at the same time. Looking at the entirepicture off a specific applicant helps put the information into context (geographical preference, program typeetc.).11
Enlarging the student and application sectionYou can make the student and application detail enlarge simultaneously by clicking the following button. Search institutionSince the list of residency program institutions is long, a search function has been made available.When you click on the drop down list of institutions, there is a magnifying glass. Type in a keyword next to themagnifying glass, and a list of institutions will show up for you to choose from. If you need to choose multipleinstitutions, hold on to CTRL key while you make your selections.12
The ‘Star Search’ page is meant to show the count of applicants and their average Step 1 score at each of their appliedresidency program institutions by specialty. This report is best used when filtered for particulars.This dashboard allows a student to enter their own Step 1 score, class rank, or # of clerkship honors and identify whichspecialties and which programs within those specialties other medical students with similar criteria obtained interviewsor matched depending on your filer terms.13
You can sort on the “Star Search” page by going to the right top corner. There are three options: Sort by Program, Sortby Application Count, and Sort by Step 1 score.The results would show as demonstrated below for a sort by Step 1.14
The STAR Advice PageSummary of survey advice by specialty. Can be sorted by specialty, survey year, or matched status.You can sort on the STAR Advice tab by clicking on any of the panels on the left side.15
Participating Medical Schools and Response RateTotalInstitutionTotalAlbany Medical CollegeBaylor College of MedicineBoston University School of MedicineChicago Medical School, Rosalind FranklinUniversity of Medicine and ScienceCooper Medical School of Rowan UniversityCreighton University School of MedicineEastern Virginia Medical SchoolFlorida Atlantic University Charles E. SchmidtCollege of MedicineFlorida State University College of MedicineGeisinger Commonwealth School of MedicineIcahn School of Medicine at Mount SinaiKeck School of Medicine of the University ofSouthern CaliforniaLewis Katz School of Medicine at Temple UniversityLong School of Medicine, UT Health San AntonioLouisiana State University School of Medicine ShreveportLSU New Orleans School of MedicineMayo Clinic School of MedicineMcGovern Medical School at The University ofTexas HoustonMedical University of South CarolinaMichigan State University College of HumanMedicineNetter School of MedicineNortheast Ohio Medical UniversityNorthwestern University Feinberg School ofMedicineOhio State University College of MedicineOregon Health & Science 553.33%8619541.03%5214734.01%
InstitutionRush Medical CollegeSidney Kimmel Medical College at Thomas JeffersonUniversityStony Brook University School of MedicineSUNY Downstate Medical CenterSUNY Upstate Medical UniversityTexas A&M College of MedicineTexas Tech University Health Sciences Center SOMThe George Washington University School ofMedicine & Health SciencesThe University of North Texas Health Science CenterThe Warren Alpert Medical School of BrownUniversityTTUHSC El Paso Paul L. Foster School of MedicineTulane University School of MedicineUniformed Services University of the HealthSciencesUniversity of Alabama School of MedicineUniversity of Arizona College of Medicine- PhoenixUniversity of Arizona College of Medicine- TucsonUniversity of Central Florida College of MedicineUniversity of Central Michigan College of MedicineUniversity of Colorado School of MedicineUniversity of Illinois College of Medicine (4campuses)University of Kentucky College of MedicineUniversity of Louisville School of MedicineUniversity of Massachusetts Medical SchoolUniversity of Miami Miller School of MedicineUniversity of MinnesotaUniversity of Mississippi School of MedicineUniversity of Nevada, Reno School of MedicineUniversity of New Mexico School of MedicineUniversity of North Carolina School of 548.09%6914546.90%287040.00%3210031.00%5818032.22%
InstitutionUniversity of Oklahoma College of MedicineUniversity of South Carolina School of MedicineUniversity of South Florida Morsani College ofMedicineUniversity of Tennessee HSC College of MedicineUniversity of Texas Medical BranchUniversity of Texas Southwestern Medical SchoolUniversity of Utah School of MedicineUniversity of Vermont Larner College of MedicineUniversity of WashingtonUniversity of Wisconsin School of Medicine andPublic HealthVanderbilt University School of MedicineVirginia Tech Carilion School of MedicineWake Forest School of MedicineYale A
Boston University School of Medicine 52 144 36.11% Chicago Medical School, Rosalind Franklin University of Medicine and Science 77 197 34.01% Cooper Medical School of Rowan University 48 74 63.51% Creighton University School of Medicine 84 153 53.59% Eastern Virginia Medical School 73 150 46.67%

