Transcription
Downloaded from orbit.dtu.dk on: Jul 02, 2022Cyclic Voltammograms from First PrinciplesKarlberg, Gustav; Jaramillo, Thomas; Skulason, Egill; Rossmeisl, Jan; Bligaard, Thomas; Nørskov, JensKehletPublished in:E C S TransactionsLink to article, DOI:10.1149/1.2780988Publication date:2007Document VersionPublisher's PDF, also known as Version of recordLink back to DTU OrbitCitation (APA):Karlberg, G., Jaramillo, T., Skulason, E., Rossmeisl, J., Bligaard, T., & Nørskov, J. K. (2007). CyclicVoltammograms from First Principles. E C S Transactions, 11(1), 759-768. https://doi.org/10.1149/1.2780988General rightsCopyright and moral rights for the publications made accessible in the public portal are retained by the authors and/or other copyrightowners and it is a condition of accessing publications that users recognise and abide by the legal requirements associated with these rights. Users may download and print one copy of any publication from the public portal for the purpose of private study or research. You may not further distribute the material or use it for any profit-making activity or commercial gain You may freely distribute the URL identifying the publication in the public portalIf you believe that this document breaches copyright please contact us providing details, and we will remove access to the work immediatelyand investigate your claim.
ECS Transactions, 11 (1) 759-768 (2007)10.1149/1.2780988 The Electrochemical SocietyCyclic Voltammetry from First-PrinciplesG. S. Karlberga, T. F. Jaramillob, E. Skulasona, J. Rossmeisla, T. Bligaarda and J. K.NørskovaaCenter for Atomic-scale Materials Design, Department of Physics, Technical Universityof Denmark, DK-2800 Kgs. Lyngby, DenmarkbCenter for Individual Nanoparticle Functionality, Department of Physics, TechnicalUniversity of Denmark, DK-2800 Kgs. Lyngby, DenmarkCyclic voltammetry is a fundamental experimental tool forcharacterizing electrochemical surfaces. Whereas cyclicvoltammetry is widely used within the field of electrochemistry, away to quantitatively and directly relate the cyclic voltammogramto ab initio calculations has been lacking, even for the simple caseof electroadsorption and desorption of H. In the following wederive the cyclic voltammogram for H adsorption and desorptionon Pt(111) and Pt(100) based solely on density functional theorycalculations and standard molecular tables. The method will alsobe extended to include the potential dependence of the OHcoverage during electrochemical water splitting on Pt(111) andPt3Ni(111).IntroductionCyclic voltammetry is perhaps the most important and widely utilized technique in thefield of analytical electrochemistry. This method provides an abundance of quantitativeinformation regarding surface electrochemical phenomena, including theadsorption/desorption of species such as H* and OH*, reduction/oxidation of the electrodesurface, reduction/oxidation of dissolved analytes (for example, Fe2 /Fe3 ), as well aselectrocatalytic turnover (for example, H2 evolution or O2 reduction). Many general andspecific mathematical relationships have been developed to describe spectra recordedusing cyclic voltammetry (1,2,3,4,5,6,7,8). Such expressions are crucial in theinterpretation of measured data; however, a direct connection between the densityfunctional theory calculations and the electrode potential has been lacking.In recent years, much electrochemical research has been directed toward the discoveryof new materials (mostly alloys) for improved catalysis of energy conversion reactions,such as those ubiquitous in fuel cells or electrolyzers. It has been well-established thatcatalytic activity is directly related to the adsorption/desorption of reaction intermediateson the catalyst surface (9,10). As cyclic voltammetry provides such information, forinstance adsorption of H* in the case of H2 evolution and OH* and/or O2* in the case of O2reduction, the ability to predict such behavior on new materials as a function of electrodepotential would be of tremendous benefit for electrocatalyst discovery.Herein, we present theoretical cyclic voltammograms of archetypical Pt(111) andPt(100) in the region of hydrogen under-potential deposition (H-UPD), produced solelyfrom Density Functional Theory (DFT) calculations and standard molecular tables. The759Downloaded 29 Jun 2010 to 192.38.67.112. Redistribution subject to ECS license or copyright; see http://www.ecsdl.org/terms use.jsp
ECS Transactions, 11 (1) 759-768 (2007)theoretical CVs show excellent agreement with those measured experimentally,indicating that predicting CVs behavior on new materials is a tangible goal that could berealized in the not-too-distant future. The method will also be extended to include cyclicvoltammograms for water dissociation on Pt(111) and Pt3Ni(111). Also in this case theagreement with experiments is excellent. This good agreement with experimentalmeasurements provides further support for the underlying theoretical framework fordescribing electrochemical reactions (11), and also opens up for a stronger connectionbetween experiment and theory.MethodsThe density functional theory calculations are performed using a plane-wavepseudopotential implementation (12,13) employing the ultra-soft pseudopotentials ofVanderbilt (14) to represent the ionic cores. For all calculations the RPBE (15) flavor ofthe exchange and correlation functional has been used. Three and four layer thickperiodic 2 2 supercells were used for to represent the Pt(111) and Pt(100) surfaces,respectively, all at the RPBE lattice constant of Pt (4.02 Å). For Pt(111) a 2 3 cell withthree layers was also used. In all cases the bottom two layers were kept fix while the toplayers were allowed to relax. The plane wave cutoff was 26 Ry, and the k-points weresampled using a 4 4 1 and 4 6 1 Monkhorst-Pack reduced grids. Dipole correction wasused in all cases. Based on the DFT results a lattice model is developed for the H-Hinteraction. We solve the lattice model by use of standard Metropolis Monte Carlocalculations (16).In order to construct a theoretical CV for H adsorption a theoretical counterpart to thestandard hydrogen electrode (SHE) needs to be established. A method to do that has beenpresented previously (11), and it will be summarized here for clarity. Consider thefollowing two reactions:1/2H 2 (g) H e [1]H e H *[2]where H* refers to H adsorbed on the surface. At the conditions used to establish thestandard hydrogen electrode potential, T 300 K, pH 1 bar and pH 0, the reaction2free energies of all these reactions are zero. Consequently, the free energies of all threestates, 1/2H 2 (g) , ( H e ), and H* are equal. This defines U 0 V. At another potentialthe chemical potential of the electrons e- is changed by -eU with respect to H 2 in the gasphase. For the conditions applicable for this investigation it is reasonable to assume thatreaction [2] quickly reaches equilibrium. Hence, the reaction free energy of reaction [2]can be obtained by the Born-Haber cycle: H e 1/2H 2 ( g) H * . Adding thechanges in free energy during this cycle we obtain the following reaction free energy forreaction [2], G(U) G0 eU ,[3]where G0 is the free energy of reaction for760Downloaded 29 Jun 2010 to 192.38.67.112. Redistribution subject to ECS license or copyright; see http://www.ecsdl.org/terms use.jsp
ECS Transactions, 11 (1) 759-768 (2007)1/2H 2 ( g) H *[4]at standard conditions. This free energy can be directly calculated using DFT andstandard molecular tables via G0 E ZPE T S.[5]Here E and ZPE are the differential adsorption energy for H and the difference in zeropoint energy for reaction [4] as given by DFT. S is the difference in entropy. At a pHdifferent from zero the entropy for the H ion will change. Expression [5] can becorrected for that by adding G( pH) kB T ln[H ] k B T pH .The effect of the surrounding water and the presence of a local electric field (i.e. theelectric double layer) on the differential adsorption energy of H will be taken into accountexplicitly in the DFT calculations that follow.The G0 defined above will depend on the coverage, θ, of hydrogen. The dependencearises both because of the direct H-H interaction between the adsorbed H atoms, and viathe dependence on coverage for the configurational entropy of the adsorbed H atoms.Assuming that the adsorbed hydrogen atoms on the surface are always in equilibriumwith the protons in the solution, i.e. that G(U) 0, we obtain:U(θ ) G0 (θ ) /e.[6]The way this equality can be maintained is by changing the coverage of adsorbed H.Hence, from the reactions above we can extract the equilibrium coverage of H on thesurface as a function of potential. This in turn can be directly related to the currentmeasured in a cyclic voltammogram as will be shown below.Cyclic voltammetry entails the measurement of current flowing through an electrodeduring a linear sweep of its potential versus a known electrochemical reference, such asthe standard hydrogen electrode. The resulting electrochemical ”spectrum” is comprisedof features produced by both Faradaic processes, associated with electron transfer, andnon-Faradaic processes, associated with charging of the electrical double-layer. Thefeatures emerge at the potentials in which such processes occur, while the measuredcurrent reflects the net rate of all processes occurring at that potential. In the followingwe will contruct a theoretical CV which only concerns H adsorption and desorption. Ourstarting point is the derivative of U with respect to time:dU dU dθ dQ dθ dQ dtdt[7]Here Error! is the linear sweep rate of the experiment and Error! is the measuredcurrent. With a transfer of one electron per adsorbed H, the relation between the chargetransferred per area Q and the coverage θ is Q Qtot θ . Here Qtot is e times the density of761Downloaded 29 Jun 2010 to 192.38.67.112. Redistribution subject to ECS license or copyright; see http://www.ecsdl.org/terms use.jsp
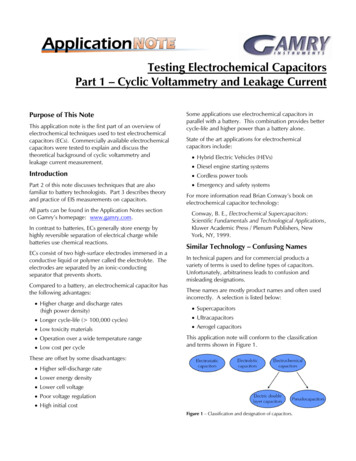
ECS Transactions, 11 (1) 759-768 (2007)Pt atoms in the surface layer. Introducing K for the sweep rate and i(t) for the current weobtain:i(t) KQtot1dθ KQtotdUdUdθ[8]ResultsH on Pt(111) and Pt(100)Using DFT we have calculated the differential adsorption energy for H on Pt(111) andPt(100), see Figure 1. To test the effect of a water surrounding and an electric field wehave calculated the differential adsorption energy for H both with out water and withwater and electric field. As can be seen from part (a) of Figure 1, the effect of water andelectric field is negligible. This minor effect of water and electric field on H adsorptionhas been observed previously (17).For a coverage up to 1 monolayer (ML) on Pt(111) the three fold hollow FCC site isthe most stable. For a higher coverage the one-fold ontop site is most stable. On Pt(100)the two-fold bridge site is the most stable both at below and slightly above 1 monolayercoverage. Here one monolayer corresponds to 1 H atom per surface Pt atom.An important feature to note in part (a) of Figure 1 is the jump in E as the coveragebecomes larger than 1. This jump is due to the increased H-H interaction when a newhigh symmetry site becomes occupied at a coverage above 1 ML. A similar but lesspronounced jump can be observed for the Pt(100) surface (not shown), where E goesfrom -0.43 eV at 1 ML to -0.19 eV at 1.25 ML. The potentials at which these stateswould become occupied roughly corresponds to 0.4 V and 0.0 V for the Pt(111) andPt(100) surfaces. Hence, in the analysis that follows the H coverage will be less than orequal to 1 monolayer.The first step towards generating a CV is to obtain the coverage of H as a function ofpotential. Assuming a charge transfer of one electron per Hydrogen atom the coveragecan immediately be transformed to surface charge density. We obtain the coverage versusvoltage graph by using the free energy of adsorption given by equation [3] in aMetropolis Monte Carlo simulation (16). In this simulation a H atom isadsorbed/desorbed from an empty/filled site if G(U) for that process is negative. If the G for that process positive it can still occur with a probability proportional to exp( G(U)/kBT). The local differential adsorption energy is evaluated using a lattice modeland a model Hamiltonian. We use a simple model Hamiltonian including only pairwisenearest neighbor interaction:762Downloaded 29 Jun 2010 to 192.38.67.112. Redistribution subject to ECS license or copyright; see http://www.ecsdl.org/terms use.jsp
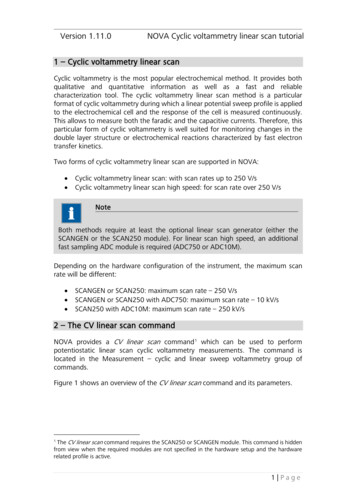
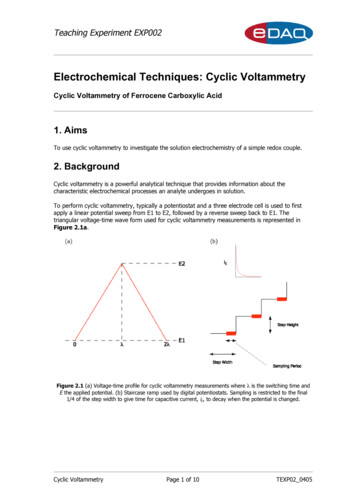
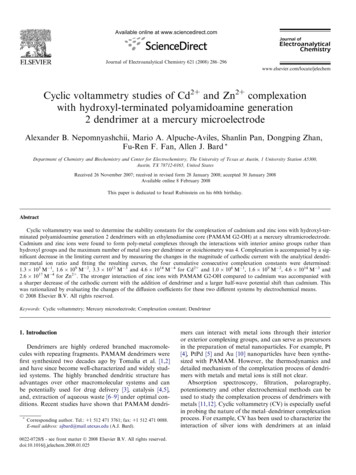
ECS Transactions, 11 (1) 759-768 (2007) E E 0 Jσ i[9]iwhere E0 is the differential heat of adsorption without any nearest neighbors, J is theinteraction parameter and σi is an occupation number. As can be seen from part (b) ofFigure 1 the H-H interaction is to a high accuracy described a pair-wise nearest neighborinteraction on both Pt(111) and Pt(100).Another less rigorous but more simple and transparent way to make the CV is toexpress the differential adsorption energy E as a function of coverage, see part part (c)of Figure 1. It turns out that the DFT data points to a quite good approximation can befitted to a straight line. Before plugging this into the method outlined above, equation [5]needs to be corrected for the configurational entropy, which in the case of the Metropolismethod was included a priori. We include this by adding the differential configurationalentropy of non-interacting particles, 1 θ Sconf k B ln θ [10]to equation [5]. This modified free energy is then differentiated to give:dU1 1 a kB T θ (1 θ ) dθe [11]where a is the slope of the E(θ) curve in Figure 1 (b). Combining equation [11] withequation [8] one clearly sees how both the H-H interaction, and the configurationalentropy affects the CV curve for H adsorption and desorption. Although explicit use ofequation [11] requires a numeric inversion of the U(θ) function, it is henceforthtermed ”analytic” to distinguish it from the Monte Carlo approach.In the parts (a) and (b) of Figure 2 the results of the Metropolis and analyticsimulations are shown for T 274 K. Part (c) and (d) show the corresponding cyclicvoltammogram for a sweep rate of 50 mV/s. Finally, part (e) and (f) show thetemperature dependence of the CV peaks as given by the Metropolis algorithm. Whereasexperimental measurements of the CV for H adsorption and desorption can be found inmany references since the pioneering work by Clavilier (18,19) we chosen to simulate theCVs for the temperatures presented in an investigation by Markovic and co-workers (20).The agreement with experiments very good. For both Pt(111) and Pt(100) the chargeversus potential curves, and the i-V characteristics are quite similar to the experimentalones presented in ref. (20). Also the experimental temperature dependence is reproduced.However, our model does not include hydrogen evolution, and hence we do notreproduce the region below about 0.05 V where the experimental current is dominatedby the hydrogen evolution current. Another difference compared to experiments concernsfeatures related to the anions of the electrolyte. Whereas several authors have mademodels for this on the Pt(111) surface (4,21) we here focus only on the adsorption or763Downloaded 29 Jun 2010 to 192.38.67.112. Redistribution subject to ECS license or copyright; see http://www.ecsdl.org/terms use.jsp
ECS Transactions, 11 (1) 759-768 (2007)desorption of H, which can be directly related to first-principles calculations. Finally, wedo not model the capacitance of the electric double layer. Hence, our model predicts zerocurrent when there is no adsorption or desorption of H from the surface.Figure 1. Differential adsorption energy E for H on Pt(111) and Pt(100). Part (a)shows the effect of a water bilayer and electric field for the Pt(111) electrode. In parts (b)and (c) E is plotted versus the number of H nearest neighbors on the surface and the Hcoverage, respectively.764Downloaded 29 Jun 2010 to 192.38.67.112. Redistribution subject to ECS license or copyright; see http://www.ecsdl.org/terms use.jsp
ECS Transactions, 11 (1) 759-768 (2007)Figure 2: Charge deposition due to hydrogen adsorption versus potential ((a),(b)) andtheoretical cyclic voltammograms for Pt(111) ((c),(e)) and Pt(100) ((d),(f)). The CVs arebased solely on input from standard tables of gas phase molecules and output fromdensity functional theory. In the figure results are shown both from Monte Carlo765Downloaded 29 Jun 2010 to 192.38.67.112. Redistribution subject to ECS license or copyright; see http://www.ecsdl.org/terms use.jsp
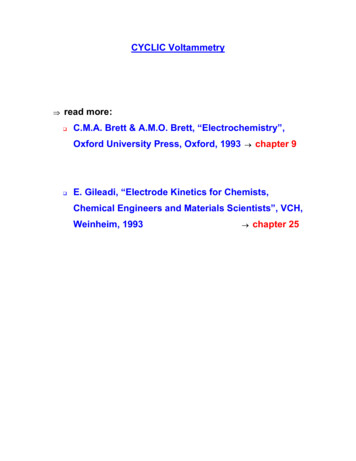
ECS Transactions, 11 (1) 759-768 (2007)calculations where all interactions are taken into account, and an analytical model wherethe entropy is that of non interacting particles.OH on Pt(111) and Pt3Ni(111)Having established this methodology another interesting case to study with greatrelevance for fuel cell engineering is oxygen reduction on Pt(111) and Pt3Ni(111). Thissystem has recently been studied both experimentally (22,23,24) and theoretically (24).Since there are experimental data for the OH coverage versus electrode potential duringelectrochemical water splitting on these systems (24), we will not proceed all the way tothe CV in this case. To calculate the OH coverage versus electrode potential we need toconsider the reaction:H 2O OH * H e [12]On these surfaces the excess barrier for this reaction is most probably small since thereaction appears to be totally reversible from CVs in both acid and alkaline solutions onPt(111) (20). To simplify the analysis we will assume that the adsorbed OH moleculesdoes not interact with each other. This assumption is motivated since a mixed OH-H2Ostructure will be formed during water dissociation, where OH molecules will not benearest neighbors (11,25). Furthermore, we will assume that the coverage will not exceed1/3 of a monolayer of OH. The reason being that at a higher coverage OH molecules willindeed be neighbors. Since the hydrogen bond strength between OH molecules is lessthan half of that between an OH molecule and H2O molecule (25), the OH-OH neighborsituation would give rise to an equivalent to the step in reaction energy as was observedfor a H coverage larger than 1 monolayer, see part (a) of Figure 1. Under the aboveassumptions, and based on the methodology above we can write the potential dependenceof the OH coverage as:113 1 exp( G eU)θ (U) [13]In the above expression a maximum OH coverage of 1/3 of a monolayer has beenassumed. From ref. (24) one can obtain the G values for OH adsorption to be 0.80 eVand 0.93 eV for Pt(111) and Pt3Ni(111), respectively. Inserting these numbers intoequation [13] a graph of the OH coverage versus U can be constructed, see Figure 3. Ascan be seen the agreement is excellent also in this case.766Downloaded 29 Jun 2010 to 192.38.67.112. Redistribution subject to ECS license or copyright; see http://www.ecsdl.org/terms use.jsp
ECS Transactions, 11 (1) 759-768 (2007)Figure 3: Coverage of OH on Pt(111) and Pt3Ni(111) versus electrode potential fromtheory (equation [13]) and experiments reported in ref. (23).SummaryIn this paper a methodology to calculate cyclic voltammograms directly from densityfunctional theory calculations and molecular tables have been presented. The first testcase was H adsorption on Pt(111) and Pt(100). The agreement with experiments isexcellent. The same method was also tested against recent experimental data for thepotential dependence of the OH coverage during electrochemical water dissociation onPt(111) and Pt3Ni(111). Even for this case the agreement is very good. This indicates thatwe now have a direct link between adsorption energies, as for instance obtained fromdensity functional theory calculations, and cyclic voltammograms.AcknowledgmentsThis work was supported by the Danish Research Council for the Technical Sciencesand the European Community program FCANODE. The Danish Center for ScientificComputing contributed funding for the computer time.References1. J. O. M. Bockris and S. U. M. Khan. Surface electrochemistry. Plenum press,(1993).767Downloaded 29 Jun 2010 to 192.38.67.112. Redistribution subject to ECS license or copyright; see http://www.ecsdl.org/terms use.jsp
ECS Transactions, 11 (1) 759-768 (2007)2. R. Greef, R. Peat, L. M. Peter, D. Pletcher, and J. Robinson. Instrumental methodsin electrochemistry. Ellis Horwood, (1990).3. L. Blum, D. A. Huckaby, N. Marzari, and R. Car., J. Electroanal. Chem., 537, 7(2002).4. M. T. M. Koper and J. J. Lukkien,. J. Electroanal. Chem., 485, 161 (2000).5. N. P. Lebedeva, M. T. M. Koper, E. Herrero, J. M. Feliu, and E. A. van Santen,Angew. Chem. Int. Ed., 487, 37 (2000).6. P. A. Rikvold, J. Zhang, Y. E. Sung, and A. Wieckowski., Electrochim. Acta., 41,2175 (1996).7. L. Blum, D. A. Huckaby, and M. Legault., Electrochim. Acta, 41, 2207 (1996).8. G. Jerkiewicz. Progress in surface science, 47, 137 (1998).9. P. Sabatier. Ber. Deutchen Chem. Gesellschaft, 44, 1984 (1911).10. R. Parsons. Trans. Farad. Soc., 54, 1053 (1958).11. J. K. Nørskov, J. Rossmeisl, A. Logadottir, L. Lindqvist, J. R. Kitchin,T. Bligaard, and H. Jonsson. J. Phys. Chem. B, 108, 17886 (2004).12. M. C. Payne, M. P. Teter, D. C. Allan, T. A. Arias, and J. D: Joannopoulos. Rev.Mod. Phys., 64, 1045 (1992).13. G. Kresse and J. Furthmuller, Phys. Rev. B, 54, 11169 (1996).14. D. Vanderbilt. Phys. Rev. B., 41, 7892 (1990).15. B. Hammer, L. B. Hansen, and J. K. Nørskov, Phys. Rev. B, 59, 7413 (1999).16. N. Metropolis, A. W. Rosenbluth, M. N. Rosenbluth, A. H. Teller, and E. N.Teller. J. Chem. Phys., 21, 1087 (1953).17. J. Rossmeisl, J. K. Norskov, C. D. Taylor, M. J. Janic and M. Neurock, J. Phys.Chem B, 101, 21833 (2006)18. J. Clavilier. J. Electroanal. Chem., 107, 211 (1980).19. J. Clavilier, R. Faure, G. Guinet, and R. Durand. J. Electroanal. Chem., 107, 205(1980).20. N. M. Markovic, B. N. Grur, and P. N. Ross. J. Phys. Chem. B, 101, 5405 (1997).21. L. Blum, D. A. Huckaby, N. Marzari, and R. Car. J. Electroanal. Chem., 537, 7(2002).22. V. Stamenkovic, B. S. Mun, M. Arenz, K. J. J. Mayrhofer, C. A. Lucas, G. Wang,P. N. Ross, N. M. Markovic. Nature Materials, 6, 241 (2007).23. V. R. Stamenkovic, B. Fowler, M. S. Mun, G. F. Wang, P. N. Ross, C. A. Lucas,M. N. Markovic, Science 315, 493 (2007).24. V. Stamenkovic, B. S. Mun, K. J. J. Mayrhofer, P. N. Ross, M. N. Markovic, J.Rossmeisl, J. Greeley, J. K. Norskov, Ang. Chem. Int. Ed., 45, 2897 (2006).25. G. S. Karlberg and G. Wahnström, J. Chem. Phys., 122, 195705 (2005).768Downloaded 29 Jun 2010 to 192.38.67.112. Redistribution subject to ECS license or copyright; see http://www.ecsdl.org/terms use.jsp
Cyclic voltammetry is a fundamental experimental tool for characterizing electrochemical surfaces. Whereas cyclic voltammetry is widely used within the field of electrochemistry, a way to quantitatively and directly relate the cyclic voltammogram to ab initio calculations has been lacking, even for the simple case