Transcription
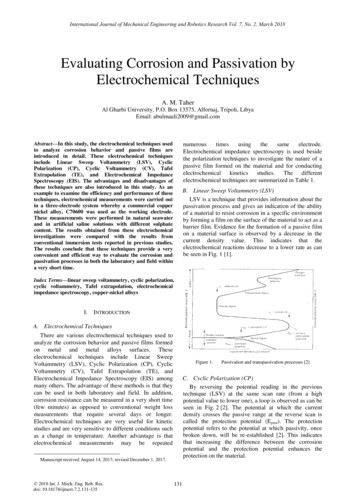
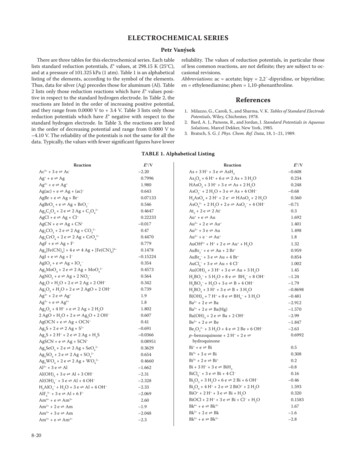
Testing Electrochemical CapacitorsPart 1 – Cyclic Voltammetry and Leakage CurrentPurpose of This NoteThis application note is the first part of an overview ofelectrochemical techniques used to test electrochemicalcapacitors (ECs). Commercially available electrochemicalcapacitors were tested to explain and discuss thetheoretical background of cyclic voltammetry andleakage current measurement.Some applications use electrochemical capacitors inparallel with a battery. This combination provides bettercycle-life and higher power than a battery alone.State of the art applications for electrochemicalcapacitors include: Hybrid Electric Vehicles (HEVs) Diesel engine starting systemsIntroduction Cordless power toolsPart 2 of this note discusses techniques that are alsofamiliar to battery technologists. Part 3 describes theoryand practice of EIS measurements on capacitors. Emergency and safety systemsAll parts can be found in the Application Notes sectionon Gamry’s homepage: www.gamry.com.In contrast to batteries, ECs generally store energy byhighly reversible separation of electrical charge whilebatteries use chemical reactions.ECs consist of two high-surface electrodes immersed in aconductive liquid or polymer called the electrolyte. Theelectrodes are separated by an ionic-conductingseparator that prevents shorts.Compared to a battery, an electrochemical capacitor hasthe following advantages: Higher charge and discharge rates(high power density)For more information read Brian Conway’s book onelectrochemical capacitor technology:Conway, B. E., Electrochemical Supercapacitors:Scientific Fundamentals and Technological Applications,Kluwer Academic Press / Plenum Publishers, NewYork, NY, 1999.Similar Technology – Confusing NamesIn technical papers and for commercial products avariety of terms is used to define types of capacitors.Unfortunately, arbitrariness leads to confusion andmisleading designations.These names are mostly product names and often usedincorrectly. A selection is listed below: Supercapacitors Longer cycle-life ( 100,000 cycles) Ultracapacitors Low toxicity materials Aerogel capacitors Operation over a wide temperature range Low cost per cycleThis application note will conform to the classificationand terms shown in Figure 1.These are offset by some disadvantages: Higher self-discharge rate Lower energy density Lower cell voltage Poor voltage regulation High initial costFigure 1 – Classification and designation of capacitors.
Figure 1 shows a schematic diagram of the classificationof capacitors divided into three major groups:Electrostatic capacitors use metal plates as electrodesthat are separated by a dielectric with low conductivity,e.g. ceramics, glass, or even air.Electrolytic capacitors use a metal foil as anode, e.g.aluminum or tantalum. During the anodizing process ametal oxide is formed which is used as dielectric. Thecathode also consists of a metal foil.Electrochemical capacitors use in contrast toelectrostatic and electrolytic capacitors high-surfaceelectrodes to increase capacitance. They can be dividedin two subgroups depending on the storage mechanism. Electric double layer capacitors (EDLCs) useelectrostatic charge separation to store energy. Asthe name says, a double layer is built up within theinterface between electrolyte and electrode surface. Pseudocapacitors use beside electrostatic chargeseparation also highly reversible Faradaic surfacereactions to store energy.This application note uses only electrochemicalcapacitors for its measurements. Hence electrostatic andelectrolytic capacitors will not be discussed.Generally, EDLCs use activated carbon as electrodematerial. With surface areas of 1000 m2/g or morecapacitances of 200 F/g can be reached.Pseudocapacitors use among others transition metaloxides (e.g. RuO2) or polymers as electrode materials.To discuss several electrochemical techniques tests wereperformed on two different ECs in this note. Commercial3 F EDLCs from Nesscap (P/N ESHSR-0003C0-002R7)and a 1 F PAS pseudocapacitor from Taiyo Yuden(P/N PAS0815LR2R3105) were used. The acronym PASstands for Polyacenic Semiconductor which is aconductive polymer deposited on the electrodes.The data in this note were recorded using Gamry’sPWR800 software. All plots were generated andevaluated using Gamry’s Echem Analyst.Ideal Capacitor CharacteristicsA capacitor is a storage device for electrical charge. Acapacitor’s state-of-charge is easily measured. The storedcharge of an ideal capacitor is proportional to thevoltage, given by Equation 1:Q C UEq 1Q is the capacitor’s charge in ampere-seconds (As) orcoulombs (C), C is the capacitance in farads (F), and U isthe voltage between the device’s terminals in volts (V).The energy E stored in a capacitor can be calculated byEquation 2. The unit for the energy is joule (J):E 12C U2Eq 2An ideal capacitor with no current flow will store energyand charge for ever.Power drawn from a capacitor during charge or dischargeis proportional to the capacitor’s voltage and theelectrical current, given by Equation 3:P U IEq 3P is the power in watts (W) and I is the electrical currentin amperes (A). An ideal capacitor loses no power orenergy during charge or discharge.Capacitor Non-idealityThe ideal capacitor does not exist. In reality, capacitorshave always limitations and imperfections. The tests inthis application note illustrate these limitations.Voltage limitationsThe description of ideal capacitors did not mentionvoltage limitations. Capacitors can only operate within a“voltage window” with both an upper and lower voltagelimit. Voltages outside this window can cause electrolytedecomposition damaging the device.The range of the voltage window strongly depends onthe electrolyte which can be aqueous or non-aqueous.Generally, aqueous electrolytes are safer and easier touse. However, capacitors with non-aqueous electrolytescan have a much wider voltage window.Commercial single-cell ECs currently have an uppervoltage limit below 3.5 V. For high-voltage applicationsmultiple cells in series are used.All commercial ECs are specified to be unipolar – thevoltage on the plus ( ) terminal must be more positivethan the voltage on the minus (-) terminal. The lowervoltage limit is usually zero volts.ESRReal capacitors suffer from power loss during charge anddischarge. This loss is caused by resistances in electricalcontacts, electrodes, and electrolyte. The sum of theseresistances is called Equivalent Series Resistance (ESR).For ideal capacitors ESR is zero. It is specified on thedata sheet for most commercial capacitors.The power loss PLoss during charge or discharge is givenby Equation 4:PLoss I 2 ESREq 4This power is lost as heat – under extreme conditionsenough heat to damage the device.
The ESR can be modeled as a resistor in series with anideal capacitor.different areas of the electrode surface see differentresistances.Leakage currentAs discussed more precisely in part 3 of this note, thiscomplicates the simple capacitor model into a distributedelement that is also called transmission line model.Ideal capacitors maintain constant voltage withoutcurrent flow from an external circuit. Real capacitorsrequire a current, called leakage current Ileakage, tomaintain constant voltage.Cycle-lifeLeakage current will slowly discharge a charged capacitorthat has no external connections to its terminals. Thisprocess is called self-discharge.An ideal capacitor can be charged and discharged for aninfinite number of cycles. Many commercially availableECs approach this ideal – they are specified for 105 oreven 106 charge/discharge cycles.Ileakage can be calculated using Equation 5, multiplying thecapacitance by the rate of voltage change:In contrast, secondary batteries’ cycle-life specificationsare typically hundreds of cycles.Ileakage CdUdtEq 5The cycle-life for all rechargeable devices depends on theexact conditions under which cycling occurs. Appliedcurrent, voltage limits, device history, and temperatureare all important. Part 2 will go more into detail.Leakage current can be modeled as resistor that isparallel with a capacitor. This model is a simplification ofthe voltage and time dependence of leakage current.Cyclic VoltammetryAs an example, a leakage current of 1 µA on a 1 Fcapacitor held at 2.5 V implies a 2.5 MΩ leakageresistance. The time constant for the self-dischargeprocess would be 2.5·106 seconds – nearly a month.Cyclic Voltammetry (CV) is a widely used technique inelectrochemistry. Early in a development project, CVyields basic information about a capacitiveelectrochemical cell, including:Time effects Voltage windowThe time constant τ for a charge or discharge process ofan ideal capacitor in series with an ESR can be calculatedby Equation 6: Capacitanceτ ESR CEq 6Typically, τ is between 0.1 and 20 seconds. A voltagestep into a capacitor with ESR should create a currentthat exponentially decays towards zero. In a device withleakage current, the post-step current decay stops at theleakage current.Time effects can be caused by slow Faradaic reactionsoccurring at imperfections on the surface of the electrodematerial. Carbon surfaces used for most electrochemicalcapacitors have oxygen containing groups (hydroxyl,carbonyl ) that are plausible reaction sites. Cycle-lifeA comprehensive description of CV is well beyond thescope of this document. Most books describinglaboratory electrochemistry will have at least one chapterdiscussing CV.Description of CVIn a cyclic voltammogram the current I that flows throughan electrochemical cell is plotted versus the voltage Uthat is swept over a given voltage range.A linear voltage ramp is used in the sweep. Often, a CVtest will repetitively sweep the voltage between twolimiting potentials. A pair of voltage sweeps in oppositedirections is called a cycle.Commercial ECs do not show this simple behavior. Asseen further below, commercial capacitors held at aconstant potential take days to reach their specifiedleakage current. The time needed is much greater thanpredicted by τ.A voltage sweep applied to an ideal capacitor creates acurrent given by Equation 7:Dielectric absorption is a phenomenon that can alsooccur on capacitors. It is a short-term time effect and iscaused by non-electrostatic charge storage mechanismswith very long time constants.dU/dt is the scan rate of the linear voltage ramp. For ECtesting the rate is usually between 0.1 mV/s and 1 V/s.Time effects also can be a side effect of porosity inherentin high-capacity electrodes. The farther inside a pore,the more increases the electrolyte resistance. HenceI dQdU CdtdtEq 7Scan rates at the lower end of this range allow slowprocesses to occur but take a lot of testing time. Fastscan rates often show lower capacitances than slowerscan rates. This effect will be discussed below.
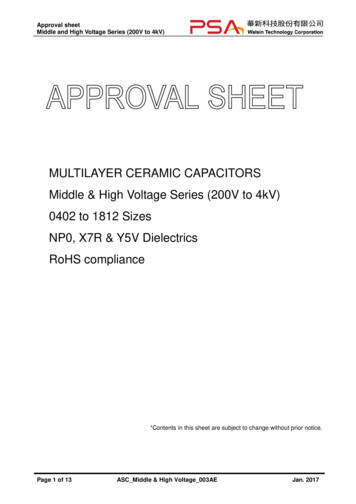
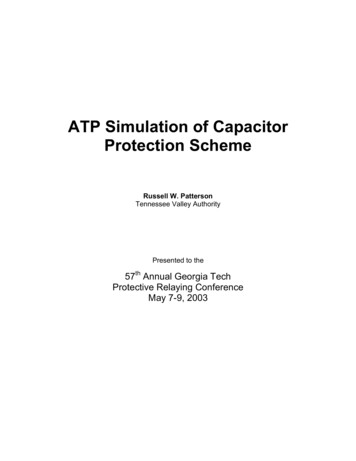
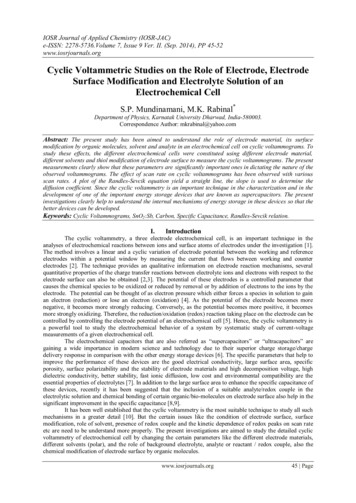
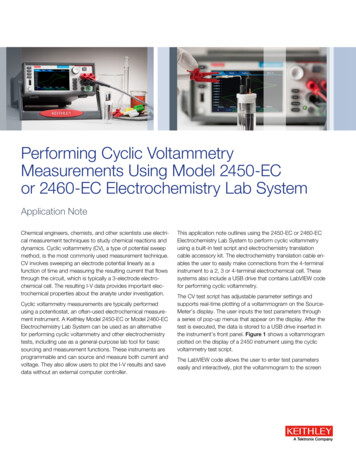
Note that fast scans on high capacitance ECs may requiremore current than the instrument can output or measure.The maximum allowed scan rate can be calculated byrearranging Equation 7 and using the instrument’smaximum current.Three-electrode configurations are common infundamental research where it allows one electrode tobe studied in isolation, without complications from theelectrochemistry of the other electrodes. The threeelectrodes are:Figure 2 shows a typical CV experiment. The capacitorvoltage and current are plotted versus time. The darkercolored, saw-toothed waveforms are the voltage appliedto the cell, the lighter colored curves are the current.Three and a half cycles are shown, each in a differentcolor. Working Electrode – the electrode being tested. Reference Electrode – an electrode with a constantelectrochemical potential. Counter Electrode – generally an inert electrode,present in the cell to complete the electric circuit.Testing of packaged capacitor requires two-electrodeconnections. All potentiostats can operate with this cellconfiguration.The setup for a two-electrode cell configuration with aGamry Instruments system is easy. Both Reference(white) and Counter electrode leads (red and orange) areconnected to the minus (-) terminal of the capacitor.Working electrode (green) and Working sense lead (blue)are connected to the opposite plus ( ) terminal.Theoretical CV plotFigure 2 – Voltage and current versus time are shown for three and ahalf cycles. For details, see text.Figure 3 shows Gamry’s PWR800 setup for a CV test.Four voltage parameters define the sweep range. Thescan starts at Initial E, ramps to Scan Limit 1, reverses,and goes to Scan Limit 2. Additional cycles start and endat Scan Limit 2. The scan ends at the Final E.Figure 4 shows a theoretical CV plot for a 3 F EDLC inseries with a 50 mΩ ESR. The scan rate is 100 mV/s.The scan limits were: Initial E: 0.0 V Scan Limit 1: 2.4 V Final E: 0.0 V Scan Limit 2: -0.5 VThe scan’s start is shown on the plot along with arrowsshowing the direction of the scan. The second cycle isshown in red.Figure 4 – Theoretical CV curve of a 3 F EDLC. Current versus voltageare shown for the first two cycles. For details, see text.For an ideal capacitor (with no ESR) the shape of the CVdiagram would be a rectangle. The height for a chargeand discharge step can be calculated using Equation 7:Figure 3 – Gamry’s PWR800 setup for a CV experiment.CV experiments can be run with two-electrode orthree-electrode cell connections.I CdUdt 3 F 100 mV/s 300 mA
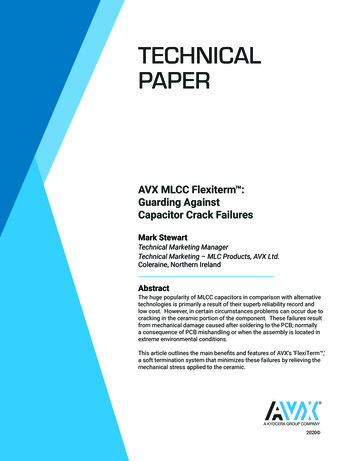
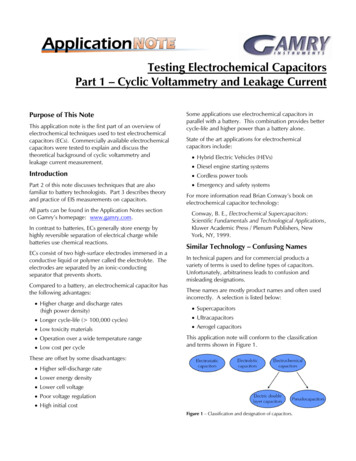
In reality, ESR causes slow rise in the current and roundstwo corners of the rectangle at the beginning of thecharge and discharge process. The time constant τaffects the rounding of the corners.CV on a 3 F EDLCFigure 5 shows a cyclic voltammogram of a 3 F EDLC.This experiment illustrates how CV plots can be used todetermine a capacitor’s voltage window.The scan rate was 100 mV/s. The voltage limits for theexperiment were initially set to 5 V and -3 V which iswell beyond the 2.7 V specification of the EDLC.The calculated capacitance depends on the CV scan rate,the voltage region, and a variety of other variables.Important Note: Capacitor non-ideality precludescalculation of a true capacitance value for a real EC.Commercial ECs have a specified capacitance that isonly valid when a specific experiment is used. Note,techniques such as CV, long-term potentiostatic andgalvanostatic tests, and EIS can give very differentcapacitance values.CV normalized by scan rateFigure 6 shows CV curves of a second 3 F EDLC used toexplain the scan rate dependence on CVs.Scan rates of 3.16, 10, 31.6, 100, and 316 mV/s wereused. The capacitor was held at 0 V for 10 minutesbetween the scans. The scan limits were set to 0 V and2.7 V.Gamry’s Sequence Wizard is a convenient tool forsetting up complex experiments like this. The 0 Vdelay and the CV test were put inside a loop. The scanrate was multiplied by 10 after each cycle.Figure 5 – CV curve of a 3 F EDLC. Current versus voltage are shownfor the first cycle. For details, see text.Notice this plot’s differences in current behavior to thetheoretical CV plot shown in Figure 4. The CV curvedoes not look like a rectangle.The scan was manually reversed when the current startedto increase dramatically. Selecting F2-Skip in Gamry’sFramework reverses a sweep.The first reversal occurred at 3.5 V. Increasing currentindicated the beginning of electrolyte decomposition. Atthe back scan current did start to increase below 0 V.The sweep was manually reversed at -2.7 V.By integration of a segment of this curve the storedcharge can be calculated. The charge is automaticallycalculated by the software. The integrated area ishighlighted red in Figure 5.The integration range was selected using the EchemAnalyst’s Select Range Using Keyboard function.The calculated charge between 1.5 V and 2.5 V is3.195 C. Using Equation 1, the capacitance of thedevice can be calculated:C QU 3.195 C2.5 V - 1.5 V 3.195 FFigure 6 – CV curves of a 3 F EDLC with varying scan rates.( ) 316 mV/s, ( ) 100 mV/s, ( ) 31.6 mV/s, ( ) 10 mV/s,( ) 3.16 mV/s. For details, see text.All CV curves show the same shape. ESR leads torounded corners in the CV curve. Differences occur inthe current that increases with increasing scan rate.Figure 7 shows the same CV curves normalized bydividing all currents by the scan rate.After normalization, the Y-axis unit is As/V whichcorresponds to capacitance in farads. This note will callthe Y-axis of a normalized CV plot apparent capacitanceCapp.
Use in the Echem Analyst’s CV menu the NormalizeBy Scan Rate command to normalize CV data.Select each single curve using the Curve Selectorbefore executing this command. Normalization createsa new curve with NSR in its filename.recorded. The 1st, 10th, and 50th cycles are shown. Thescan rate for this test was 100 mV/s.Figure 8 – Different cycles of a CV test of a 3 F EDLC. ( ) 1st cycle,( ) 10th cycle, ( ) 50th cycle. For details, see text.Figure 7 – Scan rate normalized CV curves of a 3 F EDLC with varyingscan rates. ( ) 316 mV/s, ( ) 100 mV/s, ( ) 31.6 mV/s, ( ) 10 mV/s,( ) 3.16 mV/s. For details, see text.For ideal capacitors, scan rate normalized CV curvessuperimpose and capacitance does not depend on thescan rate.However, EDLCs are not ideal and scan rate normalizedcurves do not superimpose. In Figure 7, Capp is around2.5 F on the curve with the highest scan rate. This curveresembles the CV curve of an ideal capacitor plus ESR.As scan rate decreases, Capp rises and shows strongervoltage dependence. This phenomenon is expected forvoltage-driven chemical reactions.The increase in Capp by decreasing scan rate can beexplained by kinetically slow Faradaic reactions on theelectrode surface and by transmission line behaviorcaused by electrode porosity.The first cycle exhibits a quite bigger current comparedto the others. Initial electrochemical reactions that occuron the surface of the electrodes lead to higher currents.After a while the EC is in steady-state and differences incyclic voltammograms are minor.There is very little change in the data between the 10thand the 50th cycle. Hence this capacitor could be worthof cycle-life testing using cyclic charge-dischargetechniques, described in part 2 of this application note.CV on a pseudocapacitorCV measurements on pseudocapacitors differ from theresults measured on an EDLC.Figure 9 shows a CV test on a 1 F PAS pseudocapacitor.Scan rate was set to 3.16, 10, 31.6, 100, and 316 mV/s.The scan range varied from 0 V to 2.4 V. The capacitorrested at 0 V for 10 minutes between the scans. Thecurves are normalized by scan rate.In the case where slow surface reactions are present, fastscans are over before reactions occur – all current is dueto capacitance. Faradaic current has time to flow whenscan rates are slower, increasing total current and Capp.A distributed element model will show a similar scan ratebehavior. An electrode surface with a high electrolyteresistance will not have time to respond to voltagechanges during a fast scan. In effect, the fraction ofelectrode surface accessible to the electrolyte dependson the scan rate.CV used to estimate cycle-lifeCyclic voltammetry can also differentiate between poorcycle-life and potentially useful cycle-life.Figure 8 shows the result of a CV experiment with a 3 FEDLC. 50 cycles between 1.5 V and 2.7 V wereFigure 9 – Scan rate normalized CV curves of a 1 F PASpseudocapacitor with varying scan rates. ( ) 316 mV/s, ( ) 100 mV/s,( ) 31.6 mV/s, ( ) 10 mV/s, ( ) 3.16 mV/s. For details, see text.There is one major difference compared to normalizedCV plots of EDLCs (Figure 7). At higher scan rates the CV
plots do not superimpose. The device’s Capp depends onvoltage at all scan rates. This is expected, given theFaradaic nature of charge storage of pseudocapacitors.Leakage Current MeasurementFigure 10 shows a leakage current measurement on anew 3 F EDLC. Ileakage is plotted logarithmically versustime and was measured for five days. The capacitor wascharged to 2.5 V potentiostatically and held at thispotential.Leakage current can be measured in at least two ways: Apply a DC voltage to a capacitor and measure thecurrent required to maintain that voltage. Charge a capacitor to a fixed voltage. Then measurethe change of the open circuit potential of thecapacitor during self-discharge.Conway’s book includes a chapter discussing leakagecurrent and self-discharge of electrochemical capacitors.In an attempt to make the specifications of an EC lookgood, some manufacturers specify leakage current that ismeasured after 72 hours. Under these conditions,leakage current can be as low as 1 µA/F.Direct leakage current measurementDirect potentiostatic measurement of leakage current isquite challenging. A DC potential must be applied to thecapacitor and very small currents must be measured.Typically, charging currents are in amps and leakagecurrents are in microamps, a range of 106. Noise and/ordrift in the DC potential can create currents that arelarger than the leakage current itself.For example, assume the 3 F EDLCs used in this notehave an ESR of 100 mΩ. To measure leakage currents of1 µA on these capacitors current noise should be lessthan the 1 µA signal.At frequencies where ESR dominates the impedance,0.1 µV of noise in the applied voltage will create a noisein current of 1 µA. At lower frequencies, wherecapacitance dominates the impedance, a voltage drift of0.3 µV/s creates a current of 1 µA.Fast data acquisition, external noise sources, or lack of aFaraday cage can lead to large apparent DC currents orcontinual switching between current ranges.A special script has been developed for direct leakagecurrent measurement using the PWR800 software.This script was added to Gamry’s Framework in Rev.5.61 and is named:PWR Leakage Current.expThe special script uses a user entered estimate for ESRto avoid I/E converter ranges where voltage noise canoverload the current measurement circuitry. Do notuse the potentiostatic test in Gamry’s PWR800 softwareto measure leakage currents.Figure 10 – Leakage current measurement on a 3 F EDLC over fivedays at 2.5 V. For details, see text.Ileakage is still falling five days after applying the potential.After 72 hours the measured current was about 4.2 µA,after five days it reached 3.2 µA. The manufacturerspecifies leakage current on this capacitor at less than5 µA after 72 hours.Note the periodic noise signal at low currents that iscaused by daytime air conditioning. The data in this plotwas smoothed using a Savitzky-Golay algorithm with a60 second window.Measurement of self-dischargeSelf-discharge causes the open-circuit voltage of acharged capacitor to decrease over time. Leakagecurrent discharges the capacitor during self-discharge –even though there is no external electrical current.Conway’s book describes three different mechanisms forself-discharge. They can be distinguished by analyzingthe shapes in voltage versus time curves recorded overlong time periods. This analysis was not done on thedata presented here.Figure 11 shows the diagram of a self-dischargemeasurement. A 3 F EDLC was first charged to 2.5 V andthe potential was held for 12 hours. The open-circuitvoltage was measured and recorded versus time.The self-discharge measurement was done with aspecial script. This script was added to Gamry’sFramework in Rev. 5.61 and is named:PWR Self-Discharge.expUse in the Echem Analyst’s Common Tools menu theLinear Fit function to calculate the slope of the curve.
ConclusionThis application note discussed theoretical and practicalbasics of electrochemical capacitors.Fundamental mathematical equations were explainedand the right classification of capacitors was shown.Gamry’s PWR800 cyclic voltammetry test setup wasintroduced. Based on this, CV measurements wereperformed on EDLCs and pseudocapacitor to showdifferences of these energy storage devices.Figure 11 – Self-discharge measurement on a 3 F EDLC.( ) Linear-least-square fit. For details, see text.Voltage change for this capacitor was less than 2 mV after30 minutes. The red line is a linear-least-square fit of thevoltage decay data. The slope of the line is 0.55 µV/s.The leakage current can be calculated using Equation 5:Further on, two different methods were shown tomeasure leakage current. For this, Gamry Instrumentsoffers two special scripts.Testing Electrochemical Capacitors, Part 1 – Cyclic Voltammetry andLeakage Current. Rev 1.02 3/14/2012 Copyright 1990 - 2012Gamry Instruments, Inc.Ileakage 3 F 0.55 µV/s 1.65 µA734 Louis Drive Warminster, PA 18974, USA Tel. 215 682-9330 Fax 215 682-9331 www.gamry.com info@gamry.com
Cyclic Voltammetry Cyclic Voltammetry (CV) is a widely used technique in electrochemistry. Early in a development project, CV yields basic information about a capacitive electrochemical cell, including: Voltage window Capacitance Cycle-life A comprehensive description of CV is well beyond the scope of this document.