Transcription
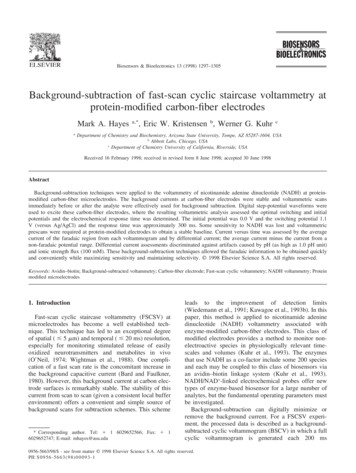
Biosensors & Bioelectronics 13 (1998) 1297–1305Background-subtraction of fast-scan cyclic staircase voltammetry atprotein-modified carbon-fiber electrodesMark A. Hayesaa,*, Eric W. Kristensen b, Werner G. KuhrcDepartment of Chemistry and Biochemistry, Arizona State University, Tempe, AZ 85287-1604, USAbAbbott Labs, Chicago, USAcDepartment of Chemistry University of California, Riverside, USAReceived 16 February 1998; received in revised form 8 June 1998; accepted 30 June 1998AbstractBackground-subtraction techniques were applied to the voltammetry of nicotinamide adenine dinucleotide (NADH) at proteinmodified carbon-fiber microelectrodes. The background currents at carbon-fiber electrodes were stable and voltammetric scansimmediately before or after the analyte were effectively used for background subtraction. Digital step-potential waveforms wereused to excite these carbon-fiber electrodes, where the resulting voltammetric analysis assessed the optimal switching and initialpotentials and the electrochemical response time was determined. The initial potential was 0.0 V and the switching potential 1.1V (versus Ag/AgCl) and the response time was approximately 300 ms. Some sensitivity to NADH was lost and voltammetricprescans were required at protein-modified electrodes to obtain a stable baseline. Current versus time was assessed by the averagecurrent of the faradaic region from each voltammogram and by differential current; the average current minus the current from anon-faradaic potential range. Differential current assessments discriminated against artifacts caused by pH (as high as 1.0 pH unit)and ionic strength flux (100 mM). These background-subtraction techniques allowed the faradaic information to be obtained quicklyand conveniently while maximizing sensitivity and maintaining selectivity. 1998 Elsevier Science S.A. All rights reserved.Keywords: Avidin–biotin; Background-subtracted voltammetry; Carbon-fiber electrode; Fast-scan cyclic voltammetry; NADH voltammetry; Proteinmodified microelectrodes1. IntroductionFast-scan cyclic staircase voltammetry (FSCSV) atmicroelectrodes has become a well established technique. This technique has led to an exceptional degreeof spatial ( ⱕ 5 m) and temporal ( ⱕ 20 ms) resolution,especially for monitoring stimulated release of easilyoxidized neurotransmitters and metabolites in vivo(O’Neil, 1974; Wightman et al., 1988). One complication of a fast scan rate is the concomitant increase inthe background capacitive current (Bard and Faulkner,1980). However, this background current at carbon electrode surfaces is remarkably stable. The stability of thiscurrent from scan to scan (given a consistent local bufferenvironment) offers a convenient and simple source ofbackground scans for subtraction schemes. This scheme* Corresponding author. Tel: 1 6029652566; Fax: 16029652747; E-mail: mhayes@asu.eduleads to the improvement of detection limits(Wiedemann et al., 1991; Kawagoe et al., 1993b). In thispaper, this method is applied to nicotinamide adeninedinucleotide (NADH) voltammetry associated withenzyme-modified carbon-fiber electrodes. This class ofmodified electrodes provides a method to monitor nonelectroactive species in physiologically relevant timescales and volumes (Kuhr et al., 1993). The enzymesthat use NADH as a co-factor include some 200 speciesand each may be coupled to this class of biosensors viaan avidin–biotin linkage system (Kuhr et al., 1993).NADH/NAD -linked electrochemical probes offer newtypes of enzyme-based biosensor for a large number ofanalytes, but the fundamental operating parameters mustbe investigated.Background-subtraction can digitally minimize orremove the background current. For a FSCSV experiment, the processed data is described as a backgroundsubtracted cyclic voltammogram (BSCV) in which a fullcyclic voltammogram is generated each 200 ms0956-5663/98/ - see front matter 1998 Elsevier Science S.A. All rights reserved.PII: S 0 9 5 6 - 5 6 6 3 ( 9 8 ) 0 0 0 9 3 - 1
1298M.A. Hayes et al. / Biosensors & Bioelectronics 13 (1998) 1297–1305(Wightman and Wipf, 1990; Kuhr et al., 1993). For thisbackground-subtraction procedure, the analytical performance of the FSCSV measurement is enhanced innumerous ways, most notably by addressing the tradeoff between temporal resolution and current signal-tonoise ratio (while retaining qualitative information).Digital background-subtraction techniques permit sensitive measurements over a short time course withoutdecreasing the scan rate to diminish background capacitive currents. Separation of the faradaic information ofthe analyte from the background ensures that theinherent selectivity of the FSCSV measurement is alsoretained. This selectivity is quantitated by the positionof the oxidative and/or reductive peak potential whichdifferentiates the species on the basis of their electrontransfer kinetics. This technique allows this qualitativeinformation to be recorded in a fast, sensitive manner(Wightman and Wipf, icroelectrodes, which transduce the non-electroactiveanalytes into an electroactive species through the interaction of cofactors have been developed (Pantano andKuhr, 1993). This microelectrode utilizes avidin–biotininteraction to immobilize enzymes onto the electrodesurface. The dehydrogenase family of enzymes is particularly attractive for this purpose since their activity islinked to the electroactive cofactor, NADH. The cofactorgenerated in this manner acts as an electron-transfermediator that can be monitored by FSCSV at carbonfiber surfaces. While the FSCSV for the oxidation ofNADH produces high faradaic currents and low overpotential at bare carbon-fiber microelectrodes, the responseat an enzyme-modified surface is diminished (Pantanoand Kuhr, 1993; Hayes and Kuhr, 1998a). The diminished FSCSV response occurs because the carbon-fibersurface is both the site of electron transfer and ofenzyme-immobilization. A quantitative balance betweenthese two tasks has been attempted and, because theseare competing activities, some voltammetric performance has necessarily been sacrificed (Pantano and Kuhr,1993; Hayes and Kuhr, 1998a, b).Factors were evaluated that control the quality of aBSCV generated at a dehydrogenase-modified carbonfiber microelectrodes to allow full interpretation of theavailable information. Near the detection limit forNADH the results of these background-subtraction parameters were most pronounced.A digitally generated potential-step waveform wasused to excite carbon-fiber electrodes to generate aBSCV. The carbon-fiber electrodes required an electrochemical pretreatment to provide low overpotential andhigh faradaic currents for the oxidation of NADH. Thesepretreated electrodes were used to characterize the background-subtraction technique. First, the switching andinitial potentials were determined and the response timewas then characterized. Background currents were foundto drift more at protein-modified electrodes than freshlypolished electrodes, but stable background currents wereobtained after a series of voltammetric prescans wereperformed. To obtain qualitative voltammetric information, the scans used for background subtraction mustbe chosen, both in number and position. These choiceswere characterized for sensitivity and stability. Improvement of the signal-to-noise ratio was obtained by bothfull-scan summing and averaging, and averaging eachthree adjoining data points within a single scan. Currentartifacts caused by pH flux and ionic strength changeswere eliminated by using information available withineach scan. Current arising in non-faradaic potentialregions was used to compensate those within faradaic,or information-containing, regions. These data manipulations reduced sensitivity, but could compensate for pHflux up to 1.0 pH units and ionic strength changes of100 mM. These digital excitation and data manipulationtechniques provide a convenient and powerful methodto obtain information quickly and with high sensitivityfor the electrochemical measurement of NADH.2. Experimental2.1. ChemicalsGlutamate dehydrogenase (GDH, 40 units/mg, lamino)propyl) carbodiimide (EDC) (SigmaChemical Co., St Louis, MO, USA); sulfo-NHS-LCbiotin (Pierce Chemical Co., Rockford, IL, USA), andpoly(oxyalkylene)diamine (Jeffamine ED-2001; Texaco Chemical Co., Houston, TX, USA) were used asthey were received. Phosphate buffer (PBS; 0.15 MNaCl, 0.10 M Na2HPO4, pH 8.5) was prepared withreagent grade chemicals in water purified by a Milli-Qwater purification system (Millipore, Bedford, MA,USA). All FSCSV measurements were conducted in pH8.5 phosphate buffer.2.2. Carbon-fiber microelectrodesThe fabrication of carbon-fiber microelectrodes hasbeen described previously (Pantano and Kuhr, 1993). All10 m diameter carbon-fiber microelectrodes (ThornelP-55S; Amoco Performance Products, Greenville, SC,USA) were bevelled at a 30 angle for 10 min on a polishing wheel covered with 1 m diamond paste (MetadiII; Buehler, Lake Bluff, IL, USA). Residual polishingmaterials were removed by sonicating the electrodes inhot toluene and then in de-ionized water for 10 s. Unlessotherwise noted, all 10 m diameter carbon-fibermicroelectrodes were electrochemically treated in 1.0 MHCl by a 3 s, 50 Hz cyclic potential waveform generatedbetween 0.2 V and 1.8 V (versus Ag/AgCl). All 32
M.A. Hayes et al. / Biosensors & Bioelectronics 13 (1998) 1297–13051299 m diameter carbon fiber (Textron Specialty Materials,Lowell, MA, USA) microelectrode surfaces were polished on a glass wheel embedded with 8–10 m diamond particles (Sutter Glass, Novato, CA, USA). These32 m diameter carbon-fiber electrodes were furtheractivated with a 0.2 to 2.0 V (versus Ag/AgCl), 50Hz waveform in pH 8.5 PBS (Hayes and Kuhr, 1998a).The derivatization of carbon-fiber microelectrodeswith biotinylated-GDH has been described in detail(Pantano and Kuhr, 1993). In brief, the modified eggwhite protein, ExtrAvidin, serves to link biotinylated(sulfo-NHS-LC-biotin) GDH to a biotinylated- (sulfoNHS-LC-biotin) hydrophilic tether (Jeffamine ED-2001)which is covalently bound (EDC linkage) to the carbonfiber surface.current plots subtracted the average current from apotential range where faradaic analyte current is absentfrom the average current data. This data manipulationallows changes in buffer composition which influenceelectrode capacitive currents to be compensated. Thecurrent changes caused by capacitive influence will bereflected equally in faradaic and non-faradaic regions.Therefore, this non-faradaic current region provides abackground-subtraction source for compensation ofthese artifact currents. Plots may also be created in athree-dimensional view. Some data was exported as anASCII file and manipulated in Lotus 1-2-3 (Lotus Development Corp., Cambridge, MA, USA) or Excel(Microsoft, Redmond, WA, USA).2.3. Instrumentation3. Results and discussionFast-scan cyclic-staircase voltammetry was performedwith an EI-400 potentiostat (Cypress Systems, Lawrence, KS, USA) which was designed to accommodateplacement of the working electrode pre-amplifier insidea faraday cage. All staircase cyclic voltammetric waveforms were generated, and currents acquired, with an80486 PC microcomputer utilizing a 12-bit, 20 kHzA/D–D/A interface (Labmaster DMA; Scientific Solutions, Solon, OH, USA). All potentials reported werereferenced to a 0.4 mm o.d. Ag/AgCl electrode. A 400kHz digital oscilloscope (Nicolet instruments Model310; Madison, WI, USA) was used to acquire the staircase waveform shown in Fig. 1(a); the waveform wasacquired with 1 ms (Fig. 1(a) inset) and 200 ms (Fig.1(a)) oscilloscope time constants. All currents wererecorded with a faraday cage with a flow-injection analysis (FIA) system previously described, where buffer (1.5ml/min) was now controlled by a peristaltic pump(Model 203; Scientific Industries, Bohemia, NY, USA)(Kuhr et al., 1993). All FSCSV measurements acquiredwere filtered within a 1–3 kHz range by the two-pole,low pass filter (3 db between 1.5 Hz and 15 kHz) of theEI-400 potentiostat.The exceptional spatial and temporal resolution of afast-scan voltammetric measurement is made possible bythe rapid electrochemical response of microelectrodes(approximately a 1 s time constant) (Wightman andWipf, 1990). An experiment may be performed at a scanrate of 100 V/s, when the oxidative and reductive scansacross a 1 V region are completed in 20 ms. When thesescans are repeated at 100 Hz, the time course of themeasurement provides sub-second temporal resolution(approximately 200 ms), where selective and sensitivedata can be recorded in the same measurement(Wightman et al., 1988).Digitally generated step-potential waveforms areinstrumental for these measurements (Bilewicz et al.,1989; Murphy et al., 1989; Karpinski and Osteryoung,1993). With fast linear scan rates, the capacitive(residual) current (ic) increases linearly with an increasing scan rate, whereas the faradaic current (if) followsonly a square root dependence. At high scan rates, thecapacitive current is dominant. The use of step-potentialwaveforms and time-delay digital data acquisition minimize the contributions of capacitive currents at fast scanrates, thus allowing the relative amount of faradaic current to increase.A cyclic staircase potential waveform (Fig. 1(a)) isdescribed by its potential step-height and its potentialstep-width, in which the scan rate (V/s) is determinedby their ratio (Howell et al., 1986). The advantage ofthis technique arises from the temporal control of thecurrent measurement. Digital sampling provides foracquisition of the current at any point along the potentialstep width. Since the decay of capacitive currents arefast (e t/Rc, where t is time, R is the electrode resistanceand C is the electrode capacitance), and the decay of thefaradaic current follows a slower time dependence (t1/2),the current is recorded at the end of the potential step(arrows, Fig. 1(a) inset).The background current at a carbon-fiber microelec-2.4. Data manipulation and presentationFIA data may be presented in a variety of formats.Qualitative data for BSCV in cyclic voltammetric-format(CV) was obtained by subtracting background scansfrom analyte scans. The background scans may bechosen from data sets before or after the analyte plug.Time versus current information is presented in twodistinct formats: average current and differential current.The average current versus time plots is the average current of a potential range from each cyclic voltammogram-format data set (typically including the peak potential (Ep) of the analyte). This potential range for averagedcurrent may be varied and was investigated. Differential
1300M.A. Hayes et al. / Biosensors & Bioelectronics 13 (1998) 1297–1305Fig. 1. Fast-scan cyclic staircase voltammetry (100 V/s, 100 prescans) at a polished and electrochemically pretreated, 10 m diameter carbonfiber microelectrode. (a) Cyclic staircase potential waveforms, in which the oxidative and reductive scans across a 1.2 V region (t 22 ms) wererepeated every 200 ms. (a, Inset) An individual potential step was 18.30 mV high and 0.18 ms long. All currents were sampled at the end of eachpotential step (arrows). (b) Three-dimensional view of the oxidative portion, plotted in an upward direction, of the FSCSV experiment. (c) Averageoxidative current versus time when the time course for the appearance of NADH is ascertained by monitoring the oxidative current between 714and 934 mV versus Ag/AgCl. (d) Cyclic staircase voltammograms (average of 10 scans) acquired during (boxes) and after (triangles) the 4 s FIAinjection of 100 M NADH. (e) BSCV created by the digital subtraction of the two voltammograms from (c).
M.A. Hayes et al. / Biosensors & Bioelectronics 13 (1998) 1297–1305trode contains not only capacitive components but alsofaradaic components. The faradaic component of theresidual background current stems from the carbon-oxygen moieties that are localized on the carbon surface,most notably quinones and hydroquinones (Wiedemannet al., 1991; Kawagoe et al., 1993a). While the use ofdigital staircase waveforms discriminates against capacitive currents, the background current is significantlyaffected by these surface-bound faradaic processes(Howell et al., 1986; Kawagoe et al., 1993b). Since thebackground current is only partially discriminatedagainst with this technique, further improvements areneeded.Far greater results for improving if/ic and the signal-tonoise ratios have been reported with background-currentsubtraction (Howell et al., 1986). For this technique, FIAprovides the stable background-currents because theenvironment of the microelectrode surface is constant,except for the introduction of the sample bolus(Engstrom et al., 1988). This stable background currentis necessary to prevent distortion of the faradaic information (Howell et al., 1986; Kawagoe et al., 1993a, b).A well-formed electrochemical response to a 100 Mbolus of NADH and a stable background current isshown in Fig. 1(b and c) at a polished carbon-fibermicroelectrode. This demonstrates a consistent background current, and the introduction of analyte does notproduce artifacts (odd peak shape, hysteresis, etc.).To optimize FSCV further for the electrochemicalmeasurement of NADH when performed at carbon-fibermicroelectrodes, several electrochemical pre-treatmentswere explored. These were examined for their ability tooptimize the quality and reproducibility of the NADHresponse for FSCV. A mild anodic treatment in HCl produced low overpotential and high faradaic currents foroxidation of NADH (Pantano and Kuhr, 1993) (Fig. 1(dand e)) at 10 m diameter carbon-fiber electrodes,whereas 32 m carbon fibers required treatment in pH8.5 PBS to produce similar results (Hayes and Kuhr,1998a). While low overpotential and high faradaic currents can be observed at freshly polished carbon-fibersurfaces, there was considerable variability from electrode to electrode. The BSCV shown in Fig. 1(e) wasgenerated at a pretreated electrode by subtracting voltammetric scans acquired after the FIA injection (Fig.1(c), triangles) from the voltammetric scans acquiredduring the injection (Fig. 1(c), boxes). This result demonstrates a BSCV where the facile electron-transferinformation is retained through the subtraction process.Measurement of the response time of this system wasaccomplished by monitoring the current from 800 to1100 mV (faradaic current from oxidation of NADH)versus time (Fig. 1c). The response observed to thissquare-wave input was an electrochemical measurementcharacteristic of the temporal response of the sensingsystem. The response of a pretreated carbon-fiber1301microelectrode to the injection of NADH in a FIAFSCSV experiment is quite rapid (Fig. 1(c)); the timerequired to reach 63% of the steady-state current isapproximately 300 ms.3.1. Selection of initial and switching potentialsWhile FSCSV of the NADH at a polished, electrochemically pretreated carbon-fiber microelectrode typically exhibits an oxidative peak potential at 800 mV versus Ag/AgCl (Fig. 1(e)), this anodic wave is shifted morethan 300 mV positive following the enzyme-modification procedure (Pantano and Kuhr, 1993; Hayes andKuhr, 1998b). A switching potential of 1100 mV (versusAg/AgCl) was used because it was the maximum potential allowed without significant interference from theoxidation of the background buffer. The possibility ofusing the reductive NADH current to improve sensitivityis eliminated since oxidation of NADH at carbon electrodes is chemically irreversible (Moiroux and Elving,1979, 1980).The choice of an initial potential is influenced by otherfactors that are associated with the use of these probesin vivo. In previous in vivo FSCSV determinations forstimulated release of catecholamines, a 400 mV(versus Ag/AgCl) initial potential was required(Wightman et al., 1988). This value was chosen toensure the complete reduction of the oxidized quinonepresent on numerous biological molecules of interestgenerated during the oxidative voltammetric scan. Fluctuations in the concentrations of these species couldinterfere with the analysis of NADH. Nonetheless, evenif no detectable quinone/hydroquinone redox couplewere present in solution, quinone and hydroquinones onthe carbon-fiber surface itself would always be present(Kawagoe et al., 1993a). An initial potential of 0.0 V(versus Ag/AgCl) was chosen to eliminate thequinone/hydroquinone redox couple, thus avoiding possible artifacts from this process altogether.3.2. Background current driftRepetitive cycling of a potential waveform willimprove the stability of the background current, whenthis cycling allows the electrode surface to approach asteady state (Kinoshita, 1988). In vivo voltammetryexperiments typically require a 10 min cycling of thepotential waveform after implantation before any data isacquired (Wightman et al., 1988). The majority of thisvoltammetric degradation occurs within the first fewminutes after implantation. With carbon-fiber surfaces,the sensitivity is diminished, but the background currentswill remain stable for the remainder of the experimentand therefore background-subtraction techniques maybe employed.A carbon-fiber surface with immobilized enzymes
1302M.A. Hayes et al. / Biosensors & Bioelectronics 13 (1998) 1297–1305also requires cycling of the voltammetric waveform touse the background-subtraction technique. Quantitativeevaluation of the background current upon repetitivecycling of the voltammetric waveform was investigated(Fig. 2). The number of conditioning prescans to eliminate or minimize the drift observed at an enzyme-modified electrode surface was determined. A flat baselinewas produced with approximately 700 prescans, and1000 prescans were used before analytical voltammograms were recorded (Fig. 2(b)). This number of prescanscan be generated in 2–3 min in a FSCSV experimentdepending on the exact conditions.Fig. 2. Baseline drift as a function of the number of prescans. (a)The oxidative current of 100 M NADH (4 s FIA injection), between800 and 1100 mV (forward scan), versus time. The two time courseswere at the same 32 m diameter carbon-fiber microelectrode following 100 prescans (top) and 700 prescans (bottom). (b) Baseline slopeversus the number of prescans. The baseline-slope data was acquiredat a 32 m diameter carbon-fiber microelectrode from the respectiveoxidative current versus time plots.3.3. Selection of voltammograms for BSCVThe sensitivity of FSCSV for NADH was degradedby the fabrication procedure for enzyme-modified electrodes. The initial faradaic response for the NADH oxidation was diminished by more than 84%, and the oxidative peak potential shifted. This reduces the claritywith which the NADH oxidative signal can be interpreted and requires that all measures be examined tomaximize the signal-to-noise ratio.The reduction in sensitivity caused by these voltammetric shifts led to a quantitative investigation of theselection of CVs used for the background subtraction.Consistent results were obtained whether the subtractionCVs were obtained immediately before or immediatelyafter the analyte plug. At high concentrations, there isno significant difference between using the backgroundscans from before or after the analyte plug. For this setof eight electrodes exposed to 100 M NADH in a 4 splug, there was only one difference (Table 1), anincrease of 8% (only 0.59 nA) in ip. Due to this slightincrease, background scans were used from after the analyte plug. However at lower concentrations even smalldifferences are important. Thus, the slight under-subtraction observed when the background is taken before injection of sample can severely affect the observed response.Therefore, it is generally best to use backgroundobtained after the injection of sample, since this is morerepresentative of the electrode condition during the sample.A single electrode was used to investigate anotheraspect of the background scans used for subtraction.Background scans were taken from long before (0–2 s,Fig. 2(a)) and long after (15–17 s, Fig. 2(a)) the analytebolus and subtracted. The resultant CVs had ip of 6.0nA; Ep of 930 and ip of 6.6 nA; Ep of 930, respectively.While the background currents generated at the carbonfiber surface remained remarkably stable throughout the17 s (85 scans) of the FIA measurement, it is notablethat the electrode does continue to change with time.Therefore, it is best to minimize the time allowedbetween sample and background scans. The optimumsubtraction is obtained by using the background immediately following the removal of the sample.The number of scans to be used for both the analyteand the background data sets were also investigated. Thenumber of scans for both the analyte data set and thebackground data set were kept equal and increased from1 to 16 (Fig. 3). The noise from the resultant BSCV wasplotted versus number of scans averaged, when the noisewas reduced by an approximate square root-dependencewith the number averaged. However, no significant S/Nenhancement was found after 10 scans were averaged,indicating that unknown factors other than random noisecontribute significantly to the noise for these electrodes.Noise reduction was also performed by averaging
M.A. Hayes et al. / Biosensors & Bioelectronics 13 (1998) 1297–13051303Table 1Position of scans used for background subtraction for BSCVLocation of background scans relative to analyte bolus(6-4 s)aElectrochemical parameterEp (mV)ip (nA)baBefore (1-3 s)After (9-11 s)ChangePercentage change856 176.50 0.42862 167.09 0.66 0.59 0.30 8 4.6All errors quoted are SEM.Average current from 800 to 1100 mV minus average current from 200 to 400 mV versus time for a 4 s FIA injection of 100 M NADH.bSignal optimization for time course measurementswas examined first. The signal potential range (Rsig) wasvaried and the signal intensity recorded (Fig. 4(a)). Forthis particular electrode (Ep 860 mV, Fig. 4(a)), themaximum signal intensity occurs when the voltage rangeencompasses Ep and greater, while minimizing otherpotential ranges. Current was collected from 苲 50 mVless than Ep to 1100 mV for the differential current versus time plots.Signal optimization for differential time coursemeasurements examined the background potential range(Rbkgrd) for the subtractive current. The backgroundFig. 3. Noise of background-subtracted cyclic voltammogram versusnumber of scans averaged. Both the background and signal scan numbers were increased equally. Data taken from FIA experiment similarto that shown in Fig. 1(c).each three points of adjoining data on the backgroundsubtracted CVs. For the average of three subtracted CVs,the noise was 0.82 nA and nine three-point averages ofa single CV resulted in 0.66 nA of noise. A combinationof a high number of averaged CVs and three-point averaging (11 scans, nine three-point averages) reduced noisefurther, but only to 0.60 nA. The number of scans utilized throughout the rest of this work was set at 10 toensure noise spikes (even smoothed with the three-pointaverages) did not give false Ep or ip values.3.4. Differential current versus time measurementsElectrochemical detection is not immune to its localenvironment: surface changes in pH, ionic strength, etc.,especially near detection limits may cause artifacts(Wiedemann et al., 1991; Kawagoe et al., 1993a). Background capacitance currents caused by these processeswere minimized by an additional quantitative datamanipulation. Current obtained in a voltage range whereno relevant faradaic current occurred was subtractedfrom the oxidative faradaic current. Capacitive effectsare independent of the value of the potential, dependingonly on the scan rate. So, the capacitive currents in thevoltammogram which overlap the faradaic signal areequal to those in the non-faradaic region.Fig. 4. Potential range optimization for differential current versustime data. (a) Potential range versus current intensity for average current plots. Ep for NADH at this carbon-fiber electrode was 860 mV.Range used was from the data point value to 1.1 V. (b) Potential rangeused for subtraction current versus current intensity for differential current plots. Average current values were obtained from 800 to 1100 mV.
1304M.A. Hayes et al. / Biosensors & Bioelectronics 13 (1998) 1297–1305potential range was varied from 0–100 mV to 0–1100mV (Fig. 4(b)), when there was no loss in sensitivityuntil the subtracted current potential range exceeded 400mV. This maximum range (400 mV) was optimal for thecompensation of buffer-caused capacitive changes to thecarbon-fiber electrode. This differential method produced a quantitative digital subtraction procedure, whichallows these experiments to be performed in areas of pHflux and ionic strength shifts (Kawagoe et al., 1993a).Special consideration must be given to large pH orionic strength shifts created with the FIA analyte bolus.Although a reduction in sensitivity occurs, pH shifts upto 1.0 pH units and ionic strength changes of 100 mMwere compensated with differential current data treatments. The need for alternative data treatment arises dueto an oxidative wave at 100 mV for pH shifts (Fig. 5(aand b)). In addition, large changes in ionic strengthresulted in significantly different currents arising acrossthe potential range due to these ionic effects alone. Tocompensate for these additional variable currents acrossthe potential range, which are not due to the oxidationof NADH, the differential potential ranges were shiftedto 800–1000 mV minus 700–800 mV. With this datamanipulation (Fig. 5(c)), the standard deviation of theoxidative current for NADH, while changing the boluspH from 7.5 to 9.0, improved from 9.6 nA (averagecurrent) to 0.15 nA (differential current, 6400%reduction) with a 64% loss
Fast-scan cyclic-staircase voltammetry was performed with an EI-400 potentiostat (Cypress Systems, Lawr-ence, KS, USA) which was designed to accommodate placement of the working electrode pre-amplifier inside a faraday cage. All staircase cyclic voltammetric wav-eforms were generated, and currents acquired, with an